


Trend Reversals and the Sushi Roll Reversal Pattern
FXOpen
Understanding trend reversals is essential for optimising trading and managing risks. This article delves into the concept of trend reversals, with a focus on the Sushi Roll reversal pattern—a sophisticated tool that helps traders anticipate significant market shifts—exploring its formation, context, and application.
Understanding Trend Reversals
As you know, a trend reversal indicates a change in the direction of a price movement, transitioning from an upward to a downward trajectory or vice versa. Recognising these reversals is crucial as they can signal opportunities to enter a trade or take profits.
A reversal must be distinguished from minor retracements or "pullbacks," which are short-term movements against a prevailing trend that do not signify a long-term change. Traders analyse reversals through various technical indicators and chart patterns, which provide visual cues and statistical evidence of potential shifts in market momentum.
Several well-known patterns signal trend reversals:
- Head and Shoulders: This pattern appears at the peak of an upward trend and features three peaks, with the middle one being the highest. Its completion, marked by a price fall below the support level—the "neckline"—confirms a trend shift to the downside.
- Double Tops and Bottoms: These patterns occur at the end of a trend and resemble the letter "W" (Double Bottom) or "M" (Double Top). A double top signals a move from an uptrend to a downtrend after failing twice to break through a resistance level, while a double bottom suggests a shift from a downtrend to an uptrend after failing to break a support level twice.
Identifying and confirming these patterns with other analysis tools allows traders to make informed decisions about entering or exiting positions, aligning their strategies with the new trend direction. Thus, understanding and recognising trend reversals is an essential skill in a trader's toolkit.
The Sushi Roll Reversal Pattern: An Overview
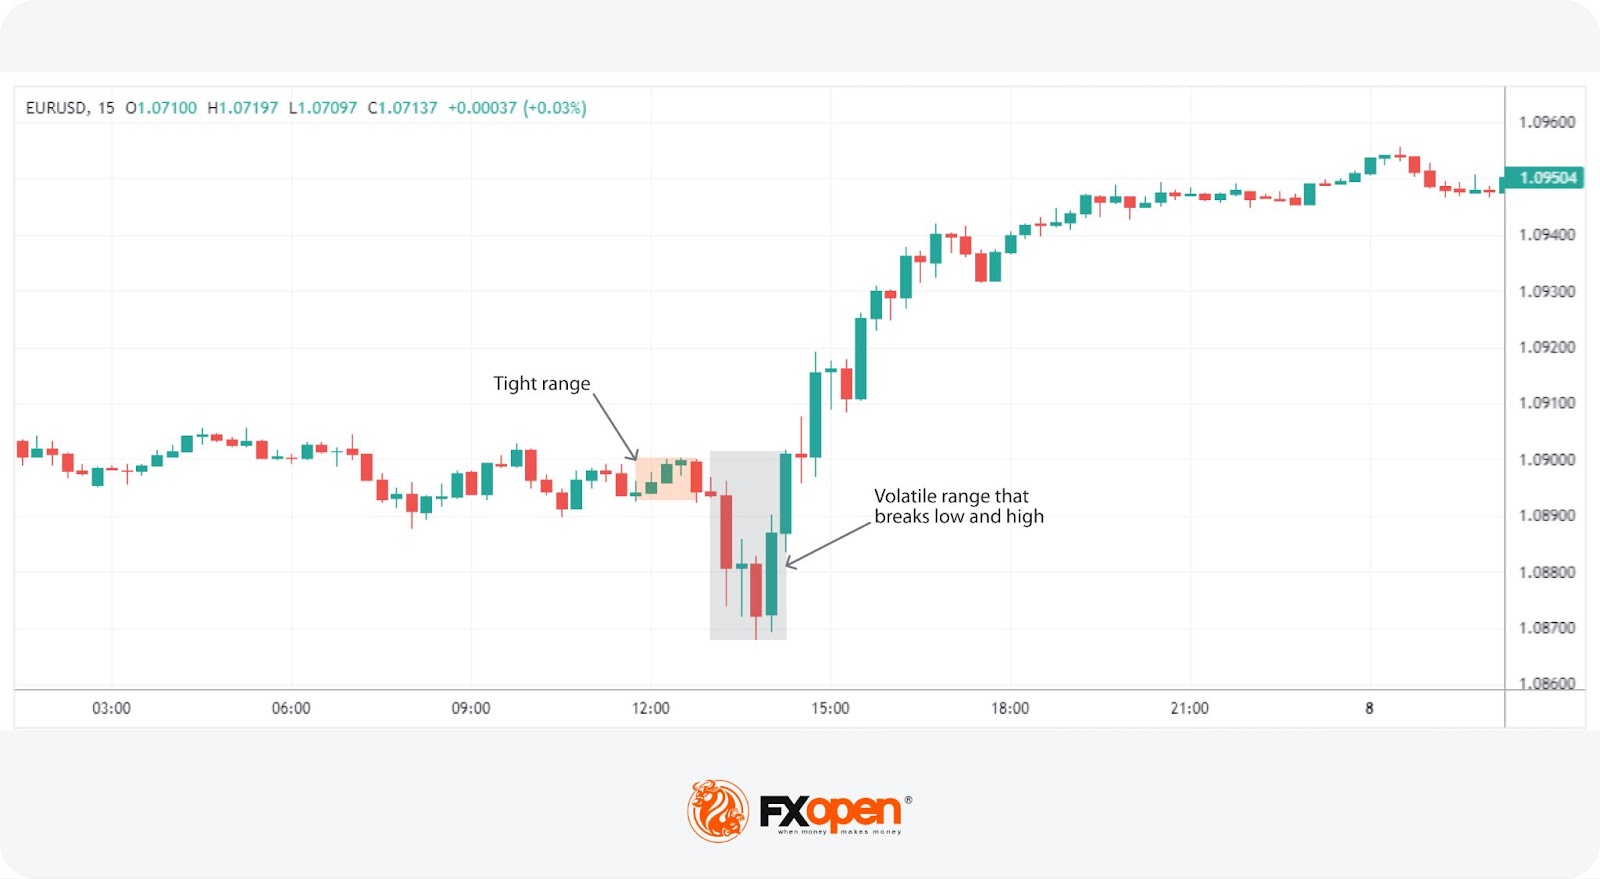
The Sushi Roll reversal pattern is a lesser-known but valuable technical analysis tool for spotting potential market reversals. It can effectively be viewed as an expanded version of the engulfing candle setup. Originating from trader Mark Fisher's work, this trend reversal pattern forms over a span of ten trading bars and is utilised to anticipate shifts from an existing trend.
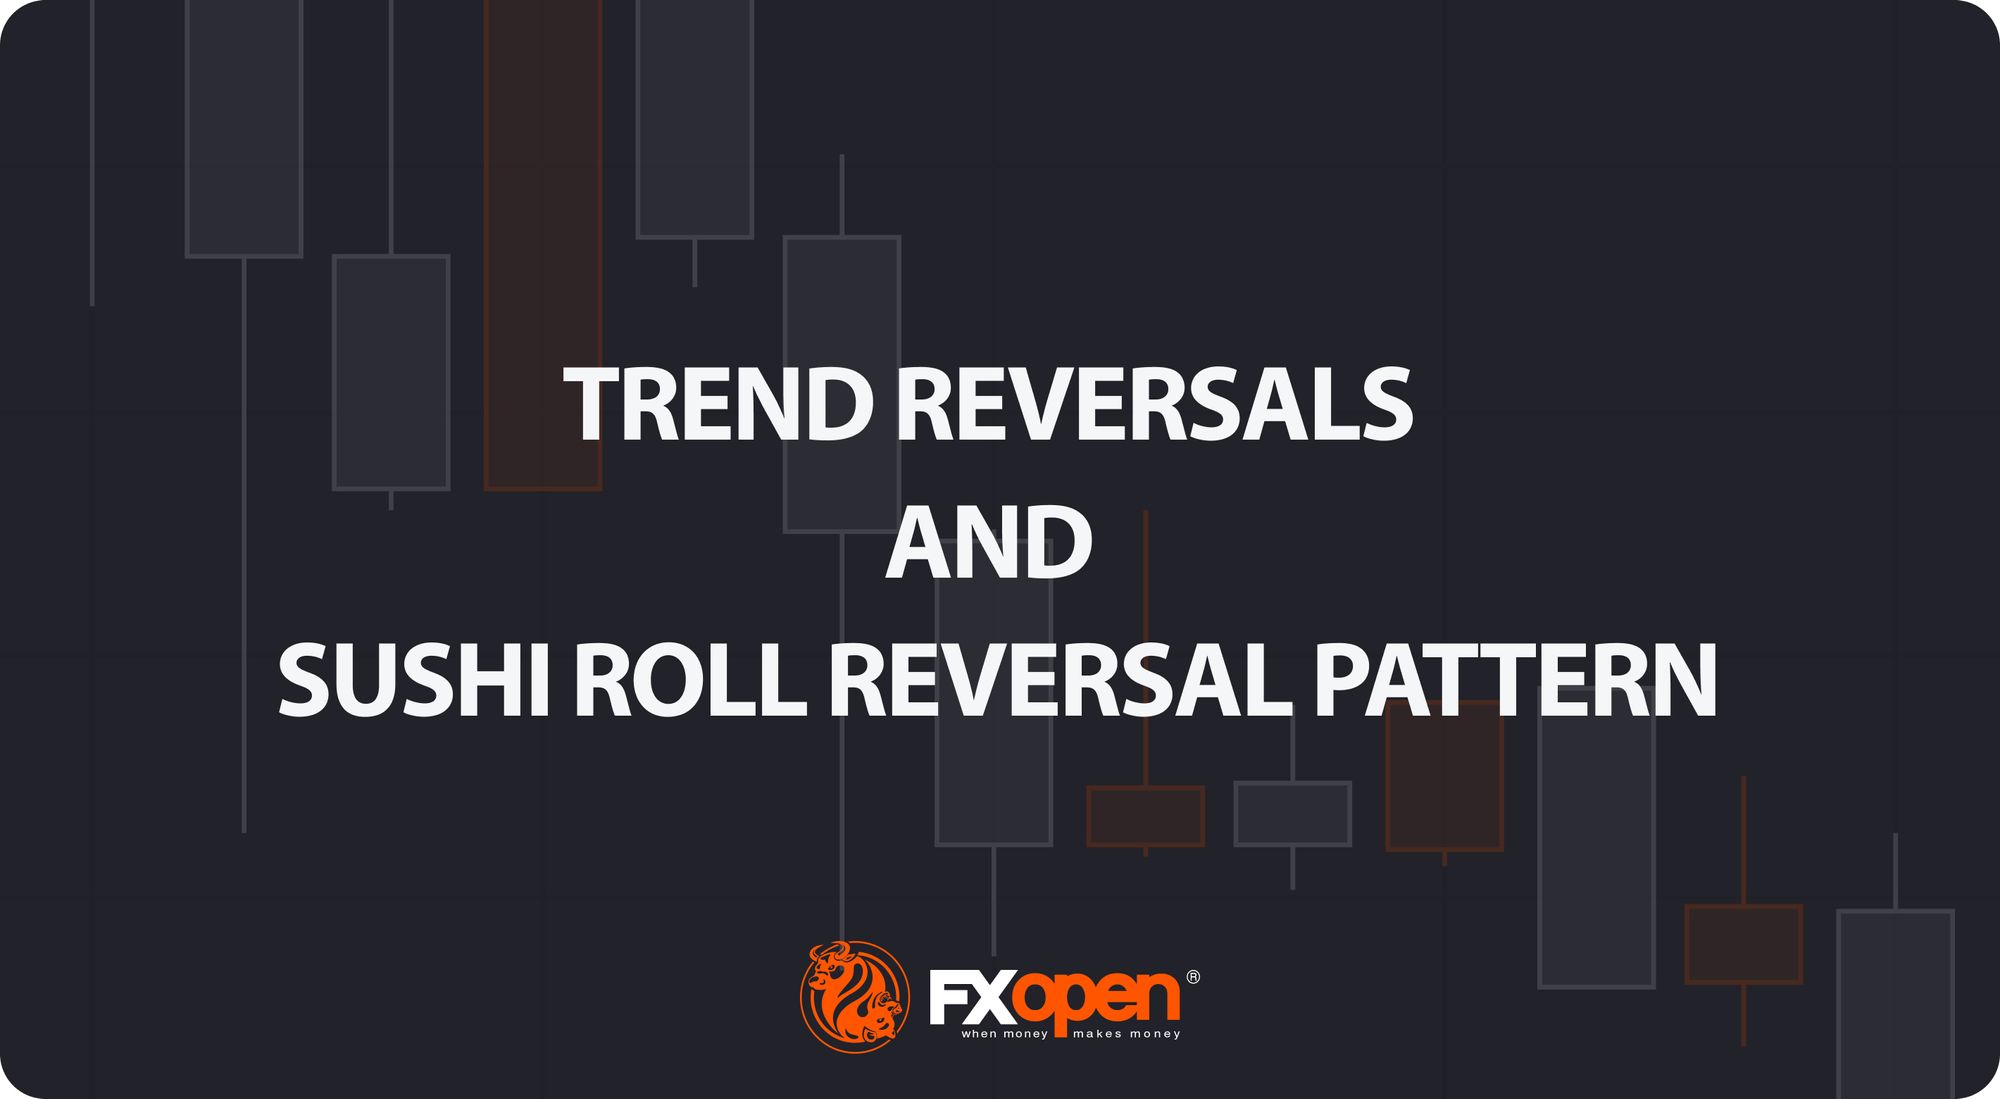
The structure of the Sushi Roll pattern is distinctive from other stock reversal patterns (however, note that it applies to all types of assets, including forex, commodities, and crypto*). It consists of two consecutive five-bar segments. The pattern is identified when the range of the first five candlesticks (high to low) is fully contained within the range of the subsequent five candlesticks. This formation suggests a consolidation and potential volatility increase, signalling traders to prepare for a possible trend reversal. On higher timeframes, this pattern could manifest as just two or three candles, with the latter completely overshadowing the earlier price action, resulting in an engulfing candle pattern.
Criteria for the Sushi Roll Reversal Pattern
- Ten-Bar Formation: The pattern unfolds over ten bars on the chart.
- Range Overlap: The high and low prices of the first five bars must be narrower than those of the next five bars.
- Contextual Positioning: It typically appears at the end of a prevailing trend, either an uptrend or a downtrend.
Analysing the Sushi Roll Reversal Pattern
Traders observe this pattern as a precursor to strategic decisions. When it appears during an uptrend, it might indicate a forthcoming downtrend, and vice versa.
Market Conditions and Reliability
The Sushi Roll pattern can emerge under various market conditions, but it is typically more prevalent and reliable at the peak or trough of significant trends.
The requirement that the highs and lows of the first range must be surpassed indicates an initial attempt to extend the existing trend, which fails as the price reverses and breaks through the opposite end of the range. This action is indicative of a liquidity grab—where market players trigger stop losses or entice latecomers before sharply reversing direction.
Flexibility in Bar Count
While the classic Sushi Roll pattern unfolds over ten bars, the exact number isn't rigid. Variations might occur over eight or twelve bars, with the key being the relative engulfment of one segment by another, not the specific count.
Application in Trading Strategies
The Sushi Roll reversal pattern, while powerful, is optimally used as a component of a broader trading strategy. The key to utilising the Sushi Roll effectively lies in its confirmation through additional indicators or a significant price movement following the pattern. Here’s how traders may enhance its effectiveness:
Seeking Additional Confirmation
Using the Sushi Roll pattern in conjunction with other forms of analysis can significantly improve the reliability of the signals it generates. For instance, in markets like forex, stocks, and commodities, the impact of significant news events can align closely with technical signals.
A news release that shifts market sentiment, such as unexpected corporate news or economic data announcements, can serve as strong confirmation if it aligns with the emergence of a Sushi Roll pattern.
Utilising Momentum Indicators
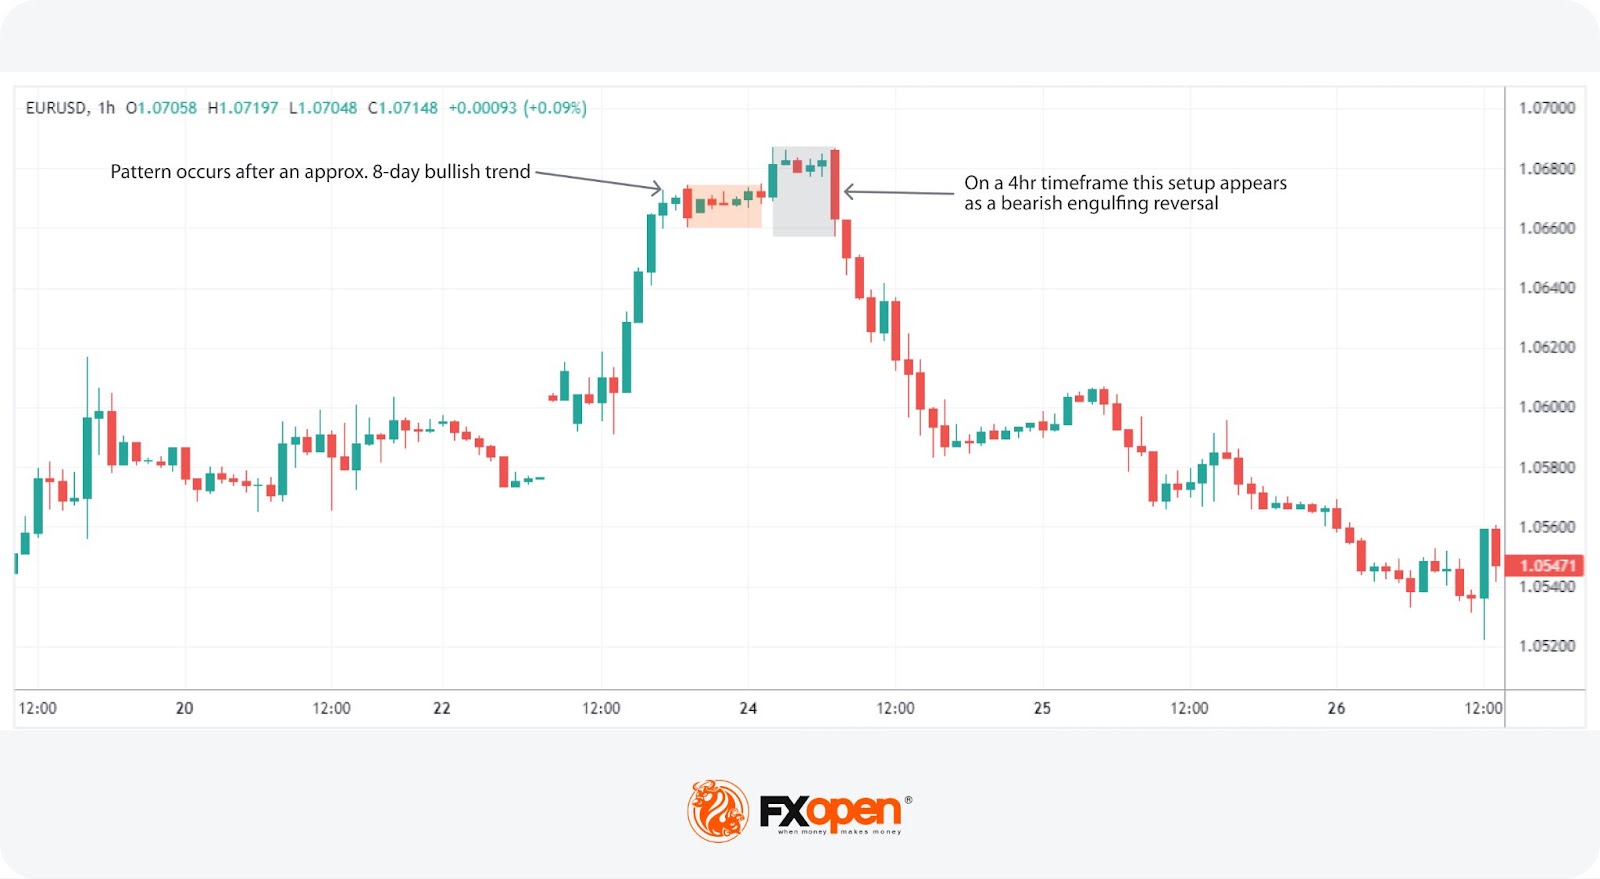
Incorporating momentum indicators such as the Stochastic Oscillator or Moving Average Convergence Divergence (MACD) can provide supplementary signals. Divergence on these indicators, where price movement and indicator direction do not align, can suggest weakening momentum and potential reversal.
The crossing of the Stochastic back into normal range from overbought or oversold conditions, or a crossover in the MACD line vs its signal line, can also confirm the likelihood of a reversal following a Sushi Roll pattern.
These indicators, alongside 1200+ trading tools, can be found in FXOpen’s free TickTrader platform.
Strategic Placement and Timeframe Alignment
The likelihood of a successful reversal increases if the Sushi Roll pattern forms at a key area of support or resistance. These levels are natural points where reversals are prone to occur.
Additionally, if the pattern aligns with a higher timeframe trend, it provides further validation. For example, the pattern forming at the end of a bearish pullback in an overall bullish market may indicate the resumption of the upward trend.
Entry and Risk Management
Traders typically enter a trade after the Sushi Roll pattern is confirmed, which is marked by the price moving past, and ideally closing beyond, the high or low of the initial range of the pattern. Setting stop losses just beyond the extreme of the second range may help to manage risk.
Given that the pattern aims to capture the onset of reversals, setting profit targets at forthcoming support or resistance levels—where another reversal could occur— may help maximise potential returns while managing exposure.
The Bottom Line
The Sushi Roll reversal pattern is an insightful tool for traders aiming to identify significant trend reversals. This pattern, especially when combined with additional indicators and contextual market analysis, can inform strategic entry and exit points, thereby potentially optimising trading outcomes. Traders interested in exploring this and other sophisticated trading strategies may consider opening an FXOpen account to access a world of advanced trading platforms and tools.
FAQs
What Is a Reversal in Stocks?
A reversal in stocks refers to a change in the price direction of a stock. It marks the end of a current trend, either bullish or bearish, and the beginning of a new trend in the opposite direction. This shift is crucial for traders as it indicates potential entry or exit points based on the new trend's direction.
What Is the Trend Reversal Pattern?
The trend reversal pattern in technical analysis signals a potential change in the prevailing market trend. Examples include the Head and Shoulders, Double Tops and Bottoms, and the Sushi Roll reversal pattern. These patterns help traders identify when a trend might be shifting from upward to downward or vice versa.
What Is the Best Reversal Indicator?
The best reversal indicator can vary by trading style, but common choices include the Relative Strength Index (RSI), Moving Average Convergence Divergence (MACD), and Stochastic Oscillator. These tools help detect momentum shifts that may precede a price reversal.
What Is Reversal vs Continuation Pattern?
Reversal patterns indicate a potential change in the direction of the prevailing trend, leading to a new trend. In contrast, continuation patterns suggest that the current trend will persist after a brief pause or consolidation, such as triangles, flags, and pennants. Recognising these patterns helps traders anticipate and react to short-term price movements within broader trends.
*At FXOpen UK and FXOpen AU, Cryptocurrency CFDs are only available for trading by those clients categorised as Professional clients under FCA Rules and Professional clients under ASIC Rules, respectively. They are not available for trading by Retail clients.
This article represents the opinion of the Companies operating under the FXOpen brand only. It is not to be construed as an offer, solicitation, or recommendation with respect to products and services provided by the Companies operating under the FXOpen brand, nor is it to be considered financial advice.
Stay ahead of the market!
Subscribe now to our mailing list and receive the latest market news and insights delivered directly to your inbox.


Latest articles

Dow Jones (DJIA): Consolidation Beyond the Trend
Federal Reserve Chair Kevin Warsh testified before Congress on 14–15 July, reaffirming the Fed's commitment to bringing inflation back to target while providing no clear guidance on the future path of interest rates. Meanwhile, June inflation data came in

European Currencies Strengthen Ahead of Key Macroeconomic Releases
EUR/USD and GBP/USD continue to recover moderately following the recent weakening of the US dollar. European currencies have been supported by expectations that US inflationary pressures will continue to ease after softer-than-expected CPI and PPI data, reinforcing market

Brent Crude Oil: From Ceasefire to Crossfire — What's Next?
Just weeks ago, traders were pricing in peace. Now they're pricing in war again—and that reversal says everything about how fragile the current Middle East calm really is.
Brent crude has surged to $86 a barrel, its highest level