


What Is a Typical Price Indicator?
FXOpen

It’s no secret that making informed trading decisions often requires using technical indicators. Among these tools, the Typical Price stands out as one of the simplest to understand. In this article, we’ll run through how the tool works, how it’s calculated, and how it’s used.
What Is a Typical Price Indicator?
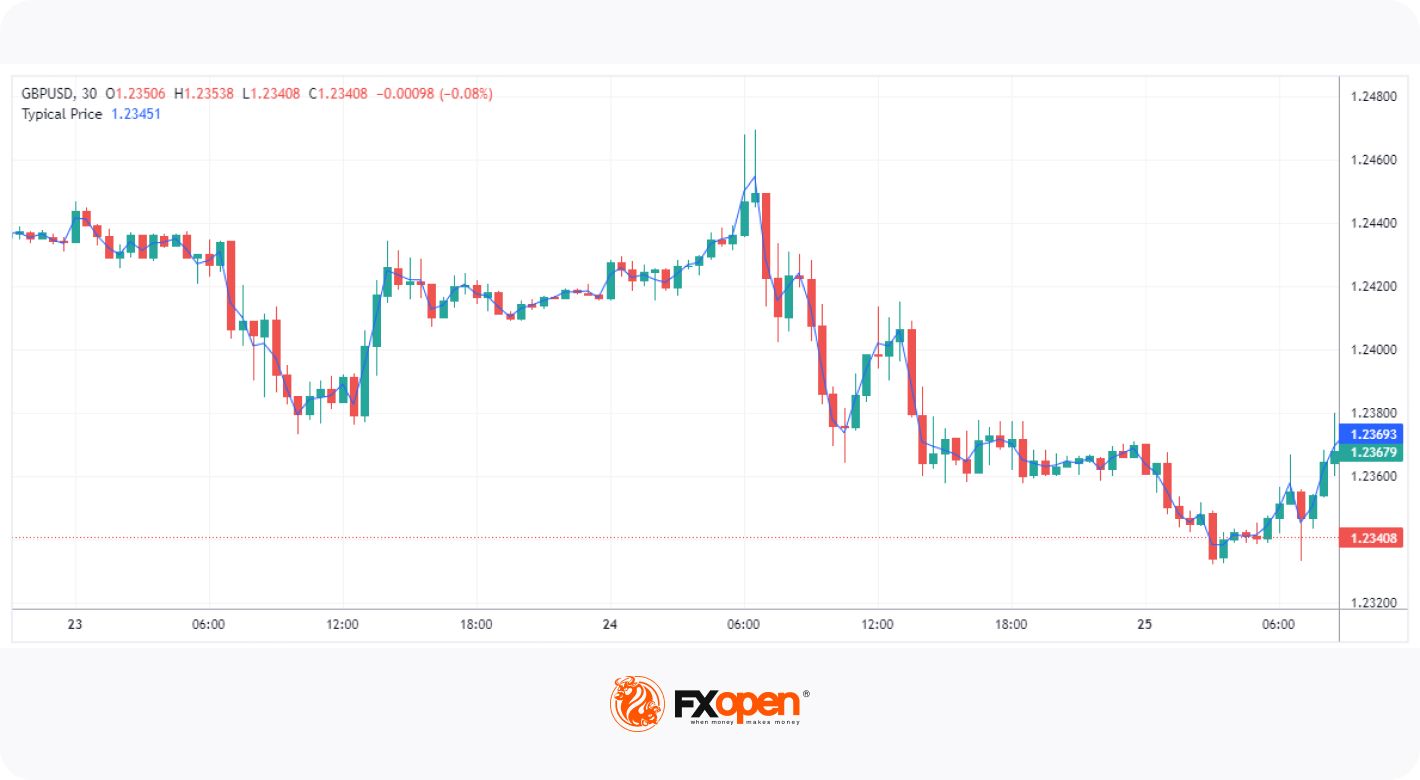
The Typical Price indicator, abbreviated to TP, is a single-line indicator that provides a more balanced view of an asset’s price movements than just looking at its closing price.
Calculating the TP is quite straightforward, requiring no complex formulas or intense calculations. You can head over to FXOpen’s free TickTrader platform if you’d like to see how it works for you. It’s calculated by taking the mean of the high, low, and closing prices for a given period. As a result, some may know it as HLC3 (high, low, close / 3).
The formula for the Typical Price is as follows:
TP = (High + Low + Close) / 3
As far as forex indicators go, the Typical Price is one of the simplest. It’s similar in principle to a moving average – it calculates the average from a series of data – except that it only accounts for the current candle. While its scope is relatively limited, it forms the foundation of other technical analysis tools, like the money flow index (MFI).
By averaging these three prices, it gives equal weight to the high, low, and close prices. The result is a value plotted on the chart as a single line within the high and low range of each candle.
How to Use the Typical Price Indicator
Using the Typical Price is not much different from other average-based tools. It serves to provide traders with a clearer perspective of price trends by eliminating much of the "noise" associated with market price fluctuations.
One way to use the TP is to identify potential trend directions. When its line rises, it demonstrates that the average price is moving upward, indicating an upward or bullish trend. Conversely, when it falls, it suggests a downward or bearish trend.
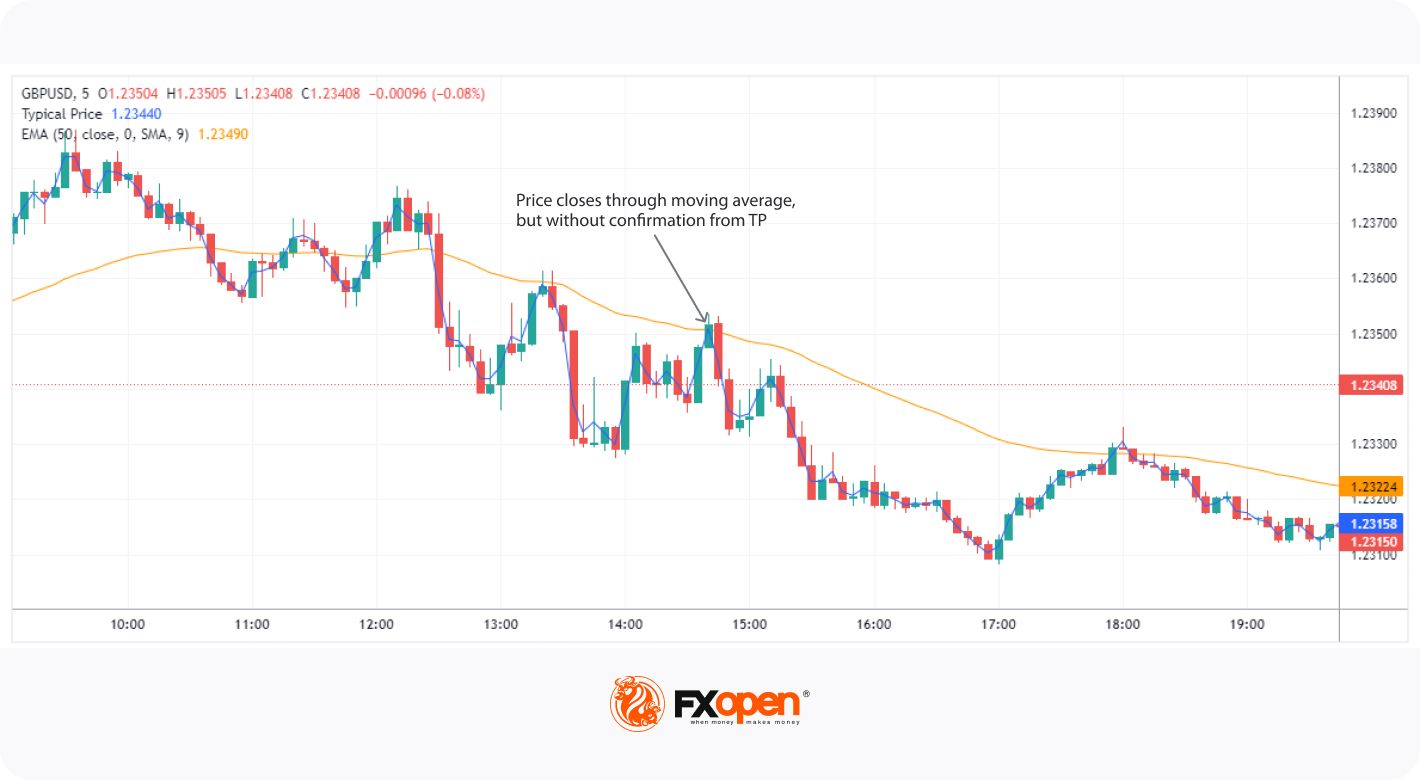
Traders who use the Typical Price often use it in moving average-penetration strategies. Instead of watching for a close through the moving average, they’ll wait for it to be penetrated by the TP line. In doing so, they have extra confirmation that momentum is likely to carry the price through the moving average. This can be adapted to any strategy that looks for closes beyond a particular point.
Related Indicators
The TP forms the basis of several other related technical tools. The money flow index is a prime example, using Typical Price as an integral part of its calculation. The MFI combines both price and volume data to measure the buying and selling pressure in an asset, providing traders with insights into potential reversals.
Another related tool is the commodity channel index (CCI), which also uses the Typical Price in its formulation. Like the MFI, the CCI helps traders predict turning points in the market. These related technical analysis tools show that, despite its simplicity, the TP can form the foundation of much more comprehensive tools that offer exceptional insight into the market.
Closing Thoughts
In summary, Typical Price is an effective tool that can help traders navigate the markets. It can be used on any timeframe and on a chart of any asset so that you can meet the Typical Price stock indicator or trade with it in forex, commodity, ETF, or cryptocurrency* markets. Its simplicity may dissuade some traders, but it’s also one of the least complicated technical analysis tools out there.
If you’re ready to put your own Typical Price strategy to the test, you can open an FXOpen account to gain access to over 600+ markets, competitive trading fees, and lightning-fast execution speeds. Happy trading!
*At FXOpen UK and FXOpen AU, Cryptocurrency CFDs are only available for trading by those clients categorised as Professional clients under FCA Rules and Professional clients under ASIC Rules, respectively. They are not available for trading by Retail clients.
This article represents the opinion of the Companies operating under the FXOpen brand only. It is not to be construed as an offer, solicitation, or recommendation with respect to products and services provided by the Companies operating under the FXOpen brand, nor is it to be considered financial advice.
Stay ahead of the market!
Subscribe now to our mailing list and receive the latest market news and insights delivered directly to your inbox.


Latest articles

Euro and Sterling Strengthen After Volatile Support Tests
EUR/USD and GBP/USD have moved into recovery mode following a sharp test of key support levels, although the market remains cautious ahead of the release of important macroeconomic data from the US, the eurozone and the UK. Earlier

S&P 500: Beijing Optimism Overshadowed by Debt Risks
Fundamental Background
On 14–15 May, a high-level US–China summit took place in Beijing, where both sides discussed the potential easing of trade tensions and certain mutual concessions. Against a backdrop of positive expectations, the S&P 500

Market Analysis: AUD/USD and NZD/USD Fresh Decline Signals More Weakness Ahead
AUD/USD failed to stay in a positive zone and declined below 0.7150. NZD/USD is also moving lower and might extend losses below 0.5800.
Important Takeaways for AUD/USD and NZD/USD Analysis Today
- The Aussie Dollar