


FXOpen
Have you been looking at a chart for hours, wondering when to buy or sell? In one moment, the chart is green, screaming “buy.” Next, it’s all red, and the price is falling. Buying or selling becomes a tough decision if you resonate with this. However, candlesticks on your chart can help you.
This FXOpen article will help cover one of them – the Marubozu candle pattern. Tag along to learn about this candlestick, its types, and how to trade using it.
What Is a Marubozu Candle?
A Marubozu is a candlestick with no wicks that has a long body. It signals a strong price action as buyers or sellers dominate the session. “Marubozu” is a Japanese term meaning “bald” or “close-cropped.”
It can be bearish (if the open price is above the close) or bullish (if the open price is below the close). When it occurs, traders prepare for a significant price movement. But first, how can you identify it?
Marubozu in a Range
In a range, the price moves within horizontal support and resistance. It indicates that the buyers and sellers are in a serious battle, and neither dominates. It also shows that traders have their hands folded with little activity.
A Marubozu might break the range, indicating that momentum is starting to build up. Aside from range, the Marubozu candlestick pattern occurs in a trend. This might be at its beginning, middle, or end.
Marubozu Starts a Trend
A new trend starting with a solid price movement may contain a Marubozu. It might pop up due to important news events. Traders who come on board early might have more room to capture new opportunities.
Marubozu in Mid-Trend
Whether it’s a bull run or a bear market, trends often slow down for some time. This causes traders to slow their activities. Afterwards, trends pick up the pace and continue in the same direction.
A Marubozu candlestick pattern may signal that traders’ momentum is back, and they can position themselves for market opportunities. This may occur mid-trend or after the trend halts for a period.
Marubozu Ends a Trend
The end of a trend is a spot where investors position themselves for new opportunities. Why? A new trend will likely begin, and catching it allows one to place a new trade. This is a reversal, and the Marubozu candlestick pattern can show when it occurs.
Use the TickTrader trading platform by FXOpen to examine these market conditions.
Marubozu Candle Types
There are two main types of the Marubozu pattern in forex, commodity, stocks, crypto*, and other markets.
Bearish Marubozu Candlestick
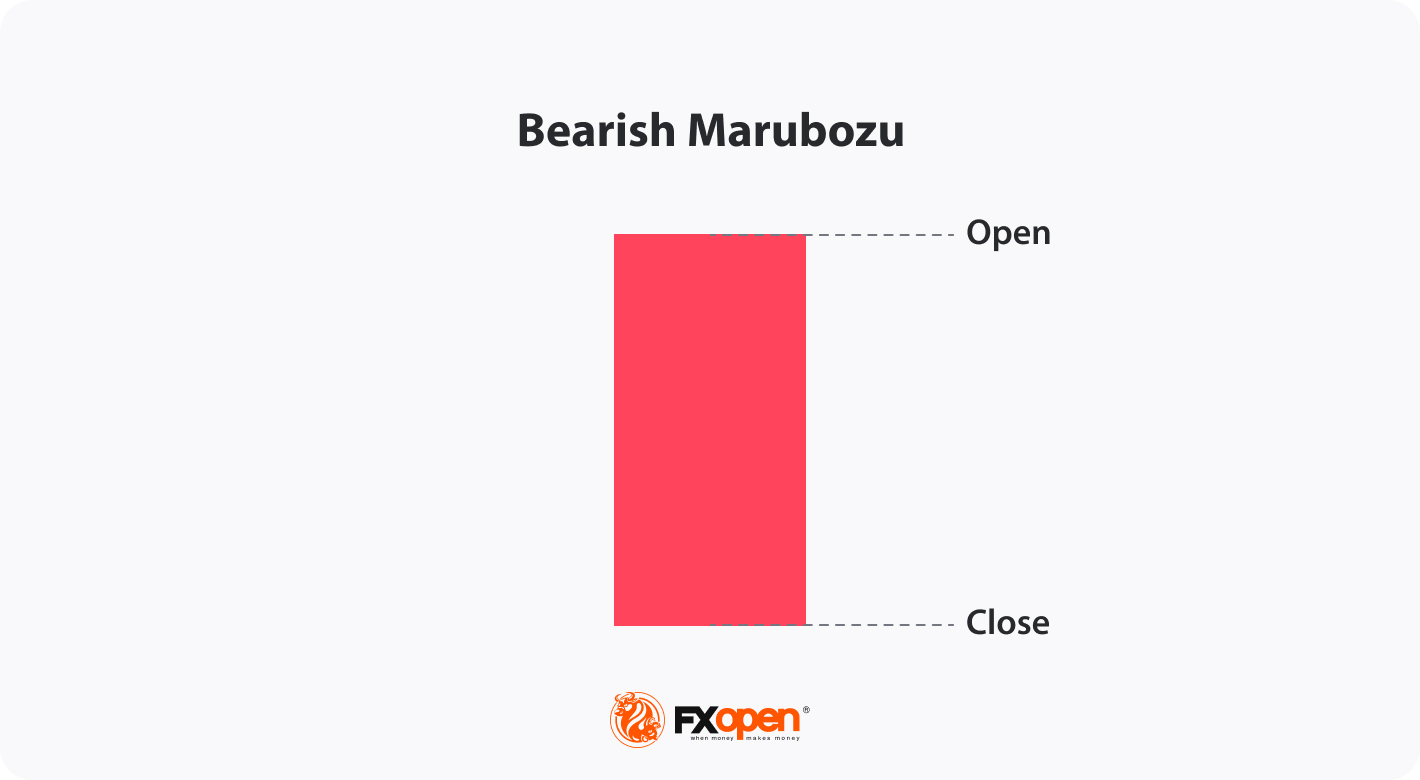
What does a red (bearish) Marubozu mean? A red Marubozu indicates strong selling pressure in the market. It forms when the open price is at the highest point of the period and the close price is at the lowest, meaning the price fell consistently throughout the session without any upward movement.
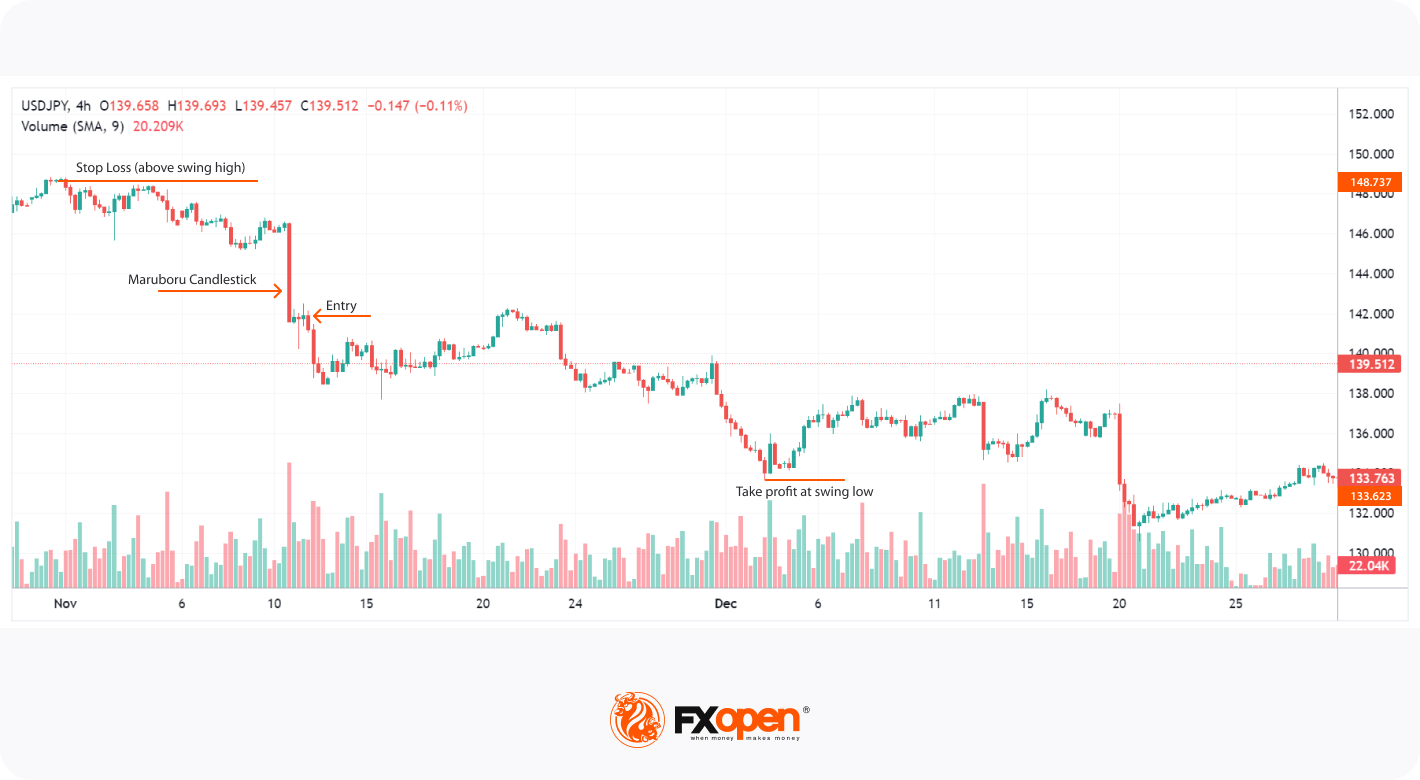
You may consider these steps in trading the bearish Marubozu pattern:
- Identify the bearish Marubozu.
- Consider opening a short trade at the next candle or after a few candles form.
- Place the stop-loss level above the nearest swing high.
- Take profit at the next swing low, support level, or based on other technical analysis tools.
Check this example for a vivid illustration:
Bullish Marubozu Candlestick
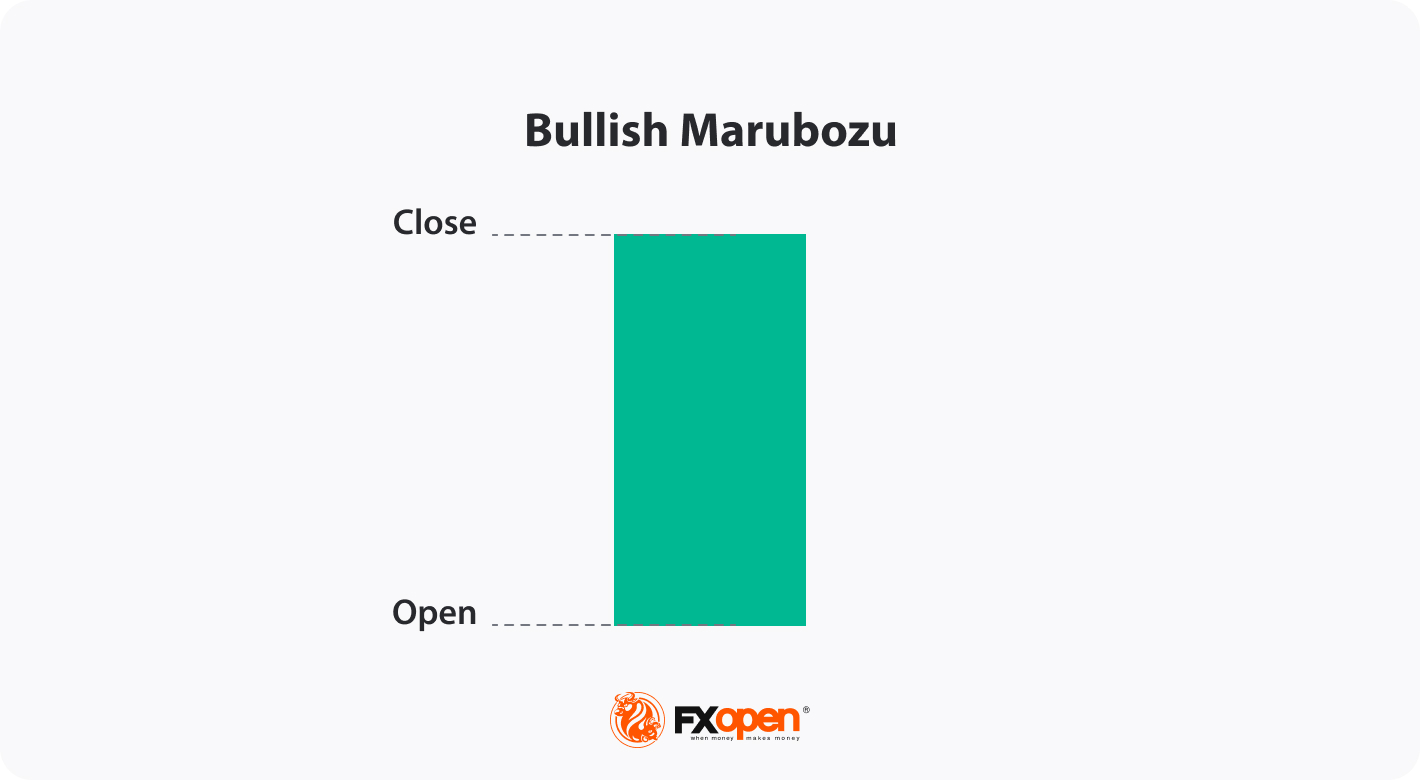
A bullish Marubozu is the opposite of the bearish version. It catches the eyes of bulls seeking buying opportunities. It opens at a low price and closes at a high, so it has no wicks. The significant length of the candle also indicates buying pressure.
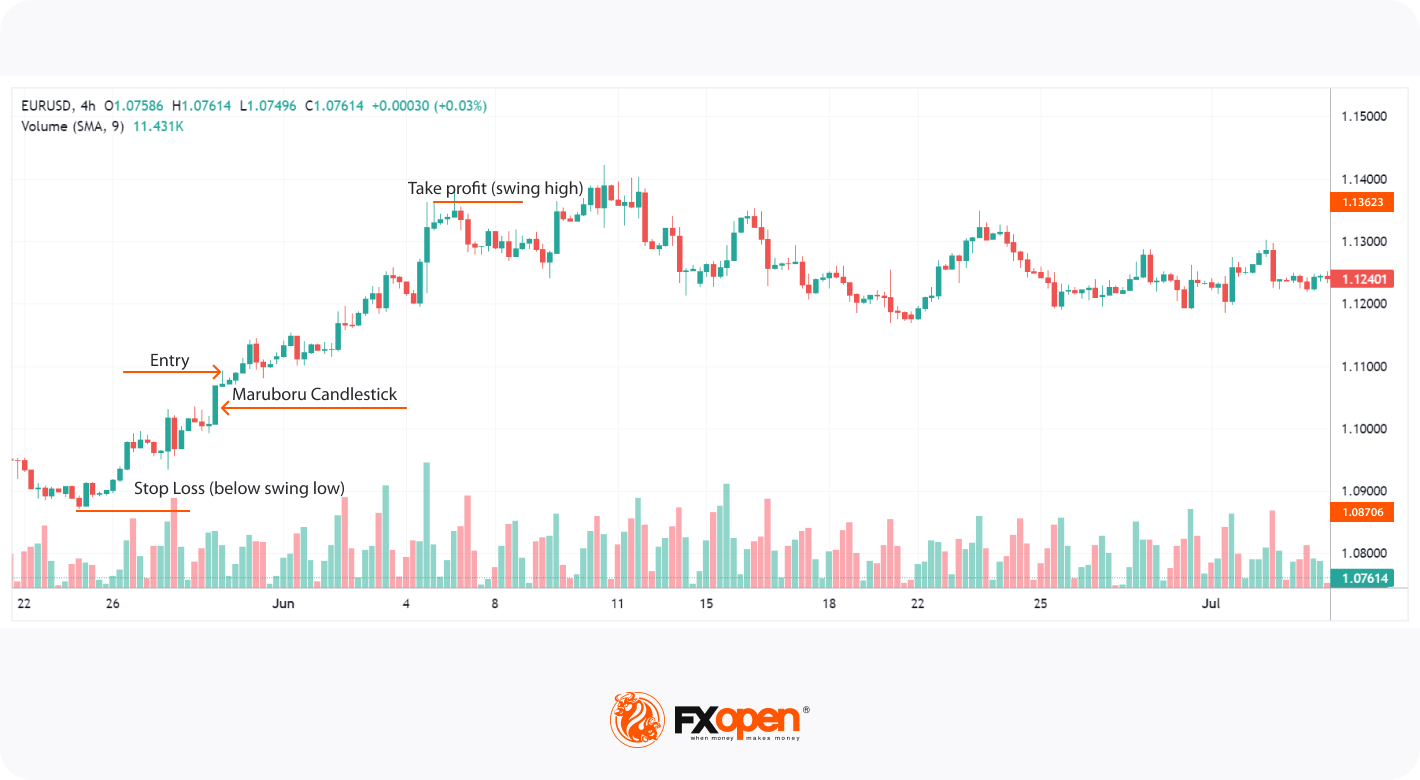
The theory states you can trade the bullish Marubozu candlestick pattern as follows:
- Identify the bullish (green) Marubozu candle.
- Consider going long at the opening of the next candle or after a few candles form.
- Place a stop-loss level below the closest swing low.
- Take profit at the next swing high, when the price begins to range, or when other technical analysis tools signal a price reversal.
Here’s an example providing more details:
How Can You Confirm a Marubozu?
Confirming the Marubozu candlestick pattern involves more than just spotting its distinct body. Traders often look for additional signals to validate the strength and direction indicated by the Marubozu. Traders typically consider the following factors for confirmation:
- Volume Spike: A significant increase in trading volume accompanying the Marubozu can suggest the price movement has conviction. The high volume shows that many market participants are behind the move.
- Trend Context: Marubozu patterns within an established trend hold more weight. For instance, a bullish Marubozu during an uptrend is more likely to lead to continued bullish action than one in a sideways market.
- Proximity to Key Levels: Traders often observe support and resistance levels. A Marubozu breaking through a key resistance or support level confirms momentum, as it shows the market overpowering those critical areas.
- Candlestick Clustering: The following candles can provide additional context. For example, if after a bearish Marubozu, bearish candles appear, it reinforces the downward momentum.
Limitations of the Marubozu Pattern
While the Marubozu candlestick pattern signals strong momentum, it comes with certain limitations that traders must consider:
- Lack of Context: A Marubozu doesn't provide enough context on its own. Without understanding the broader trend or the market conditions, it may not accurately determine future price movements.
- False Signals in Sideways Markets: In ranging or choppy markets, a Marubozu can create false signals. The pattern might suggest a breakout, but if the market is indecisive, the movement may not follow through.
- Absence of Retracement Information: The Marubozu doesn't indicate whether the price will retrace before continuing in the same direction. Traders may enter too early, only to face pullbacks that can hit stop-loss levels.
- Dependence on Volume: While a Marubozu shows strong price action, low trading volume can render it unreliable. A lack of volume behind the move could indicate weak conviction from market participants.
Trading Strategies Involving Marubozu
Finally, let’s take a closer look at a couple of Marubozu trading strategies.
Marubozu Retracement Breakout
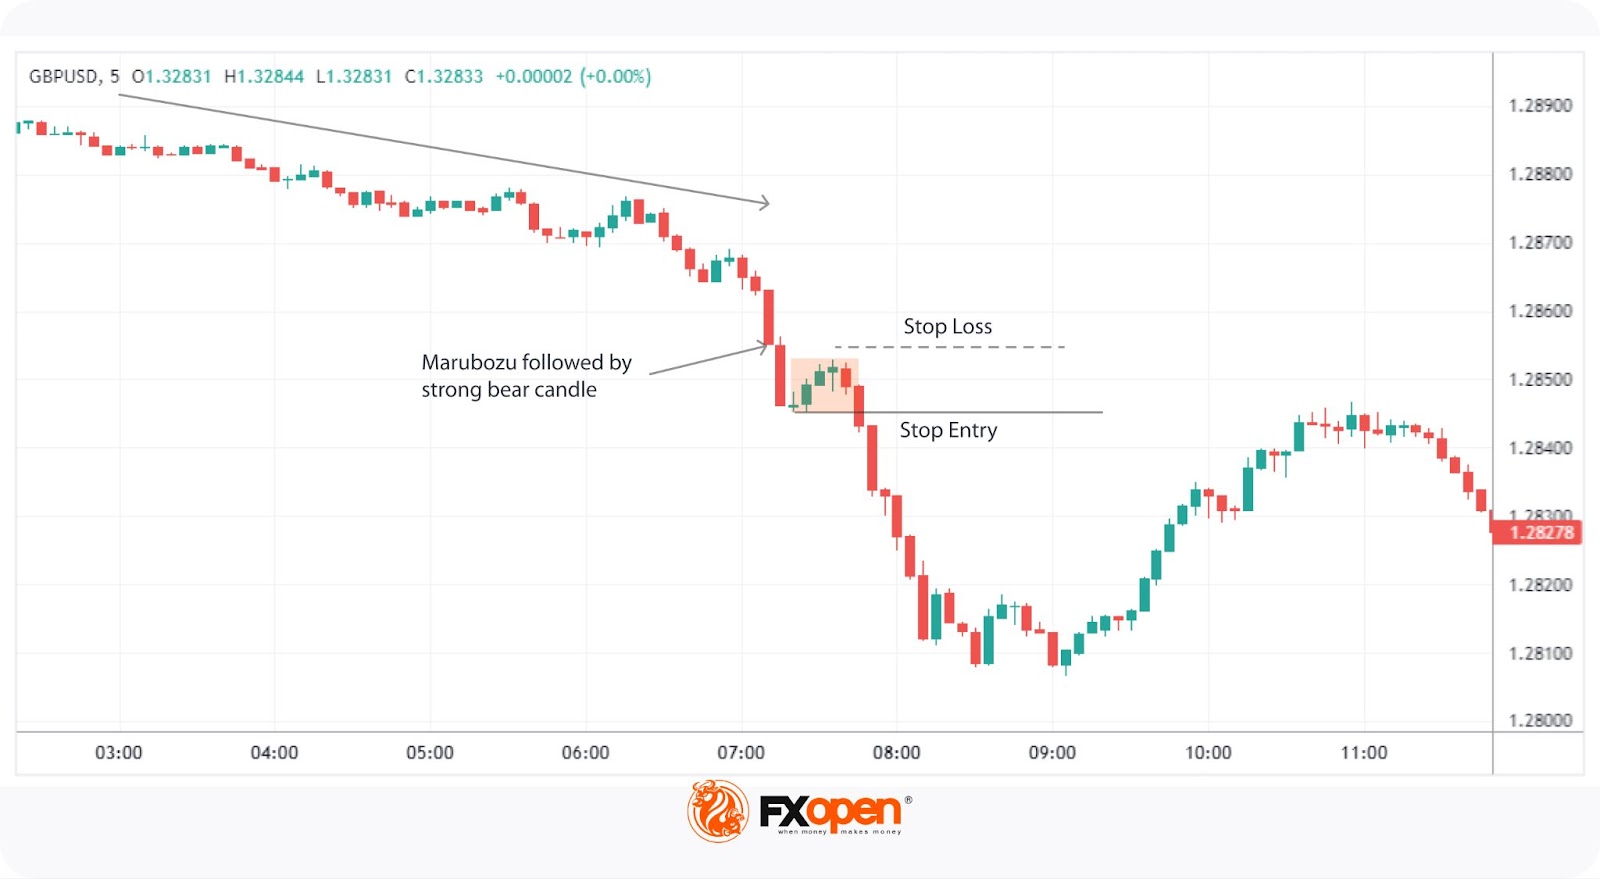
This strategy revolves around identifying a Marubozu candle in line with a broader trend and waiting for a brief price retracement before the trend continues—similar to the concept of a dead cat bounce. Traders can use this setup to capture trend breakouts.
Entries
After observing a Marubozu candle that aligns with the prevailing trend, traders typically wait for the moment when the price briefly moves against the trend before resuming. Once the retracement is identified, a stop order can be placed at the high (for bullish setups) or low (for bearish setups) of the candle formed before the retracement.
Stop Loss
Traders may place a stop-loss order above the opposite end of the retracement move. For a bullish setup, this means below the retracement low, while in a bearish setup, it would be above the retracement high.
Take Profit
Profits might be taken at a favourable risk-reward ratio, such as 1:3. Alternatively, traders may aim for a significant area of support or resistance where a reversal is likely.
Marubozu EMA Strategy
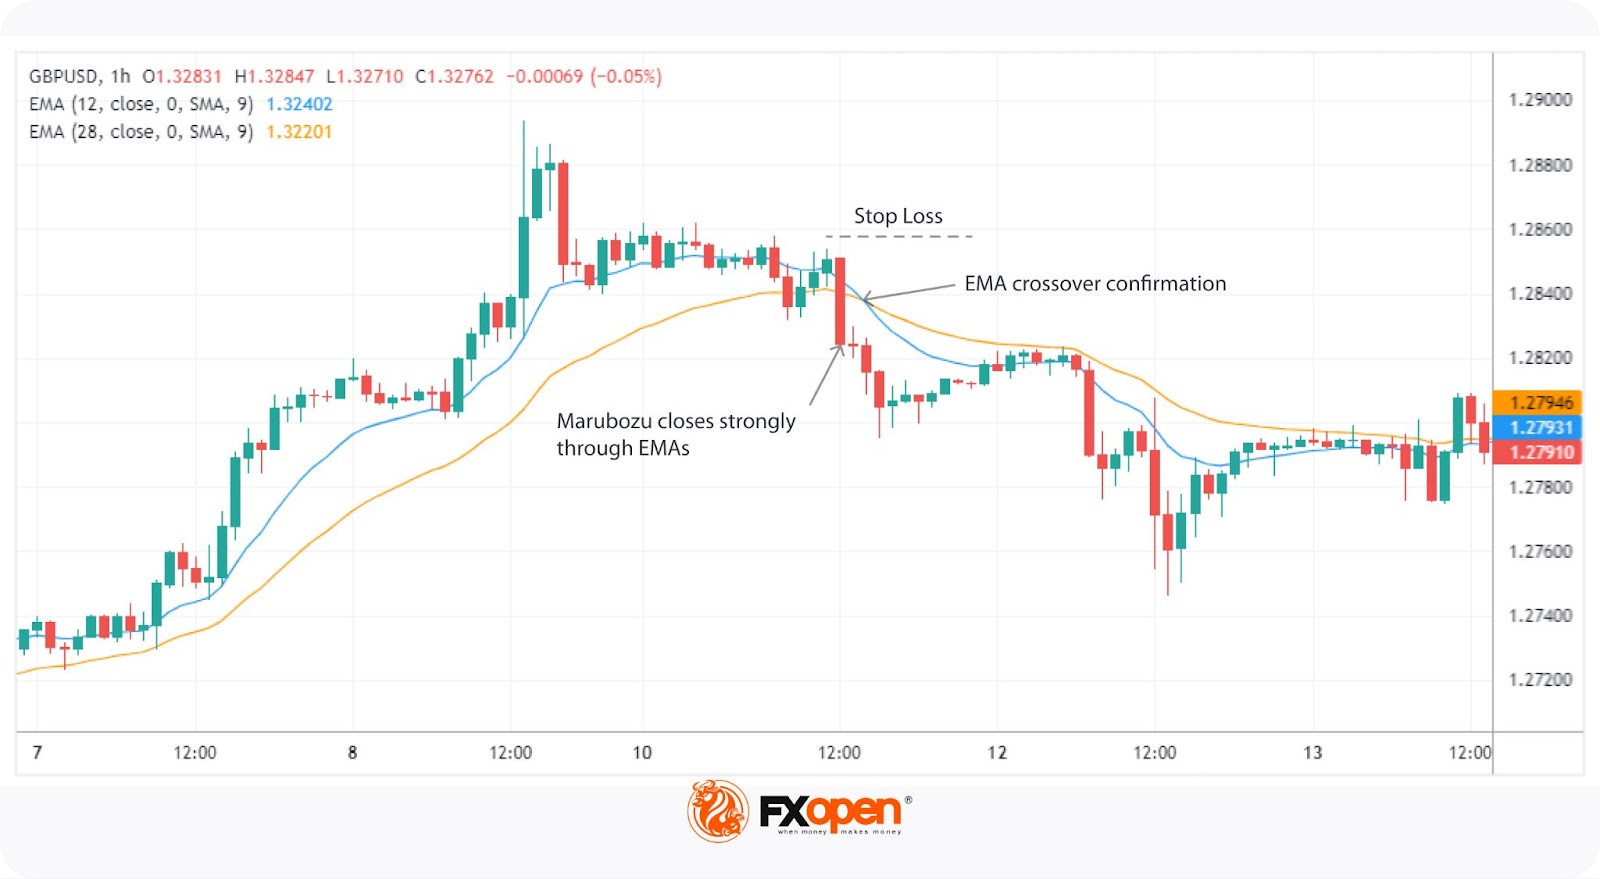
This strategy combines the Marubozu candlestick pattern with a pair of exponential moving averages (EMAs) to confirm strong trend momentum. Traders often use one short EMA and one long EMA, such as 12 and 28, though some may prefer alternatives like 9 and 21 or 20 and 50.
Entries
Traders typically look for the Marubozu candle to close strongly through one or, ideally, both EMAs. This signals strong momentum in the trend direction. Some traders may choose this as their entry point, while others may prefer to wait for extra confirmation, such as a crossover between the two EMAs, signalling a stronger trend continuation.
Stop Loss
Stop-loss orders might be set just beyond the high (for bearish setups) or low (for bullish setups) of the Marubozu candle. Alternatively, more conservative traders might place the stop beyond one of the recent highs/lows, depending on their risk tolerance and the specific setup.
Take Profit
Profits might be taken at a preferred risk-reward ratio, such as 1:3. Another common approach is to target a significant support or resistance level, where a reversal is more likely.
Final Thoughts
The Marubozu candlestick pattern, when combined with other forms of analysis and tools, offers traders a powerful way to capture market momentum. FXOpen provides an ideal platform for applying these strategies, offering more than 600 markets, blazing-fast speeds of trade execution, and competitive trading costs. Open an FXOpen account today to explore these opportunities and enhance your trading experience. Good luck!
FAQ
What Is a Marubozu in Candlestick?
The Marubozu candle meaning refers to a candlestick with no upper or lower wicks, indicating that the price opened and closed at extreme levels during a session. Its long body reflects strong buying or selling momentum, depending on whether it’s bullish (green) or bearish (red).
How Can You Identify a Marubozu?
A Marubozu candlestick can be identified by its lack of wicks. In a bullish Marubozu, the open price is at the lowest point, and the close is at the highest, signifying strong buying pressure. A bearish Marubozu is the opposite, with the open at the highest point and the close at the lowest, showing dominant selling pressure.
What Is the Difference Between Bullish and Bearish Marubozu?
The difference lies in price movement. A bullish Marubozu opens at a low and closes at a high, reflecting strong buying pressure. In contrast, a bearish Marubozu candlestick pattern opens at a high and closes at a low, indicating strong selling momentum.
How Can You Trade a Bullish Marubozu?
Traders often look for a bullish Marubozu pattern in uptrends or at key support levels. It suggests further upward momentum. Confirmation through volume or other indicators, like moving averages, is often sought to enhance trading decisions.
What Does a Marubozu Determine?
A Marubozu determines strong market momentum, with a bullish Marubozu indicating continued upward movement and a bearish Marubozu signalling further downward pressure or a potential trend reversal, depending on the market context.
How Does a Marubozu Work?
A Marubozu works by showing a candlestick with no wicks, indicating that either buyers (in a bullish type) or sellers (in a bearish type) were in complete control throughout the trading session, signalling strong market momentum in the direction of the candlestick.
*At FXOpen UK, Cryptocurrency CFDs are only available for trading by those clients categorised as Professional clients under FCA Rules. They are not available for trading by Retail clients.
This article represents the opinion of the Companies operating under the FXOpen brand only. It is not to be construed as an offer, solicitation, or recommendation with respect to products and services provided by the Companies operating under the FXOpen brand, nor is it to be considered financial advice.
Stay ahead of the market!
Subscribe now to our mailing list and receive the latest market news and insights delivered directly to your inbox.


Latest articles


Market Insights with Gary Thomson: Oil, US Retail Sales & NFP in Focus
In this video, we’ll explore the key economic events and market trends, shaping the financial landscape. Get ready for insights into financial markets to help you navigate the week ahead. Let’s dive in!
In this episode of Market

Geopolitics Fuels Volatility: AUD/USD and USD/CAD Near Key Levels
Commodity-linked currencies continue to weaken amid rising geopolitical tensions, which are boosting demand for safe-haven assets and increasing volatility across both FX and commodity markets. The US dollar is gaining support from demand for liquid and defensive assets, while currencies