


BTC and XRP - Impulsive increase likely ended
FXOpen

BTC/USD
From last week when the price of Bitcoin was sitting at $9145 at its lowest point on Monday, we have seen an increase of 24.31% measured to the highest point the price has been today which is the spike made at $11368. Since then we have seen a 4.58% retracement with the price currently sitting around $10953 and is in a downward trajectory.
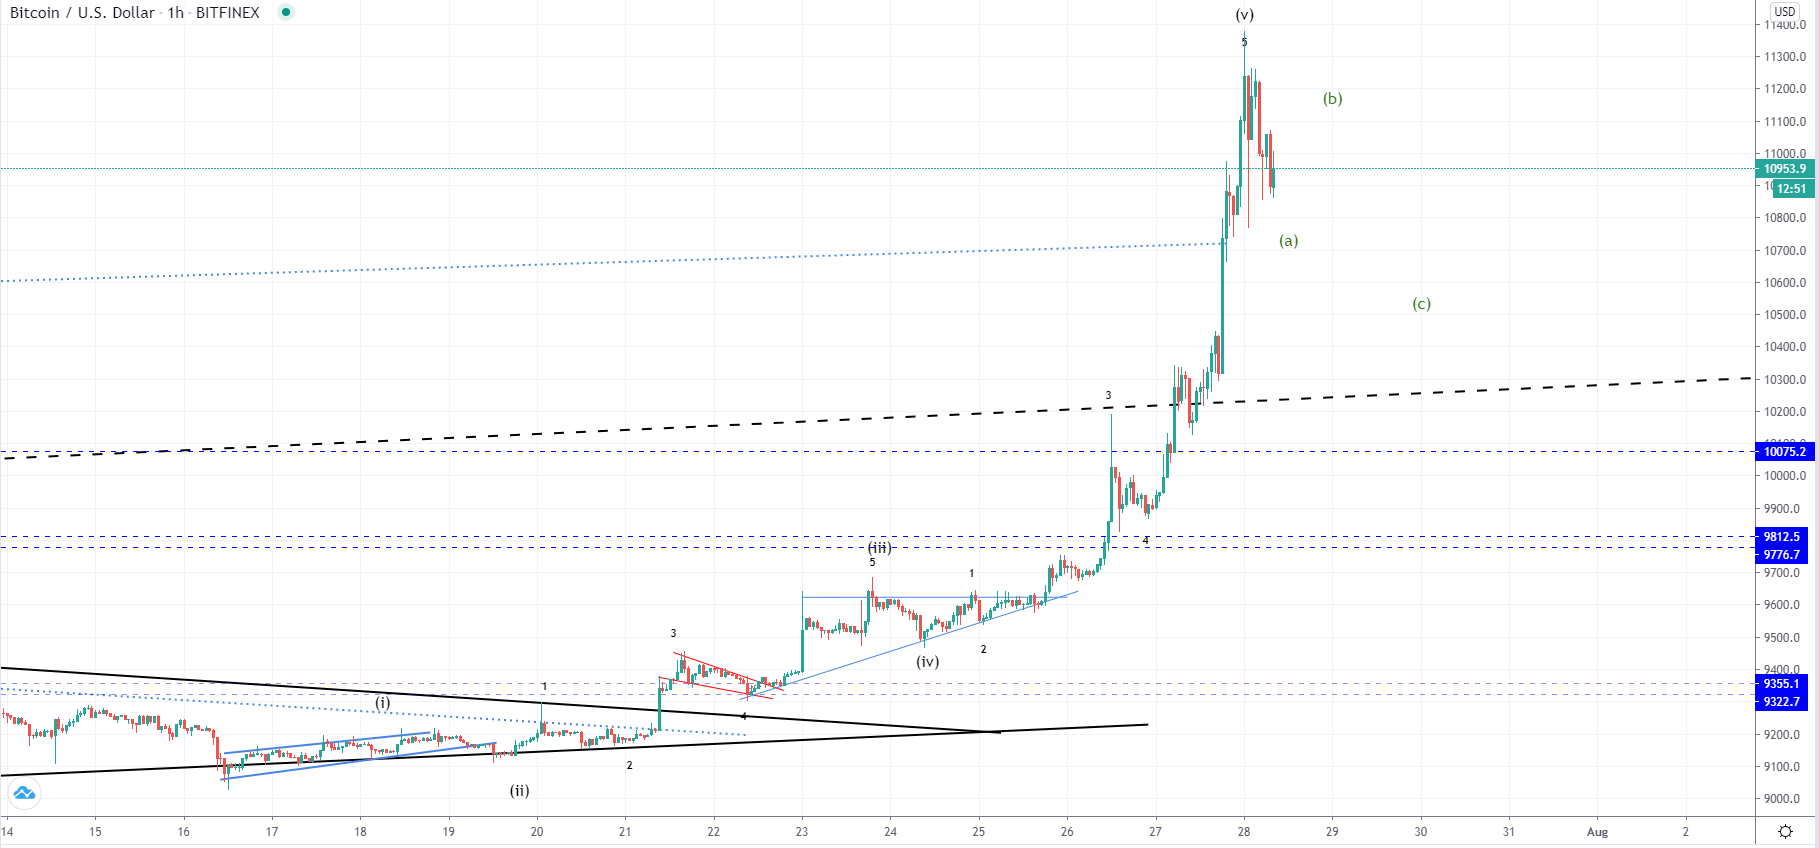
Looking at the hourly chart, you can see that a strong parabolic move was made to the upside breaking out from every significant resistance point along the way out of which the most significant one is the further at around $10500 level where the last ascending trendline is. As these breakouts occurred without proper retracements that had to serve as a retest of the broken resistance for support and we have seen only local pullback the move to the upside is considered an unsustainable one and is likely going to be equally impulsive on the downturn going back below some of the presumed support levels.
The wave structure implies that we have seen the completion of the five-wave impulse of a higher degree count in which case we are now seeing the development of the first significant correction. If this was the 1st sub-wave of the next higher degree five-wave impulse to the upside then the correction could lead the price all the way back below $9800 mark but considering the bullish bias, it is more likely going to end around the $10500 area before another upturn starts.
XRP/USD
The price of Ripple has increased by 18% coming from last Monday’s low at $0.19455 to $0.22973 made today at its highest point. At the moment the price is being traded at around $0.22279 as from today’s spike we have seen a pullback of 3.85%.
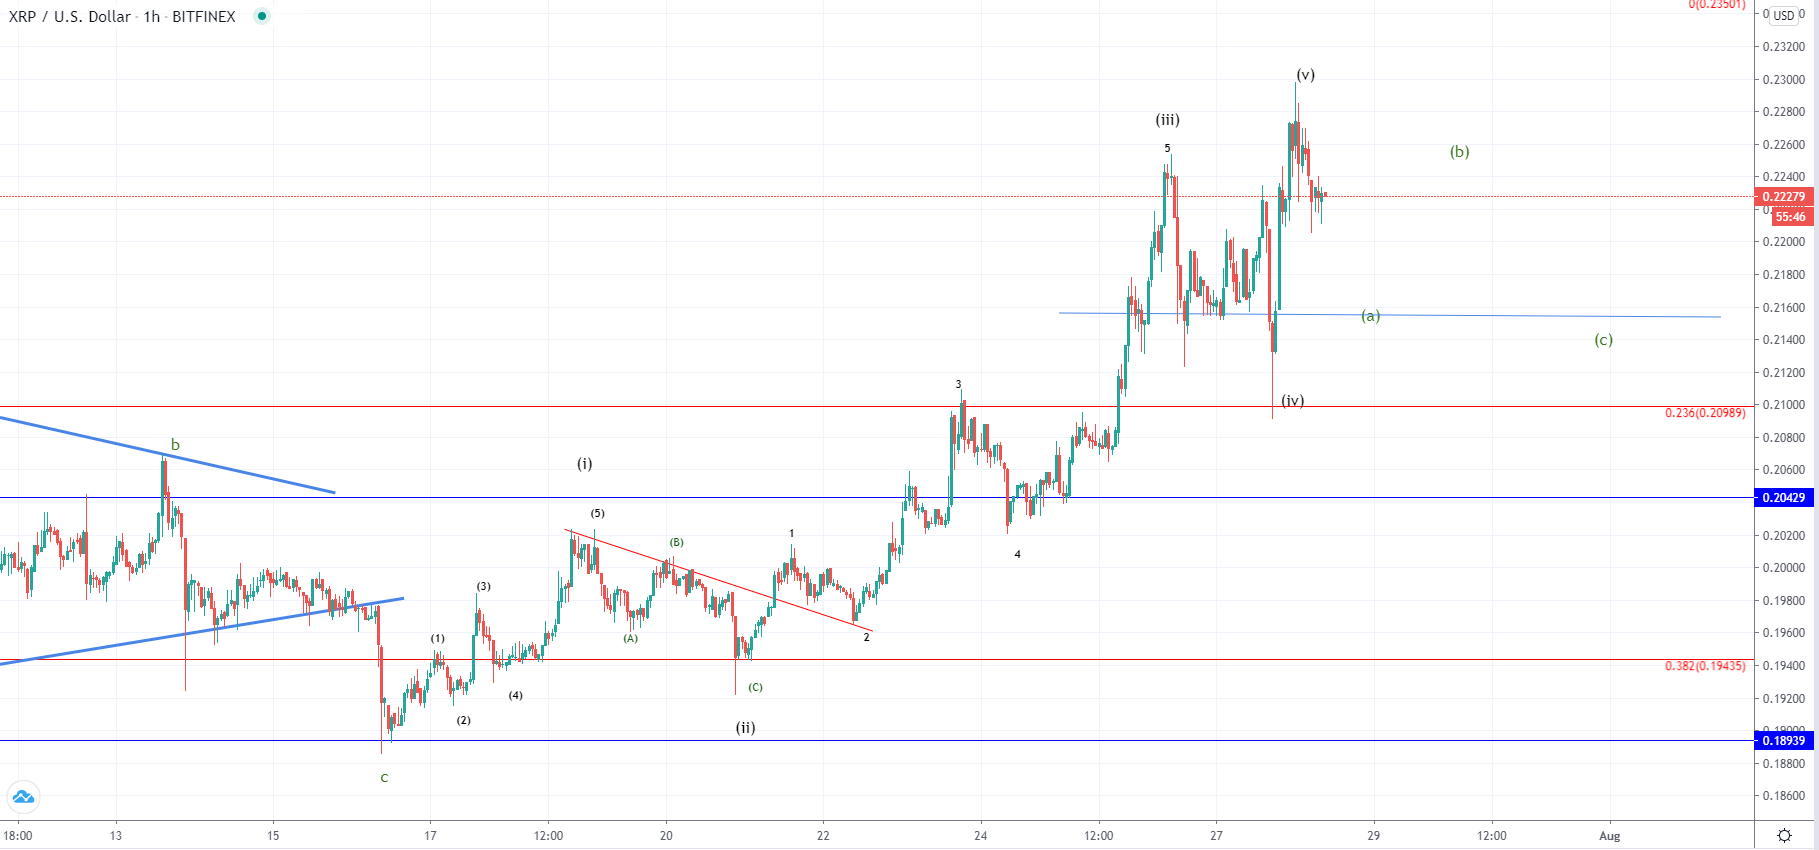
On the hourly chart, we can see that the price found support last Monday on the 0.382 Fibonacci level from which after a breakout from the local descending triangle an impulsive move to the upside was made. This was expected but the price hasn’t stopped out around $0.214 like previously projected and was considered as the zone of interest of a correction but instead continued increasing further above and came back to retest it from the upper side after a breakout.
As we are now seeing the price in a starting sideways movement further corrective structure is expected to develop but as the first significant correction of the same degree as the five-wave impulse that developed from the 16th of July.
FXOpen offers the world's most popular cryptocurrency CFDs*, including Bitcoin and Ethereum. Floating spreads, 1:2 leverage — at your service (additional fees may apply). Open your trading account now or learn more about crypto CFD trading with FXOpen.
*Important: At FXOpen UK, Cryptocurrency trading via CFDs is only available to our Professional clients. They are not available for trading by Retail clients. To find out more information about how this may affect you, please get in touch with our team.
This article represents the opinion of the Companies operating under the FXOpen brand only. It is not to be construed as an offer, solicitation, or recommendation with respect to products and services provided by the Companies operating under the FXOpen brand, nor is it to be considered financial advice.
Stay ahead of the market!
Subscribe now to our mailing list and receive the latest market news and insights delivered directly to your inbox.


Latest articles

Apple: Earnings Day Above the Activity Zone
On 30 April, after the market close, Apple Inc. will release its financial results for the second quarter of fiscal 2026. The consensus forecast, based on estimates from 31 analysts, points to revenue of around $109.7 billion, with expected

USD/JPY and USD/CHF Near Key Levels: The Dollar Supported by the Fed
The US dollar continues to trend upwards following the Federal Reserve meeting, drawing support from the regulator’s moderately hawkish stance and comments by Jerome Powell. Markets interpret the Fed’s rhetoric as a signal that restrictive policy is likely

EUR/USD and GBP/USD consolidate ahead of the Fed decision
European currencies are showing subdued dynamics, entering a consolidation phase following their previous advance. Earlier, EUR/USD and GBP/USD broke out of their ranges and strengthened; however, the subsequent correction has led both pairs to retest the previously breached