


BTC/USD and XRP/USD: a pullback before further increase is expected
FXOpen
BTC/USD
From last week’s analysis on Tuesday, February 12th, when the price of Bitcoin was $3659 at its lowest point, the price has increased by 10.15% from today’s highest point of $4029. The price is currently at $3976.5, lower than the horizontal resistance at $3994.4 where the price has encountered resistance.
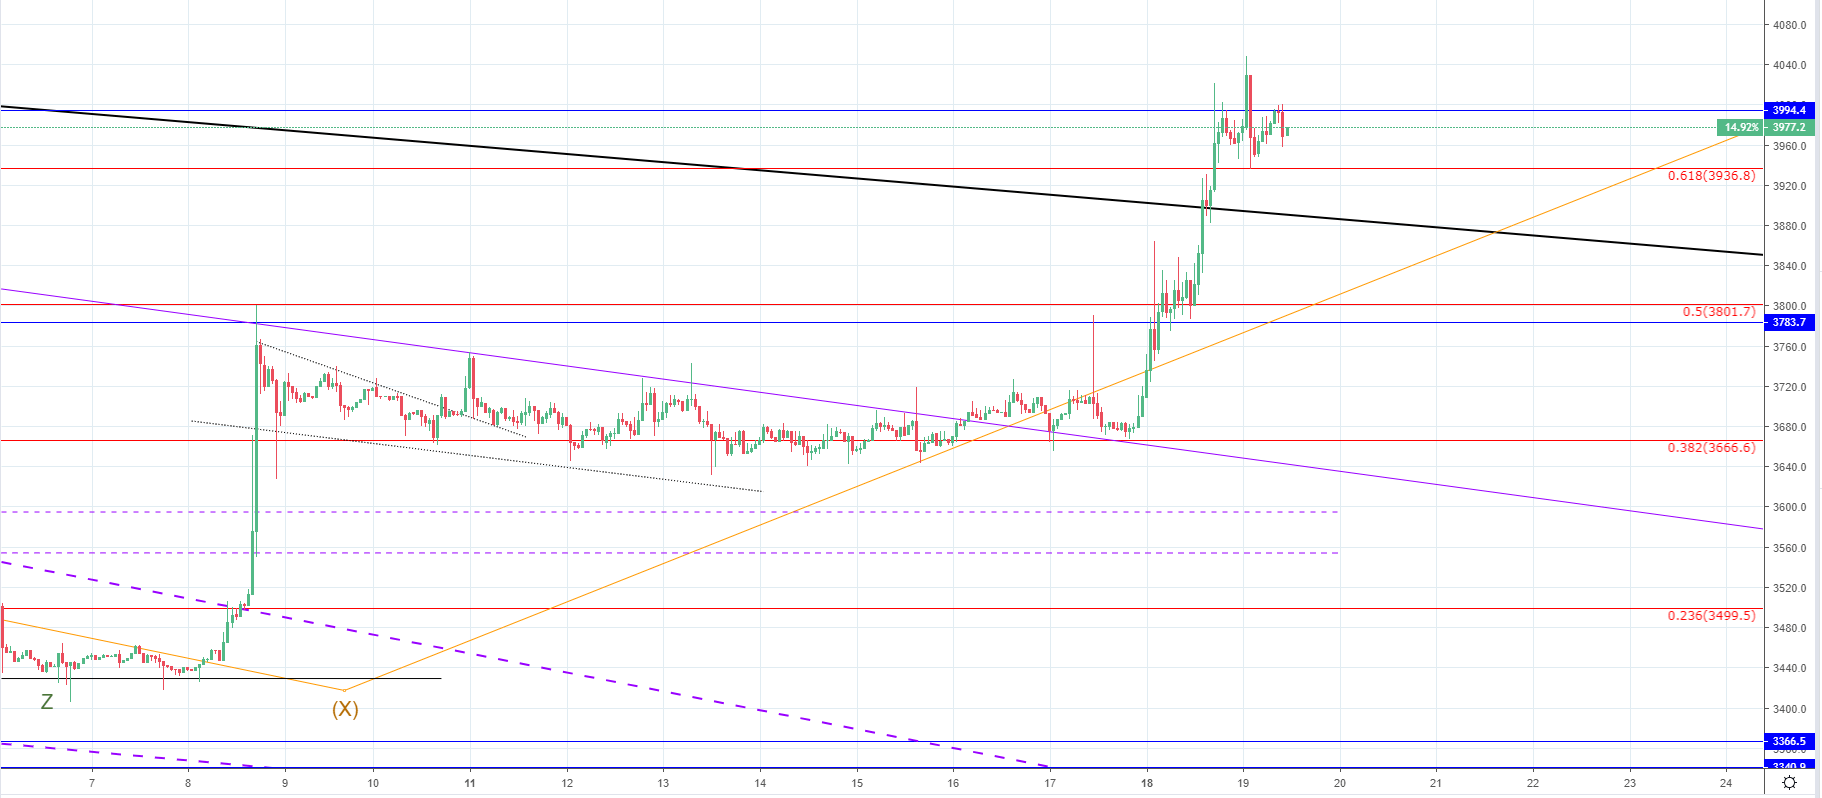
Looking at the hourly chart, you can see that the price broke out from the descending channel in which it was retracing since the first increase to the upside made on Friday 8th. The retracement was more of consolidation since we have seen it throughout the last 10 days. Strong momentum was shown as the price broke out many of the significant resistance points to the upside. The most significant one is the bold black line, which is the baseline support since the start of the bear market and was serving as resistance when it got broken on 21st of November last year.
The price is currently inside a horizontal range between the 0.618 Fibonacci level, which serves as a support, and the horizontal resistance at $3994.4. So we are seeing a cluster starting to form as the price is consolidating again after an exponential increase. If the price wants to continue the upward trajectory it needs to retest some of the broken resistance levels for support. And since the bold black line was the most significant resistance point we could likely see a pullback to its level potentially in a form of a descending triangle or a channel like we saw after the first impulsive increase.
Since my primary count got validated, where the Minor WXYXZ correction was the Intermediate X wave, this increase from the Friday 8th is considered the Intermediate Y wave. If this is true then a five-wave structure is to develop out of which we are currently seeing the 3rd wave. This current increase which is considered the 3rd wave may not have ended so we are soon going to see a confirmation in a form of a direction of a breakout from the current range.
XRP/USD
From last Tuesday when the price of Ripple was $0.30344 at its lowest point to today’s high at $0.3548 we have seen an increase of 16.78%. From today’s spike, the price has fallen quickly leaving a wick from the upside on the hourly chart and is currently sitting at $0.34592.
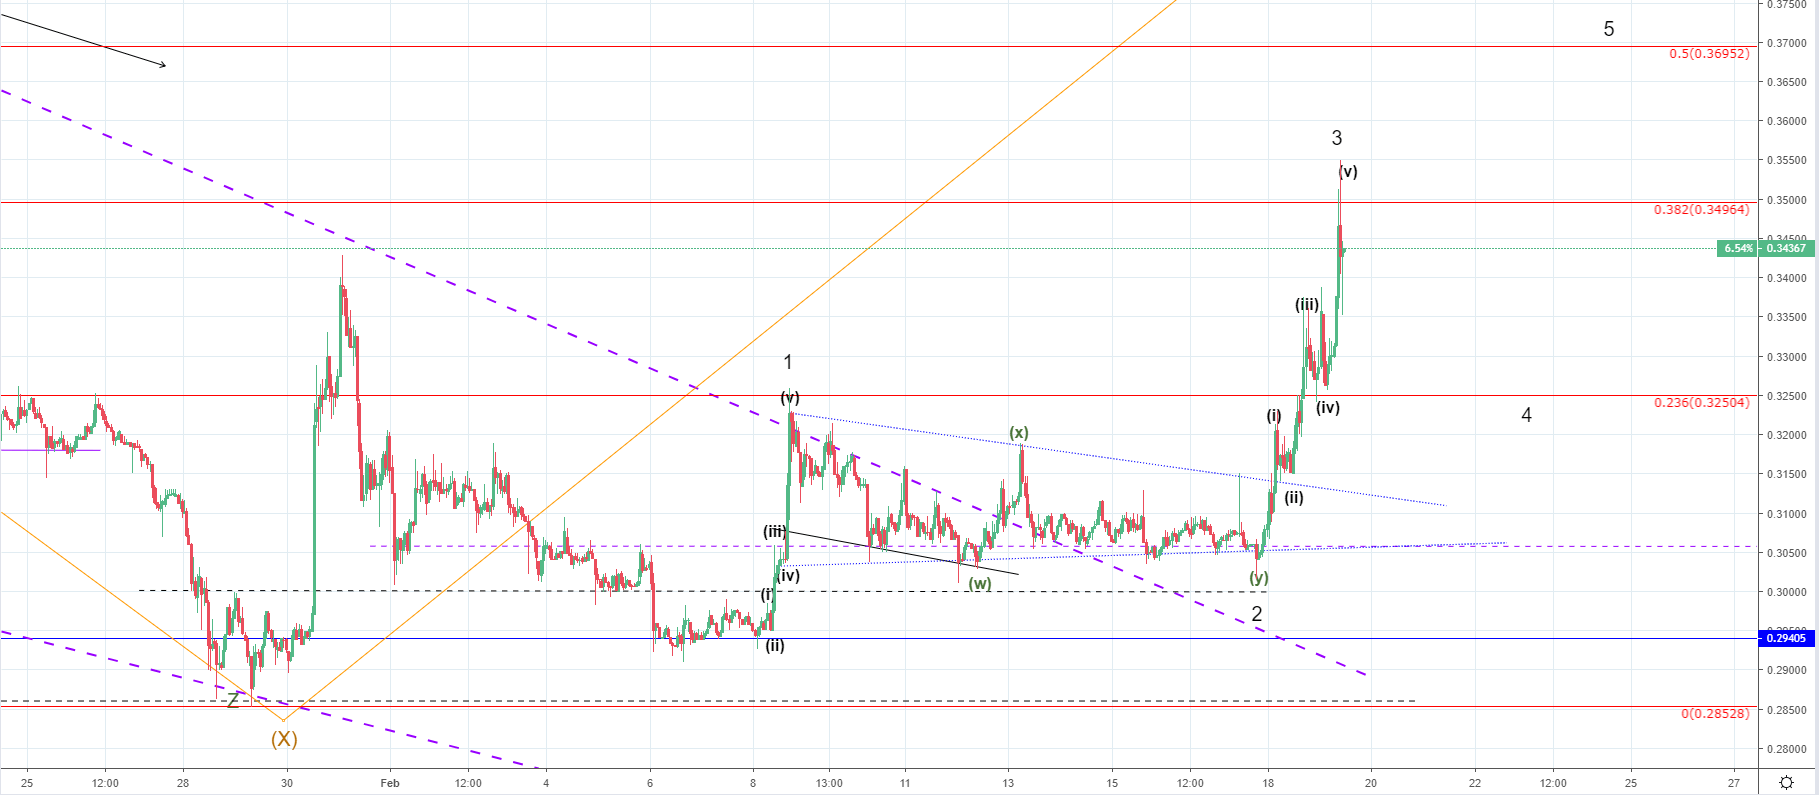
Looking at the hourly chart, you can see that my Elliott Wave count implies that this was the end of the 3rd wave, so now we are likely going to see some correctional movement much like what is expected in the case of Bitcoin. Some significant resistance points have been broken, out of which the most significant one is the horizontal resistance at the 0.236 Fibonacci level. The ending point of the 1st wave which could be interacted with on the 4th that is expected to develop.
This means that further increase could be expected afterward as the final 5th wave should start developing to the upside and the potential target would be at the next Fibonacci level at $0.36952.
FXOpen offers the world's most popular cryptocurrency CFDs*, including Bitcoin and Ethereum. Floating spreads, 1:2 leverage — at your service (additional fees may apply). Open your trading account now or learn more about crypto CFD trading with FXOpen.
*Important: At FXOpen UK, Cryptocurrency trading via CFDs is only available to our Professional clients. They are not available for trading by Retail clients. To find out more information about how this may affect you, please get in touch with our team.
This article represents the opinion of the Companies operating under the FXOpen brand only. It is not to be construed as an offer, solicitation, or recommendation with respect to products and services provided by the Companies operating under the FXOpen brand, nor is it to be considered financial advice.
Stay ahead of the market!
Subscribe now to our mailing list and receive the latest market news and insights delivered directly to your inbox.


Latest articles

EUR/USD and GBP/USD consolidate ahead of the Fed decision
European currencies are showing subdued dynamics, entering a consolidation phase following their previous advance. Earlier, EUR/USD and GBP/USD broke out of their ranges and strengthened; however, the subsequent correction has led both pairs to retest the previously breached

Meta: V-Shaped Recovery Meets Heavy Volume Resistance
The movement in Meta Platforms shares is being driven by two competing narratives. On one hand, advertising revenue is benefiting from AI-based tools: the Advantage+ platform continues to support strong advertiser demand, and the analyst consensus for Q1 2026 revenue

Commodity Currencies Test Key Levels Ahead of Major Macro Data
Commodity-linked currencies are trading near key levels, showing restrained price action as market participants adopt a wait-and-see approach. The fundamental backdrop is shaped by expectations surrounding the release of Australia’s inflation data and the Bank of Canada’s interest