


BTC/USD in an upward trajectory, XRP/USD increased by 5%
FXOpen
BTC/USD
From last Tuesday when the price of Bitcoin was $3903 at its lowest we have seen an increase of 5.68% as the price came up to around $4130 at its highest point on Saturday. Since the high, the price has been retracing back and came down to $4041 at its lowest point so far and is currently sitting at $4080.
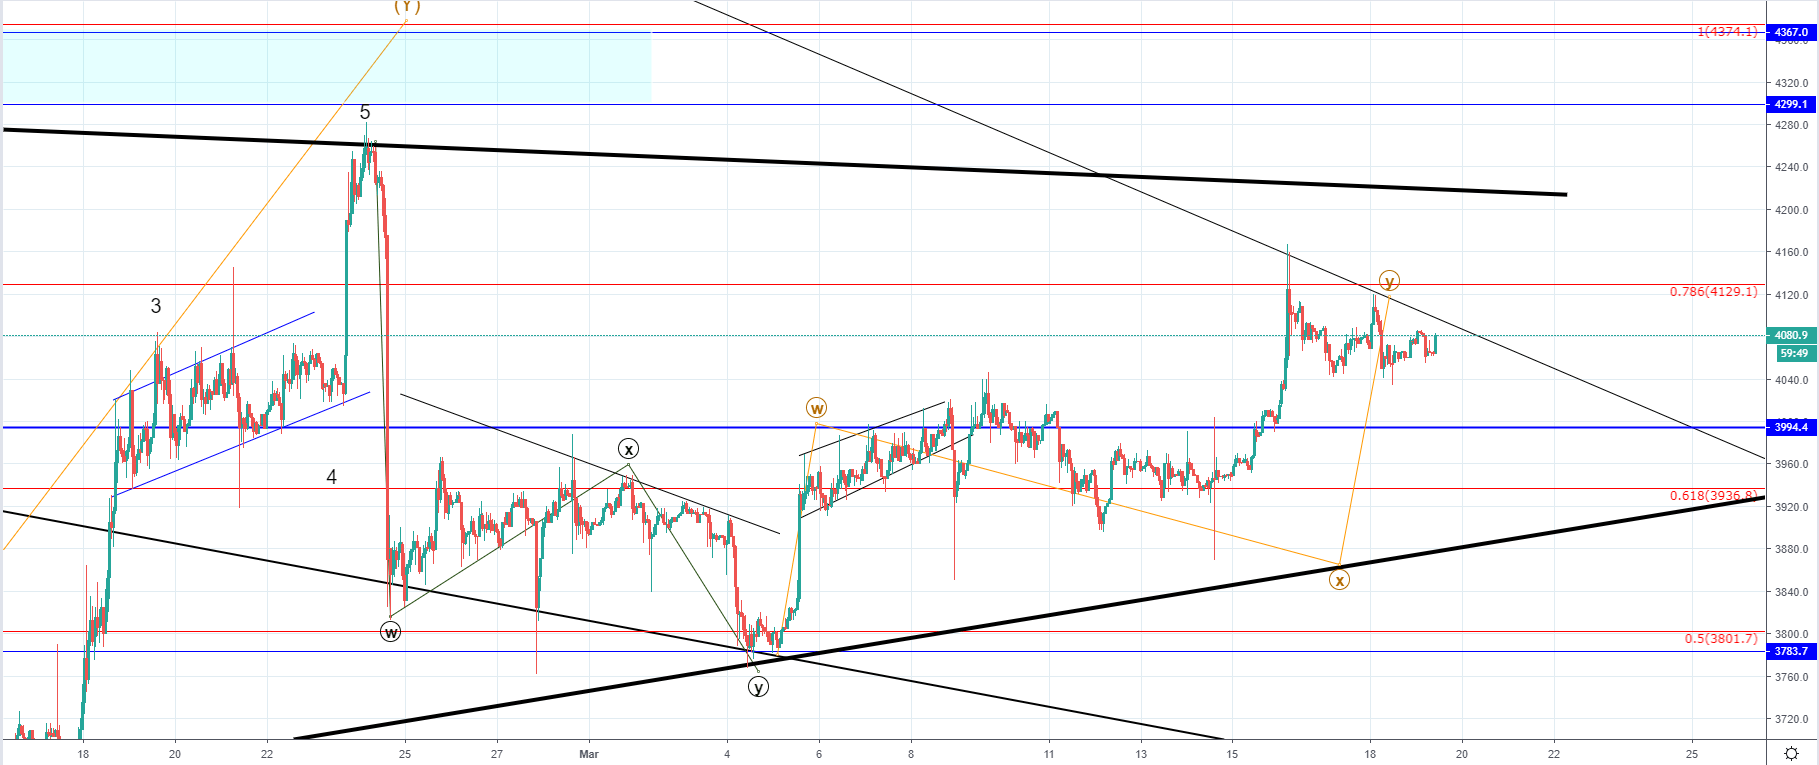
Looking at the hourly chart we can see that the price of Bitcoin came to its first significant resistance point around the intersection between the 0.786 Fibonacci level and the falling wedge resistance line as projected. This upswing was expected as the Y wave from the second Minute correction to the upside. The most upper resistance point is at around $4300 which is the horizontal support zone, now serving as resistance so another increase to those levels could be a possibility if the price is set to retest further resistance.
The price is currently in a slight upward trajectory as the last hourly candle is bullish but since the price action made lower highs and same lows are seeing the formation of a descending triangle which is considered to be a chart pattern usually seen on tops. This pattern indicates aggressiveness from the seller’s side as they are selling for a lesser price while buyers are sitting on the same level so if this continues the sellers would fill all the orders on those level that the buyers are which will result in a loss of support and a breakout to the downside would occur.
This is also indicated by the Elliott Wave count which implies that this upswing was corrective in nature and as it has most likely ended we are to see a move to the downside.
XRP/USD
On last Tuesday the price of Ripple was $0.31232 at its lowest point from where the price increased by around 4.92% as it came up to $0.32768 at its highest point on Saturday.
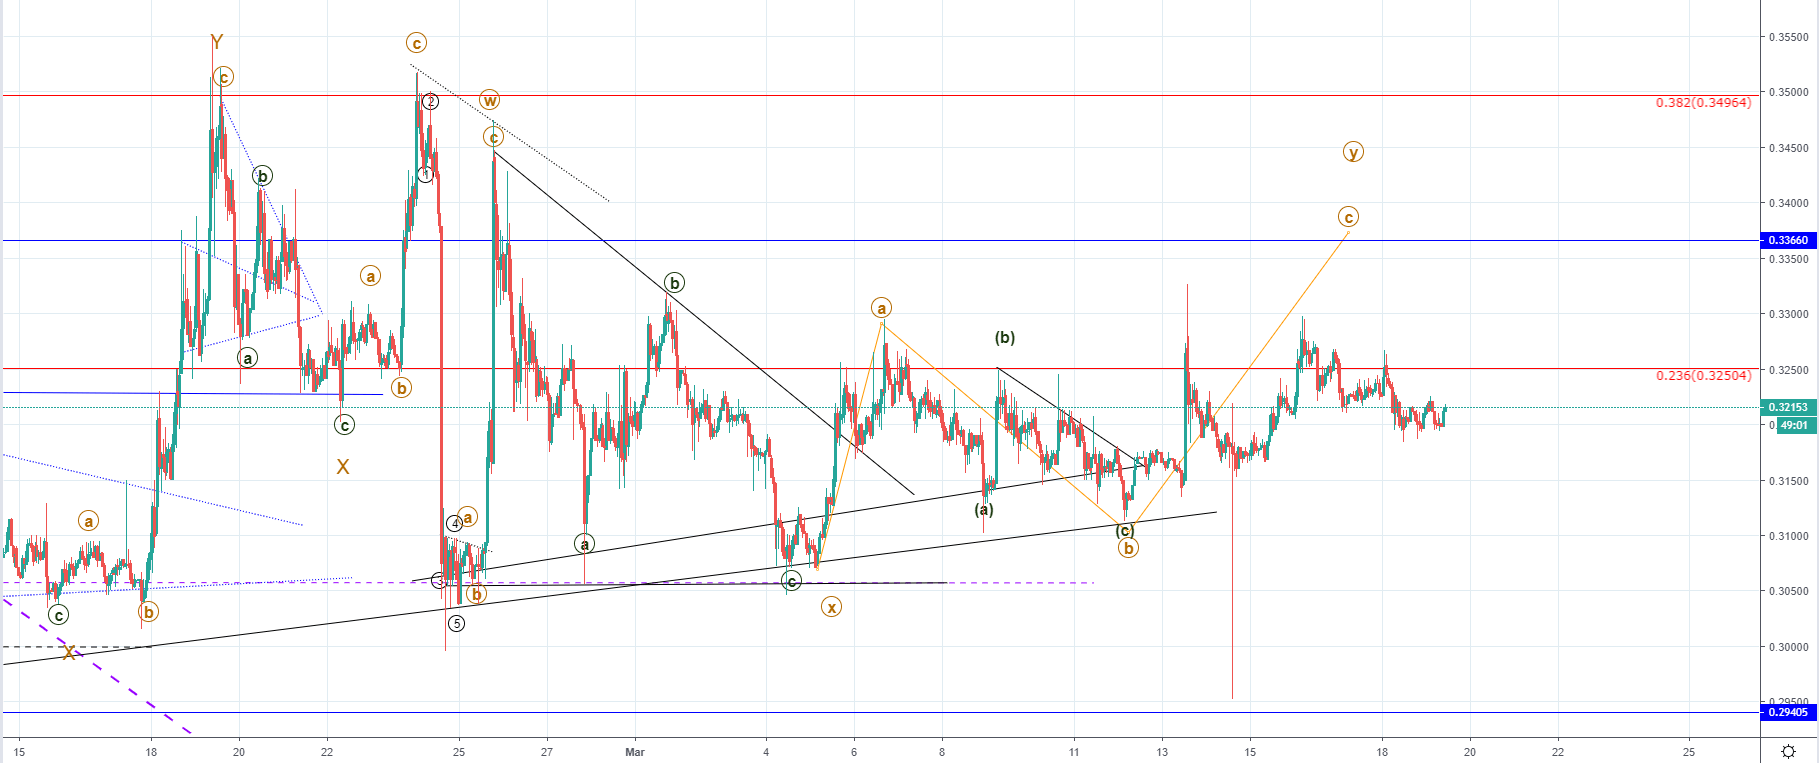
Looking at the hourly chart you can see that the price of Ripple came above the 0.226 Fibonacci level on Saturday but failed to stay above as it fell below it immediately after the price peaked above which indicates sellers territory. Like in the case of Bitcoin, this upswing was expected as the Minute WXY to the upside should develop fully and now that the price entered the upper range and clearly found resistance there we are yet to see if the momentum continues.
If the price continues its upward trajectory the next significant resistance point would be at the horizontal resistance at $0.3366 which is the median line between the Fibonacci levels but if the price starts decreasing again I would be expecting a breakout from the lower ascending trendlines which serves as support and potentially an interaction with its lower horizontal support level at $0.29405.
FXOpen offers the world's most popular cryptocurrency CFDs*, including Bitcoin and Ethereum. Floating spreads, 1:2 leverage — at your service (additional fees may apply). Open your trading account now or learn more about crypto CFD trading with FXOpen.
*Important: At FXOpen UK, Cryptocurrency trading via CFDs is only available to our Professional clients. They are not available for trading by Retail clients. To find out more information about how this may affect you, please get in touch with our team.
This article represents the opinion of the Companies operating under the FXOpen brand only. It is not to be construed as an offer, solicitation, or recommendation with respect to products and services provided by the Companies operating under the FXOpen brand, nor is it to be considered financial advice.
Stay ahead of the market!
Subscribe now to our mailing list and receive the latest market news and insights delivered directly to your inbox.


Latest articles

US Dollar Strengthens Amid Equity Market Weakness and Hawkish Fed Rhetoric
The US dollar continues to hold firm near multi-year highs as sentiment across equity markets deteriorates and investors increasingly expect the Federal Reserve to maintain a restrictive monetary policy stance for longer. The US economy remains resilient, while inflation risks

Bitcoin: Corrective Channel Broken as Traders Turn More Active
Bitcoin has come under the influence of several factors simultaneously. The wave of selling at the beginning of June was linked to Strategy's first disclosed Bitcoin sale in several years, a prolonged series of outflows from spot ETFs, and a

DAX 40: consolidation amid technology sell-off
A wave of selling in the technology sector that emerged earlier this week has weighed on European equities. The trigger was investor concern over the profitability of large-scale debt-funded investments by major US tech companies in AI infrastructure. The Nasdaq