


BTC/USD still under pressure while XRP/USD increased by over 18%
FXOpen
BTC/USD
Since last Tuesday the price of Bitcoin has increased by 2.41%, coming from $6327 to the current level at $6484.5.
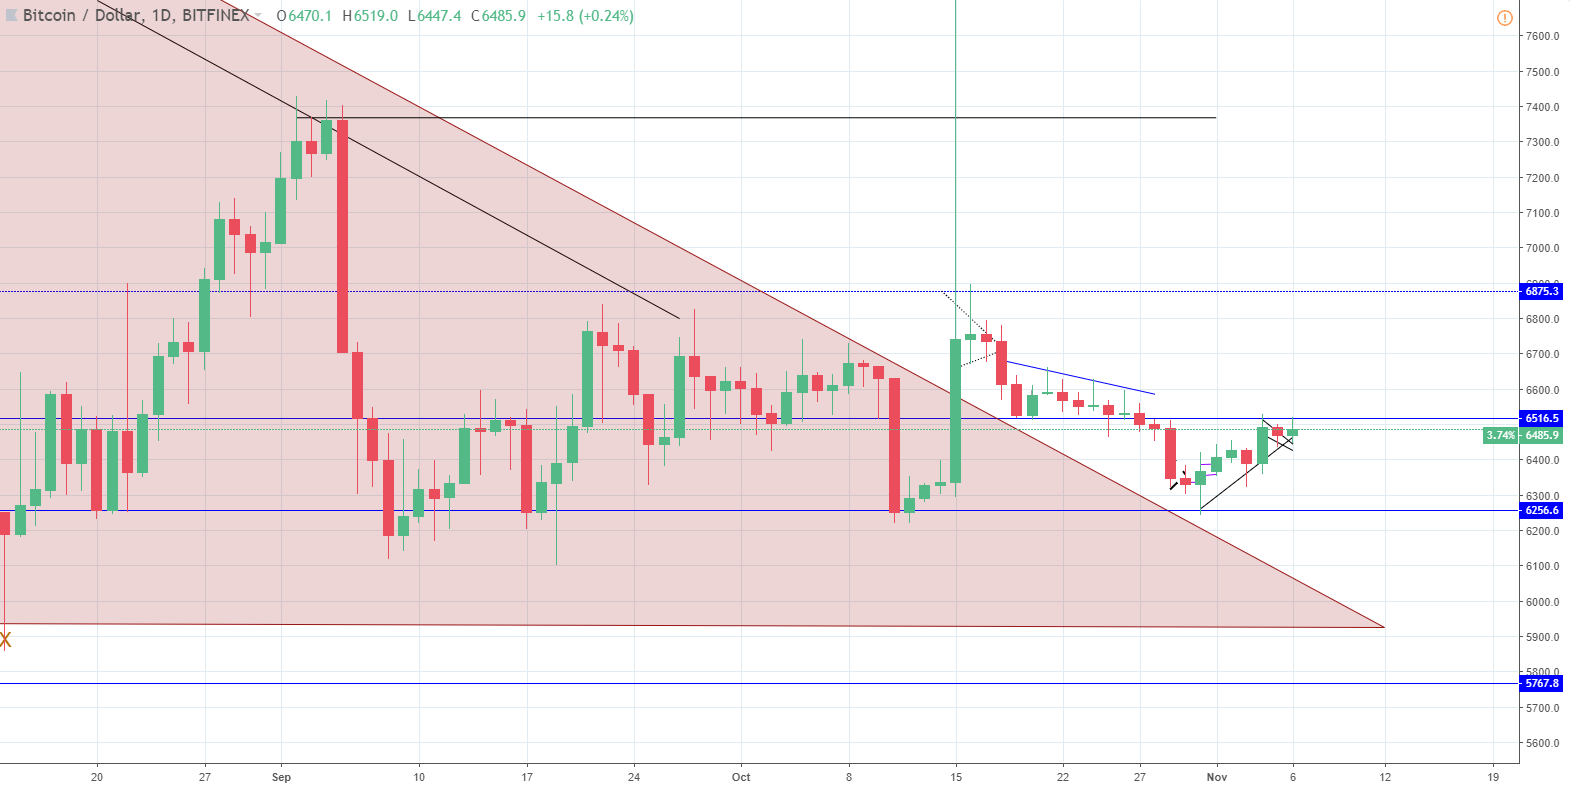
Looking at the daily chart we can see that the price of Bitcoin interacted with the horizontal support level at $ 6256 last Wednesday. That is why we have seen this increase over the course of the last week to the next horizontal level at $6516, which now serves as resistance. Yesterday’s candle was a red one indicating that the price might get rejected by the horizontal level, but as today’s candle is a green one with a wick interacting with the level, we are yet to see if the rejection gets validated or was it just a correction before a breakout.
After the increase to above $7600 ended as a spike, I was expecting the price to interact with the descending triangle's resistance line to retest it for support before a breakout could be considered. But as the price retraced by 100% and is now in an upward trajectory, I believe that the interaction will never happen unless the price falls straight down from here. As the price pulled back by 100% from the spike on Monday, October 15, it is still unclear whether this could be viewed as a “fakeout” or not because the price hasn’t quickly dropped inside the territory of the descending triangle. But it definitely shouldn’t be viewed as a breakout considering that the price retraced back to the same levels from which the increase was made.
Looking at the 4-hour chart you can see that the price has found support on the minor uptrend support line but is at the same time struggling to go past the $6516.5 horizontal support level.
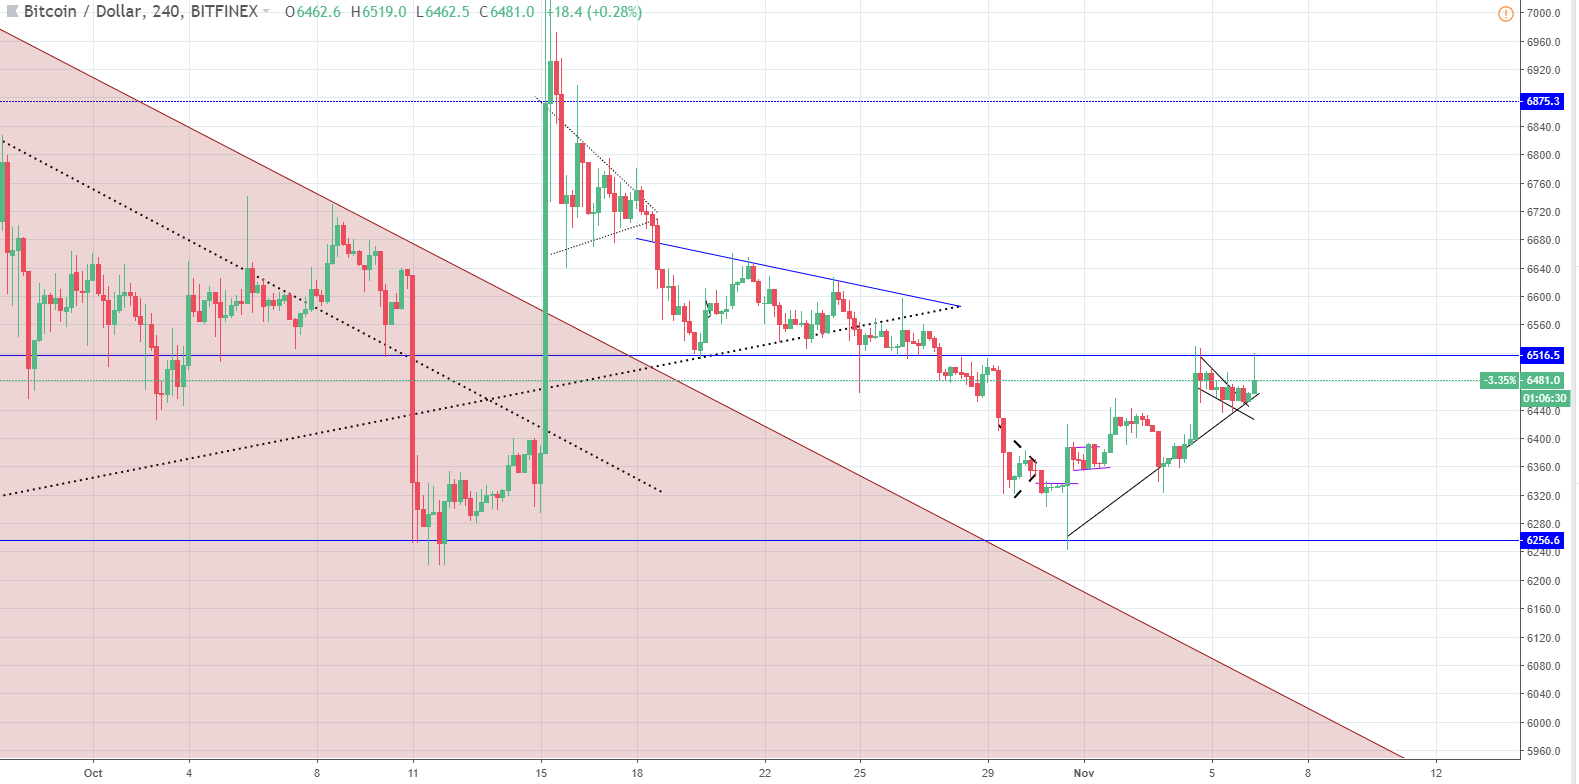
The long wick from above indicates selling pressure. That is why we might see another decrease in price for the short-term.
Zooming into the hourly chart you can see that the Elliott Wave count implies that the up move is done or almost done.
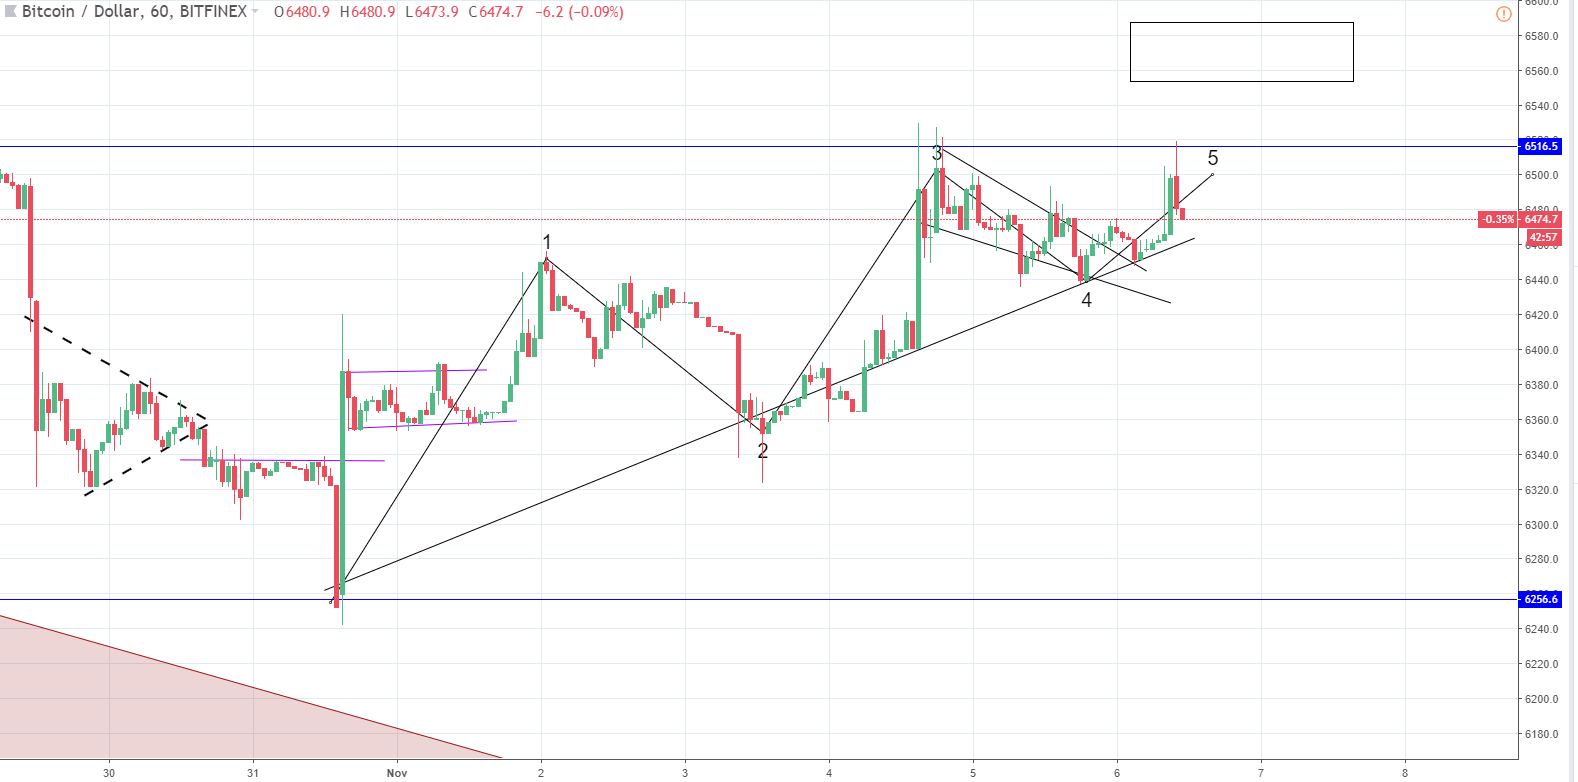
The 5 wave could get a bit higher to the market zone but in both cases, I would be looking at more downside for Bitcoin in the upcoming period as after an impulsive 12345 a correction occurs according to the Elliott Wave Principle.
XRP/USD
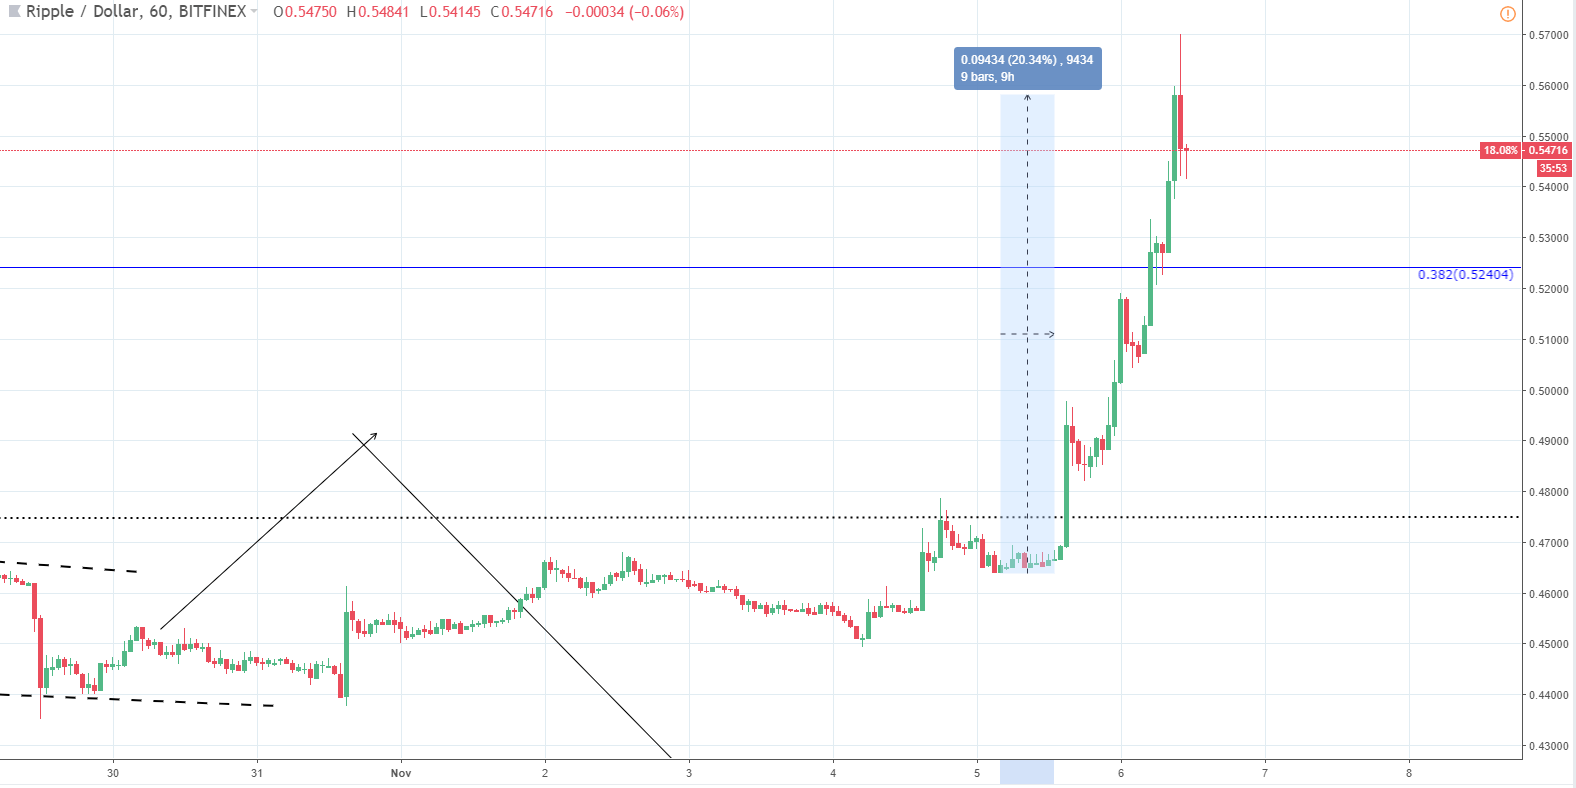
From yesterday’s low at $0.464 the price of Ripple has increased by over 18% measured to the current levels but has gone on further up, spiking to $0.57. But the hourly candle has closed at $0.558, marking a 20.34% increase.
If we zoom out to the daily chart we can see that the price of Ripple has been experiencing a recovery after a correction pushed the price to its lowest lows at $0.26
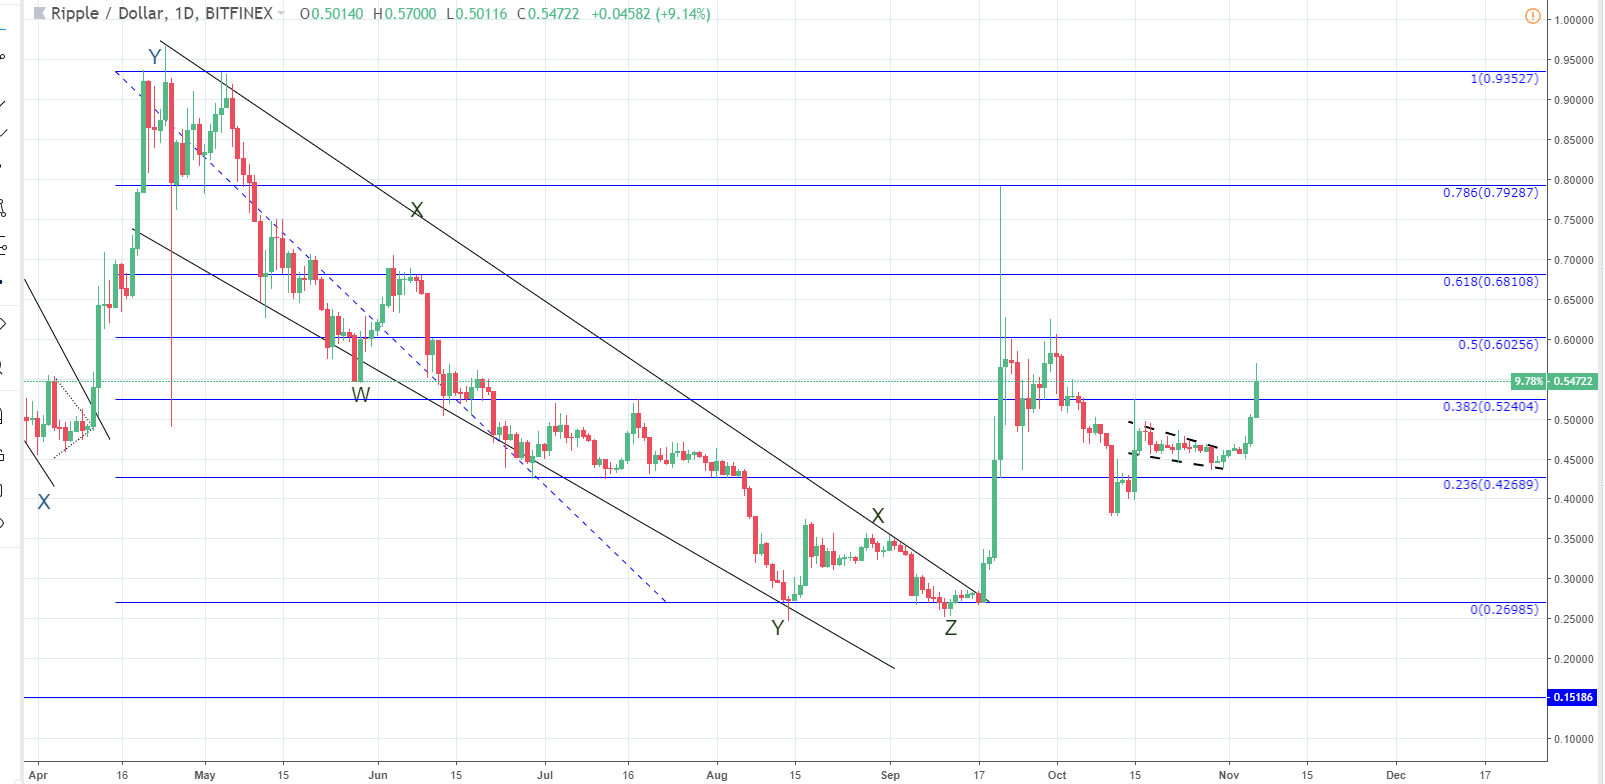
The recovery by 107% has so far been measured from the mentioned low, but we might see another increase that exceeds the prior high at $0.5818 as the price is currently in an upward trajectory.
Zooming into the 4-hour chart you can see my Elliott Wave projection in which the recovery is done, or almost done.
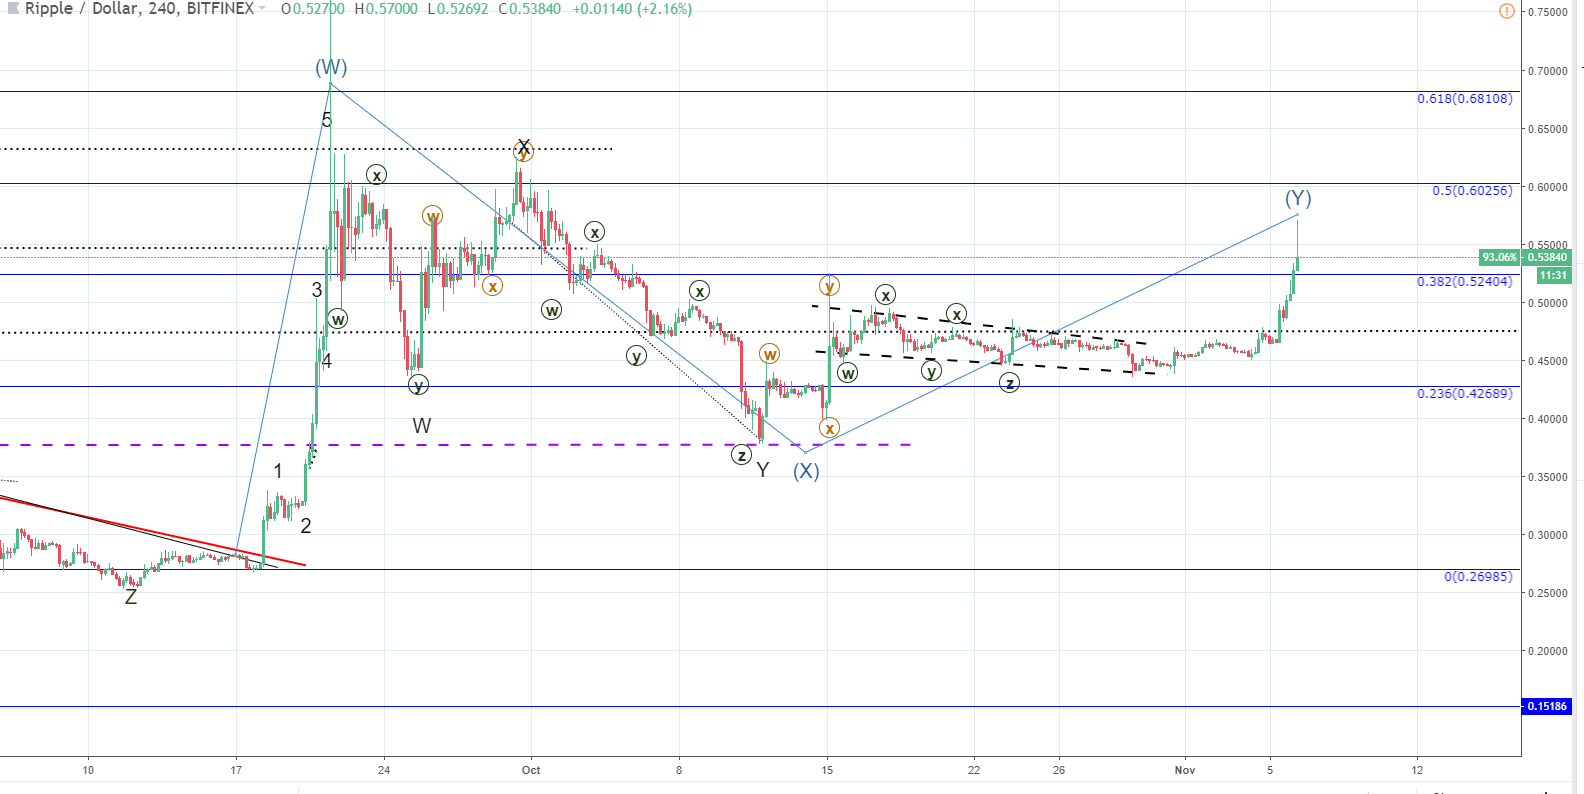
The final wave Y can go up to the 0.5 Fibonacci level again. But as indicated by the wick from above it is highly unlikely, and that is why in the upcoming period I would expect that the price of Ripple cools off and undergoes a correciton.
FXOpen offers the world's most popular cryptocurrency CFDs*, including Bitcoin and Ethereum. Floating spreads, 1:2 leverage — at your service (additional fees may apply). Open your trading account now or learn more about crypto CFD trading with FXOpen.
*Important: At FXOpen UK, Cryptocurrency trading via CFDs is only available to our Professional clients. They are not available for trading by Retail clients. To find out more information about how this may affect you, please get in touch with our team.
This article represents the opinion of the Companies operating under the FXOpen brand only. It is not to be construed as an offer, solicitation, or recommendation with respect to products and services provided by the Companies operating under the FXOpen brand, nor is it to be considered financial advice.
Stay ahead of the market!
Subscribe now to our mailing list and receive the latest market news and insights delivered directly to your inbox.


Latest articles

Apple: Earnings Day Above the Activity Zone
On 30 April, after the market close, Apple Inc. will release its financial results for the second quarter of fiscal 2026. The consensus forecast, based on estimates from 31 analysts, points to revenue of around $109.7 billion, with expected

USD/JPY and USD/CHF Near Key Levels: The Dollar Supported by the Fed
The US dollar continues to trend upwards following the Federal Reserve meeting, drawing support from the regulator’s moderately hawkish stance and comments by Jerome Powell. Markets interpret the Fed’s rhetoric as a signal that restrictive policy is likely

EUR/USD and GBP/USD consolidate ahead of the Fed decision
European currencies are showing subdued dynamics, entering a consolidation phase following their previous advance. Earlier, EUR/USD and GBP/USD broke out of their ranges and strengthened; however, the subsequent correction has led both pairs to retest the previously breached