


BTCUSD and XRPUSD Technical Analysis – 01st FEB 2022
FXOpen

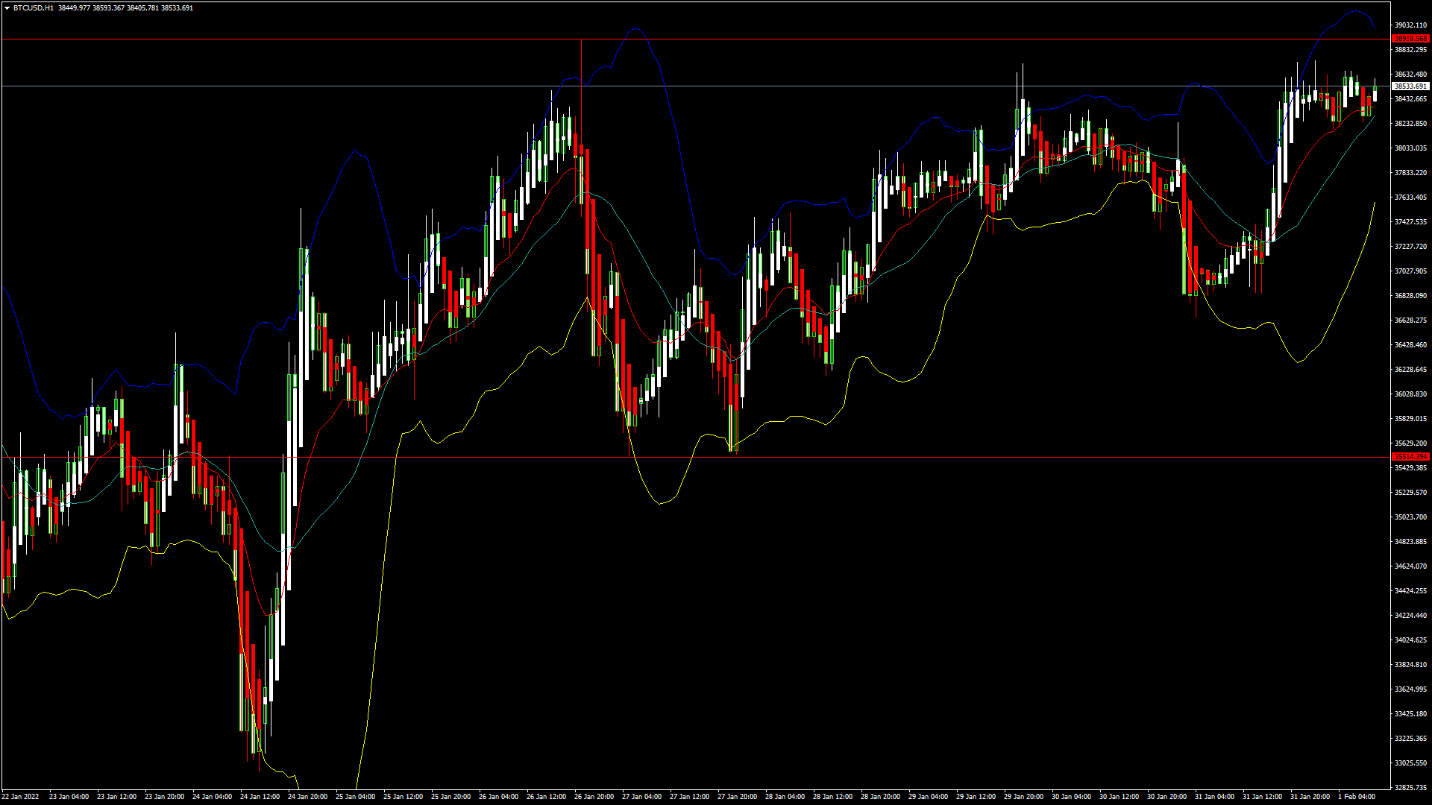
BTCUSD: Double Bottom Pattern Above $35,500
Bitcoin continues its bullish momentum this week having crossed the $38,000 handle in the Asian trading session today.
The prices of bitcoin are surging due to the increase in trading volumes and a renewed interest of global investors to buy bitcoin at lower levels.
BTCUSD touched an intraday high of $38,741 in the early Asian trading session, and an intraday low of $38,185.
We can clearly see a double bottom pattern above the $35,500 handle which is a bullish reversal pattern because it signifies the end of a downtrend and a shift towards an uptrend.
Stoch and Williams Percent Range are indicating an OVERBOUGHT level which means that in the immediate short-term, a decline in the prices is expected.
The relative strength index is at 61 indicating a STRONG demand for bitcoin at the current market levels.
Bitcoin is now moving above its 100 hourly simple moving average and below its 200 hourly exponential moving average.
The average true range is indicating a lesser market volatility with a bullish zone formation.
- Bitcoin bullish momentum continues above $35,500
- StochRSI is indicating a NEUTRAL level
- The price is now trading just above its pivot level of $38,420
- All of the moving averages are giving a STRONG BUY market signal
Bitcoin: Bullish Momentum Above $35,500 Confirmed
Bitcoin continues to gain traction in the European trading session today and is trading above the $38,000 handle.
The immediate short-term outlook for bitcoin is bullish, the medium-term outlook is neutral, and the long-term outlook remains strongly bullish.
The daily RSI is printing at 40 which means that long-term investors are still not coming into the markets.
All of the major technical indicators are giving a STRONG BUY signal, which means that in the immediate short-term, we should be expecting targets of $40k and $42k.
The price of BTCUSD is now facing its classic resistance level of $38,529 and Fibonacci resistance level of $38,588, after which the path towards $40k will get cleared.
In the last 24hrs, BTCUSD has gone UP by 3.75% with a price change of $1,392, and has a 24hr trading volume of USD 20.355 billion. We can see an increase of 23.68% in the trading volume as compared to yesterday.
The total market capitalization of bitcoin still remains below the $800 billion mark and is currently at 730.045 billion USD.
The Week Ahead
The prices of bitcoin are ranging in between the levels of $38,900 and $35,500, and are due for an upwards correction towards the $40,000 handle.
Many analysts believe that the recent decline happened due to the CME Futures gap.

Bitcoin’s bullish momentum is expected to continue pushing its levels past the $40,000 handle this week, and the prices of BTCUSD will need to remain above the important support level of $37,000.
Next week, we can expect more upsides in the range of $42,000 to $45,000.
Technical Indicators:
Commodity channel index (14-day): at 67.48 indicating a BUY
Average directional change (14-day): at 43.04 indicating a BUY
Rate of price change: at 0.255 indicating a BUY
Moving averages convergence divergence (12,26): at 179.60 indicating a BUY
XRPUSD: Double Bottom Pattern Above 0.5800
Ripple continues to gain momentum against the US dollar, and is trading above the 0.6000 handle in the European trading session today.
Today, Ripple touched an Intraday high of 0.6288 in the European trading session, and an intraday low of 0.6087 in the Asian trading session.
We can clearly see a double bottom pattern above the 0.5800 level, which is a bullish reversal pattern because it signifies the end of a downtrend and a shift towards an uptrend.
The short-term outlook for Ripple remains mildly bullish, the medium-term outlook remains neutral, and the long-term outlook is strongly bullish.
The relative strength index is at 66 which signifies a STRONG demand for Ripple at the current market prices. All of the moving averages are giving a STRONG BUY signal at the current market levels of 0.6208.
The 50-day simple moving average is also indicating a BUY at the levels above 0.6054.
Ripple is trading just below its pivot level of 0.6217, facing its classic resistance level of 0.6263, and Fibonacci resistance level of 0.6287 in the European trading session.
- All of the technical indicators are giving a STRONG BUY signal
- Ripple continues the bullish momentum above 0.5800
- Williams percent range is giving an OVERBOUGHT signal
- Average true range indicates LESS market volatility
Ripple: Continues Bullish Momentum Above 0.5800

Ripple is moving into a mildly bullish momentum above the 0.5800 handle in the European trading session today.
We can also see a fresh upside wave which is pushing the prices of Ripple above 0.6000.
The prices of Ripple are due for an upwards correction towards the 0.6500 handle this week. We can see an increase in the buying pressure for Ripple and the formation of a bullish zone against the US dollar.
The price of XRPUSD has gone UP by 5.45% with a price change of $0.03196 in the past 24hrs, and has a trading volume of 1.212 billion USD.
We can see a 14.47% increase in the trading volume of Ripple in the last 24 hours which appears to be normal.
This Week Ahead
The prices of XRPUSD are now moving in a narrow range between 0.6288 and 0.6087 which if broken would steer towards 0.7000.
This week, the price of Ripple needs to remain above the crucial support level of $0.5800 after which we could see a progression of the bullish momentum.
The upside correction in Ripple is long overdue, and can happen in the form of a rally into the markets pushing its prices above 0.7500.
The weekly outlook for Ripple is projected at 0.6800 with a consolidation zone of 0.7200
Technical Indicators:
Moving averages convergence divergence (12,26): at 0.005 indicating a BUY
Commodity channel index (14-day): at 127.70 indicating a BUY
Average directional change (14-day): at 61.66 indicating a BUY
Rate of price change: 3.004 indicating a BUY
Note: This analysis is intended to provide general information and does not constitute the provision of INVESTMENT ADVICE. Investors should, before acting on this information, consider the appropriateness of this information having regard to their personal objectives, financial situation or needs. We assume no liability for any loss arising from any investment made based on the information provided in this communication.
FXOpen offers the world's most popular cryptocurrency CFDs*, including Bitcoin and Ethereum. Floating spreads, 1:2 leverage — at your service (additional fees may apply). Open your trading account now or learn more about crypto CFD trading with FXOpen.
*Important: At FXOpen UK, Cryptocurrency trading via CFDs is only available to our Professional clients. They are not available for trading by Retail clients. To find out more information about how this may affect you, please get in touch with our team.
This article represents the opinion of the Companies operating under the FXOpen brand only. It is not to be construed as an offer, solicitation, or recommendation with respect to products and services provided by the Companies operating under the FXOpen brand, nor is it to be considered financial advice.
Stay ahead of the market!
Subscribe now to our mailing list and receive the latest market news and insights delivered directly to your inbox.


Latest articles

US Dollar Strengthens Amid Equity Market Weakness and Hawkish Fed Rhetoric
The US dollar continues to hold firm near multi-year highs as sentiment across equity markets deteriorates and investors increasingly expect the Federal Reserve to maintain a restrictive monetary policy stance for longer. The US economy remains resilient, while inflation risks

Bitcoin: Corrective Channel Broken as Traders Turn More Active
Bitcoin has come under the influence of several factors simultaneously. The wave of selling at the beginning of June was linked to Strategy's first disclosed Bitcoin sale in several years, a prolonged series of outflows from spot ETFs, and a

DAX 40: consolidation amid technology sell-off
A wave of selling in the technology sector that emerged earlier this week has weighed on European equities. The trigger was investor concern over the profitability of large-scale debt-funded investments by major US tech companies in AI infrastructure. The Nasdaq