


BTCUSD and XRPUSD Technical Analysis – 12th APR 2022
FXOpen

BTCUSD: Double Bottom Pattern Above $39,000
Bitcoin was unable to continue its last week’s bullish momentum and started to decline after touching a high of $47,184 on April 5th.
Bitcoin broke the $40,000 support and touched a low of $36,210 in today’s Asian trading session.
The selloff continues across the crypto markets, and the global investor sentiments are low due to the continuation of the Russia-Ukraine war and its emerging impacts on the prices of energy and stock markets.
After falling below the $40,000 handle, bitcoin found support and has entered a mildly bullish channel in today’s European trading session.
We can clearly see a double bottom pattern above the $39,000 handle which is a bullish reversal pattern because it signifies the end of a downtrend and a shift towards an uptrend.
The Stoch and the Williams percent range are indicating an overbought level which means that in the immediate short term, a decline in the prices is expected.
The relative strength index is at 43 indicating a WEAK demand for bitcoin at the current market levels.
Bitcoin is now moving below its 100 hourly simple moving average and its 200 hourly exponential moving average.
Most of the major technical indicators are giving a BUY signal, which means that in the immediate short term, we are expecting targets of $41,000 and $43,000.
The average true range is indicating LESSER market volatility with a mild bullish momentum.
- Bullish reversal seen in bitcoin above $39,000
- The StochRSI is indicating an OVERSOLD level
- The price is now trading just above its pivot level of $40,236
- Some of the moving averages are giving a BUY market signal
Bitcoin: Bullish Reversal Seen Above $39,000

Bitcoin continues to move in a mildly bullish momentum with an upwards projection towards the level of $41,000 in the European trading session today.
In the immediate term, we are expecting a continuation of this bullish trend with the price of bitcoin ranging between the levels of $42,000 and $44,000 as it has entered into a consolidation phase now.
The drop in the level of BTCUSD that we saw last week was due to the profit-taking by the short-term investors.
The immediate short-term outlook for bitcoin is mildly bullish; the medium-term outlook is neutral; and the long-term outlook remains neutral under present market conditions.
The price of BTCUSD is now facing its classic resistance level of $40,336 and Fibonacci resistance level of $40,454, after which the path towards $41,000 will get cleared.
We can see that the daily RSI is below 50 printing at 38 which indicates that in the medium-term prices are expected to decline further.
In the last 24hrs, BTCUSD has gone down by 3.17% with a price change of -$1319, and has a 24hr trading volume of USD 36.665 billion. We can see an Increase of 60.52% in the trading volume as compared to yesterday, which is due to the selling by the long-term Investors.
The Week Ahead
The price of bitcoin is now moving in a consolidation phase above the level of $40,000. We can see some range-bounded movements between $41,000 and $43,000.
If the prices of bitcoin continue to remain above the important psychological support level of $40,000, next week, we may see some correction in the midrange upwards towards the $42,000 handle.
In the immediate short term, bitcoin’s mildly bullish momentum is expected to continue pushing to above the $41,000 handle this week.
The price of BTCUSD will need to remain above the important support level of $40,000 this week.
The weekly outlook is projected at $42,000 with a consolidation zone of $41,500.
BTC Market Cap
Due to the weak global investor sentiments coupled with the ongoing Russia-Ukraine war and the rising inflation, the BTC market cap has fallen down below $800 billion.
The present total market capitalization of bitcoin stands at $764 billion.

Technical Indicators:
The average directional change (14-day): at 44.90 indicating a BUY
The ultimate oscillator: at 62.26 indicating a BUY
Bull/Bear power (13-day): at 227.32 indicating a BUY
The rate of price change: at 0.88 indicating a BUY
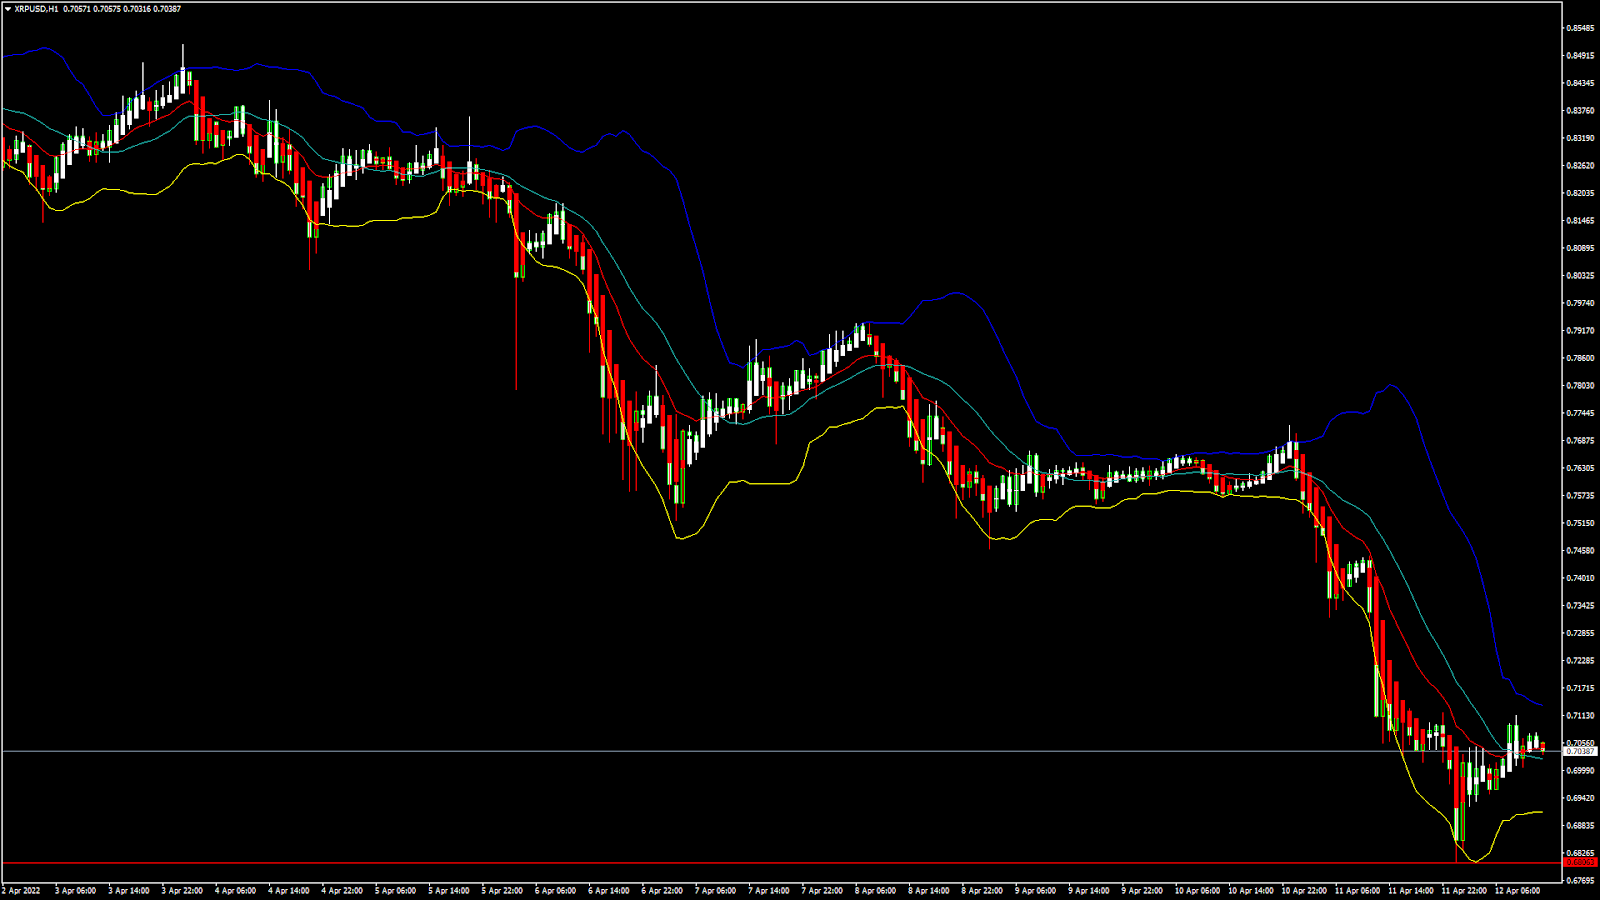
XRPUSD: Double Bottom Pattern Above 0.6800
Ripple was unable to sustain its bullish momentum, and after touching a high of 0.8362 on April 5th started to decline, touching a low of 0.6837 in today’s Asian trading session.
After this recent decline, the prices have entered a consolidation phase above 0.6800, and a mildly bullish momentum is observed in the markets.
We can see the formation of a bullish harami pattern at 0.6900 which is a bullish reversal pattern.
We can clearly see a double bottom pattern above the 0.6800 handle which signifies the end of a downtrend and a shift towards an Uptrend.
The short-term outlook for Ripple has turned mildly bullish; the medium-term outlook is neutral; and the long-term outlook is neutral.
The relative strength index is at 44 which signifies WEAK demand for Ripple at the current market prices and a move towards the consolidation phase.
Some of the moving averages are giving a BUY signal at the current market level of 0.7030.
Ripple is now trading just below its pivot level of 0.7058, facing its classic resistance level of 0.7075, and Fibonacci resistance level of 0.7094, after which the path towards 0.7200 will get cleared.
- Most of the major technical indicators are giving a BUY signal
- A bullish reversal is seen in Ripple above 0.6800
- The average directional change is indicating a NEUTRAL level
- The average true range indicates LESS market volatility
Ripple: Bullish Reversal Seen Above 0.6800
Ripple is now moving in a mildly bullish momentum above the level of 0.7000 in today’s European trading session.
We can see the formation of a bullish trend line which is expected to push the price towards the levels of 0.7200 and 0.7500.
XRP touched a high of 0.7112 in the European trading session, after which the price corrected but continued to remain above the $0.7000 handle.
The price of XRPUSD has gone down by 1.45% with a price change of $0.01034 in the past 24hrs, and has a trading volume of 2.190 billion USD.
We can see an increase of 31.32% in Ripple’s trading volume compared to yesterday, which is due to the increased selling seen across the global crypto markets.
This Week Ahead
The price of XRPUSD is now moving in a mildly bullish channel above the 0.7000 handle, and next visible targets are 0.7200 and 0.7500.
The price of Ripple is now testing its crucial support level of $0.7000 and moving towards the next resistance zone located at 0.7457.
The price of Ripple continues to be affected by the US SEC lawsuit; a positive outcome will further boost its levels in the coming week.
The weekly outlook for Ripple is projected at 0.7250 with a consolidation zone of 0.7100.
Technical Indicators:
The Williams percent range: at -27.65 indicating a BUY
The ultimate oscillator: at 53.53 indicating a BUY
The commodity channel index (14-day): at 57.82 indicating a BUY
Bull/Bear power (13-day): at 0.0007 indicating a BUY
FXOpen offers the world's most popular cryptocurrency CFDs*, including Bitcoin and Ethereum. Floating spreads, 1:2 leverage — at your service (additional fees may apply). Open your trading account now or learn more about crypto CFD trading with FXOpen.
*Important: At FXOpen UK, Cryptocurrency trading via CFDs is only available to our Professional clients. They are not available for trading by Retail clients. To find out more information about how this may affect you, please get in touch with our team.
This article represents the opinion of the Companies operating under the FXOpen brand only. It is not to be construed as an offer, solicitation, or recommendation with respect to products and services provided by the Companies operating under the FXOpen brand, nor is it to be considered financial advice.
Stay ahead of the market!
Subscribe now to our mailing list and receive the latest market news and insights delivered directly to your inbox.


Latest articles

AUD/USD: Will the RBA Be Able to Keep Its Currency Strong?
As the chart shows, AUD/USD has entered a distinctly bearish phase in recent weeks, reflecting the broader consolidation — and in some cases outright weakness — that the US dollar has begun imposing across most major currency pairs.
Fundamental Analysis
The
AUD/CAD: Pair Remains Range-Bound Amid Interest Rate Divergence
The key macroeconomic factor for AUD/CAD remains the divergence in monetary policy between the two central banks. After three consecutive rate hikes since the beginning of the year, the Reserve Bank of Australia left its cash rate unchanged at

Brent Crude Oil Analysis: Stabilisation or Simply a Pause?
Over the past few weeks, financial markets have been more focused than ever on developments surrounding the Strait of Hormuz — a critical waterway at the centre of ongoing US-Iran negotiations. The back-and-forth of diplomatic headlines has injected significant volatility into