


BTCUSD and XRPUSD Technical Analysis – 19th JULY 2022
FXOpen

BTCUSD: Triple Bottom Pattern Above $19640
Bitcoin was unable to sustain its bearish momentum and after touching a low of 18991 on 13th July started to correct upwards breaching the $22000 handle on 18th July.
We can see a continued appreciation in the price of bitcoin as global investor sentiments have improved leading to buying action seen in the markets at levels above $19000.
The price of bitcoin is poised to clear the resistance zone located at $23000 after which we will see a continuous upsurge in the levels of BTCUSD.
We can clearly see a triple-bottom pattern above the $19640 handle which is a bullish reversal pattern because it signifies the end of a downtrend and a shift towards an uptrend.
Bitcoin touched an intraday high of 22937 in the Asian trading session and an intraday low of 21588 in the European trading session today.
Both the STOCH and Williams percent range are indicating overbought levels which means that in the immediate short term, a decline in the prices is expected.
The relative strength index is at 50 indicating a neutral demand for bitcoin at the current market levels.
Bitcoin is now moving above its 100 hourly simple moving average and 200 hourly simple moving averages.
Some of the major technical indicators are giving a buy signal, which means that in the immediate short term, we are expecting targets of 22000 and 23000.
The average true range is indicating less market volatility with a bullish momentum.
- Bitcoin: bullish reversal seen above $19640
- The Williams percent range is indicating an overbought level
- The price is now trading just above its pivot level of $21805
- Most of the moving averages are giving a buy market signal
Bitcoin: Bullish Reversal Seen Above $19640

The price of Bitcoin continues to appreciate above the $21000 handle, and we are now testing the important resistance level of $23000 in the European trading session.
The global sentiments continue to improve leading to broad-based buying by the medium-term investors.
We can see the formation of a rising trend channel and are facing the immediate targets of $22000 and $22700.
Bitcoin’s bearish bias was invalidated above $19000, and we can see a correction wave that is stronger than the previous one.
We can see the formation of a bullish ABCD pattern in the hourly time frame which indicates that we are heading towards the $25000 level.
The immediate short-term outlook for bitcoin is bullish; the medium-term outlook has turned neutral; and the long-term outlook remains neutral under present market conditions.
Bitcoin’s support zone is located at $20500, and the prices continue to remain above this level for the continuation of the bullish phase of the markets.
The price of BTCUSD is now facing its classic resistance level of 21868 and Fibonacci resistance level of 21963 after which the path towards 22000 will get cleared.
In the last 24hrs, BTCUSD has declined by 1.73% by 385$ and has a 24hr trading volume of USD 45.154 billion. We can see an increase of 39.50% in the trading volume as compared to yesterday, which is due to the buying seen by the medium-term investors.
The Week Ahead
The price of bitcoin is moving in a bullish momentum, and the immediate targets are $22500 and $23500.
The daily RSI is printing at 53 which means that the medium range demand continues to remain neutral.
We can see the continuation of the recovery mode in bitcoin with the prices touching the $23000 and $24000 levels next week.
The price of BTCUSD will need to remain above the important support level of $20000 this week.
The weekly outlook is projected at $23500 with a consolidation zone of $22500.
Technical Indicators:
The average directional change (14 days): at 25.10 indicating a buy
The ultimate oscillator: at 59.03 indicating a buy
The rate of price change: at 8.61 indicating a buy
The commodity channel index(14days): at 136 indicating a buy
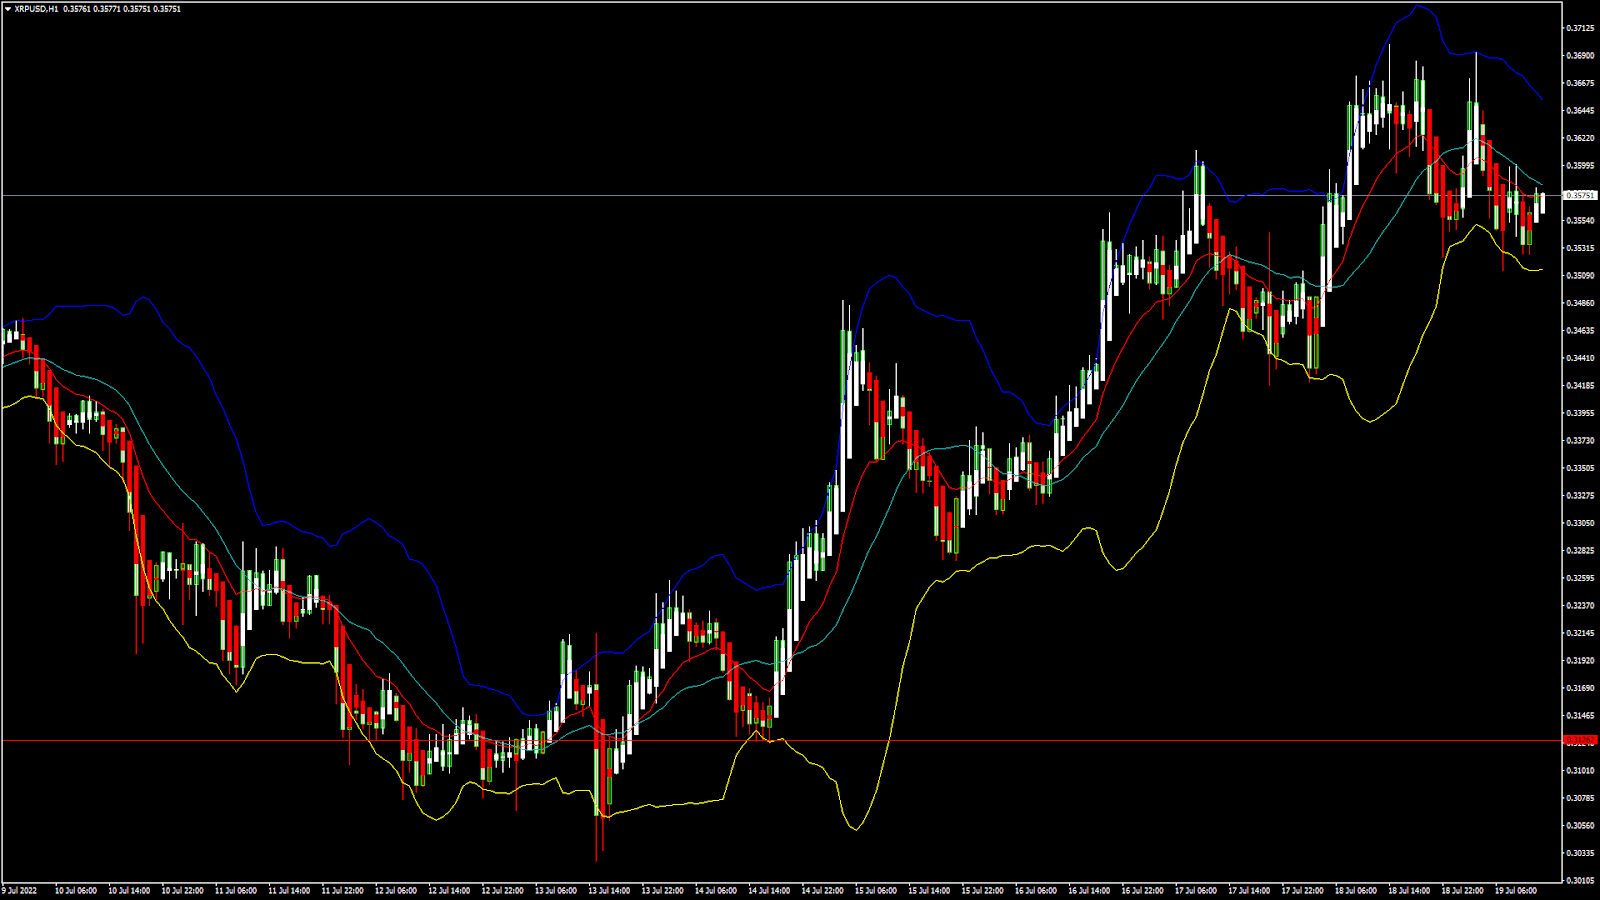
XRPUSD: Bullish Engulfing Pattern Above 0.3126
Ripple was unable to continue its bearish momentum last week and after touching a low of 0.3037 on 13th July started to correct upwards breaching the 0.3600 handle on 18th July.
We can see a continuous appreciation in the prices of Ripple due to increased buying demand from the medium-term investors.
Now we are testing the important resistance zone located at 0.3700 after which we will see Ripple touching the level of 0.4000.
We can clearly see a bullish engulfing pattern above the 0.3565 handle which is a bullish reversal pattern because it signifies the end of a downtrend and a shift towards an uptrend.
Ripple touched an intraday high of 0.3693 in the Asian trading session and an intraday low of 0.3513 in the European trading session today.
Both the average directional change and ultimate oscillator are indicating neutral levels which means that in the immediate short term, a consolidation in the prices is expected.
The relative strength index is at 50 which signifies a neutral demand for Ripple at the current market prices and the shift towards the consolidation channel this week.
Most of the moving averages are giving a strong buy signal at the current market levels of 0.3580.
Ripple is now trading above its pivot level of 0.3552 and facing its classic resistance level of 0.3577 and Fibonacci resistance level of 0.3591, after which the path towards 0.3700 will get cleared.
Most of the major technical indicators are giving a neutral signal.
- Ripple: bullish reversal seen above the 0.3126 level
- The commodity channel index is indicating a neutral level
- The average true range indicates lesser market volatility
- Ripple gains bullish bias against the US dollar
Ripple: Bullish Reversal Seen Above 0.3126
We can see that the price of Ripple continues increasing and has been moving above the 0.3500 handle in the European trading session today.
The price of Ripple is forming a bullish trendline above the 0.3000 level and a continued progression is seen towards the 0.3600 level.
The short-term outlook for Ripple has turned bullish; the medium-term outlook is neutral; and the long-term outlook is neutral under present market conditions.
We can see that the downside wave is exhausted at the level of 0.3000, and an upside correction wave has started which is expected to push the price of Ripple beyond the 0.4000 handle next week.
We have also detected the formation of MA5 and MA10 crossover patterns located at 0.3563 and 0.3574 indicating the bullish reversal of the markets.
The price of XRPUSD has decreased by 4.45% with a price change of $0.01432 in the past 24hrs and has a trading volume of 0.914 billion USD.
We can see a decrease of 23.89% in the trading volume of Ripple as compared to yesterday, which is due to the heavy selling by the medium-term Investors.
The Week Ahead
Ripple is expected to move into a consolidation zone above the 0.3500 handle and remain in the range-bounded movement this week below the 0.3700 level.
The price of XRPUSD is expected to enter into a bullish correction wave above the 0.3500 handle and a recovery is expected in the markets.
We can see the continuation of the bullish trendline from last week, and the prices continue to remain below the important support level of 0.3200
The weekly outlook for Ripple is projected at 0.3700 with a consolidation zone of 0.3600.
Technical Indicators:
The relative strength index (14): at 50 indicating a neutral.
The ultimate oscillator: at 49.51 indicating a neutral.
The rate of price change: at 0.545 indicating a buy
The average directional change (14 days): at 28.13 indicating a neutral
FXOpen offers the world's most popular cryptocurrency CFDs*, including Bitcoin and Ethereum. Floating spreads, 1:2 leverage — at your service (additional fees may apply). Open your trading account now or learn more about crypto CFD trading with FXOpen.
*Important: At FXOpen UK, Cryptocurrency trading via CFDs is only available to our Professional clients. They are not available for trading by Retail clients. To find out more information about how this may affect you, please get in touch with our team.
This article represents the opinion of the Companies operating under the FXOpen brand only. It is not to be construed as an offer, solicitation, or recommendation with respect to products and services provided by the Companies operating under the FXOpen brand, nor is it to be considered financial advice.
Stay ahead of the market!
Subscribe now to our mailing list and receive the latest market news and insights delivered directly to your inbox.


Latest articles

Weekly Market Insights with Gary Thomson: The Week of Central Banks and Earnings
In this video, we’ll explore the key economic events and market trends, shaping the financial landscape. Get ready for insights into financial markets to help you navigate the week ahead. Let’s dive in!
In this episode of Market

Intel at a Crossroads: Earnings Beat Meets Technical Resistance
Intel has just delivered its strongest quarter in over fifteen years, and the market reaction says it all. Q2 2026 revenue surged 25% year-over-year to $16.1 billion, crushing the consensus estimate of $14.42 billion, while adjusted EPS of

Tesla: Complex Range Structure Breaks Down Following Quarterly Earnings
Tesla released its Q2 2026 results after the market closed on 22 July. Revenue increased 26% year-on-year to $28.24 billion, while vehicle deliveries reached a record 480,126 units. However, operating margin fell sharply to 1.4%, down from