


Mastering the Harmonic Bat Pattern
FXOpen
The harmonic bat pattern is a powerful tool for traders seeking to pinpoint market reversals with precision. Using Fibonacci ratios to map out key price movements, this pattern offers traders the chance to enter high-probability trades. In this article, we’ll break down the bat pattern’s structure, how to identify and trade it, and common mistakes to avoid.

Basics
There are many approaches and tools that can be applied to trading. They can mainly be divided into technical and fundamental. When it comes to technical analysis there are indicators, candlestick and chart patterns, Elliott wave theory, Wyckoff method, and more.
With each talented analyst making chart observations, a new approach is born. This is also the case with Harmonics. They were first introduced in 1930 by H.M. Gartley in his book “Profits in the Stock Market” which is why the first pattern was named Gartley.
At first, Fibonacci ratios weren’t applied to pattern recognition but other market analysts later built upon this. Namely, it was Larry Pesavento who introduced Fib levels to define and distinguish Harmonic formations, and finally, Scott M. Carney defined all the variations according to those rules and ratios.
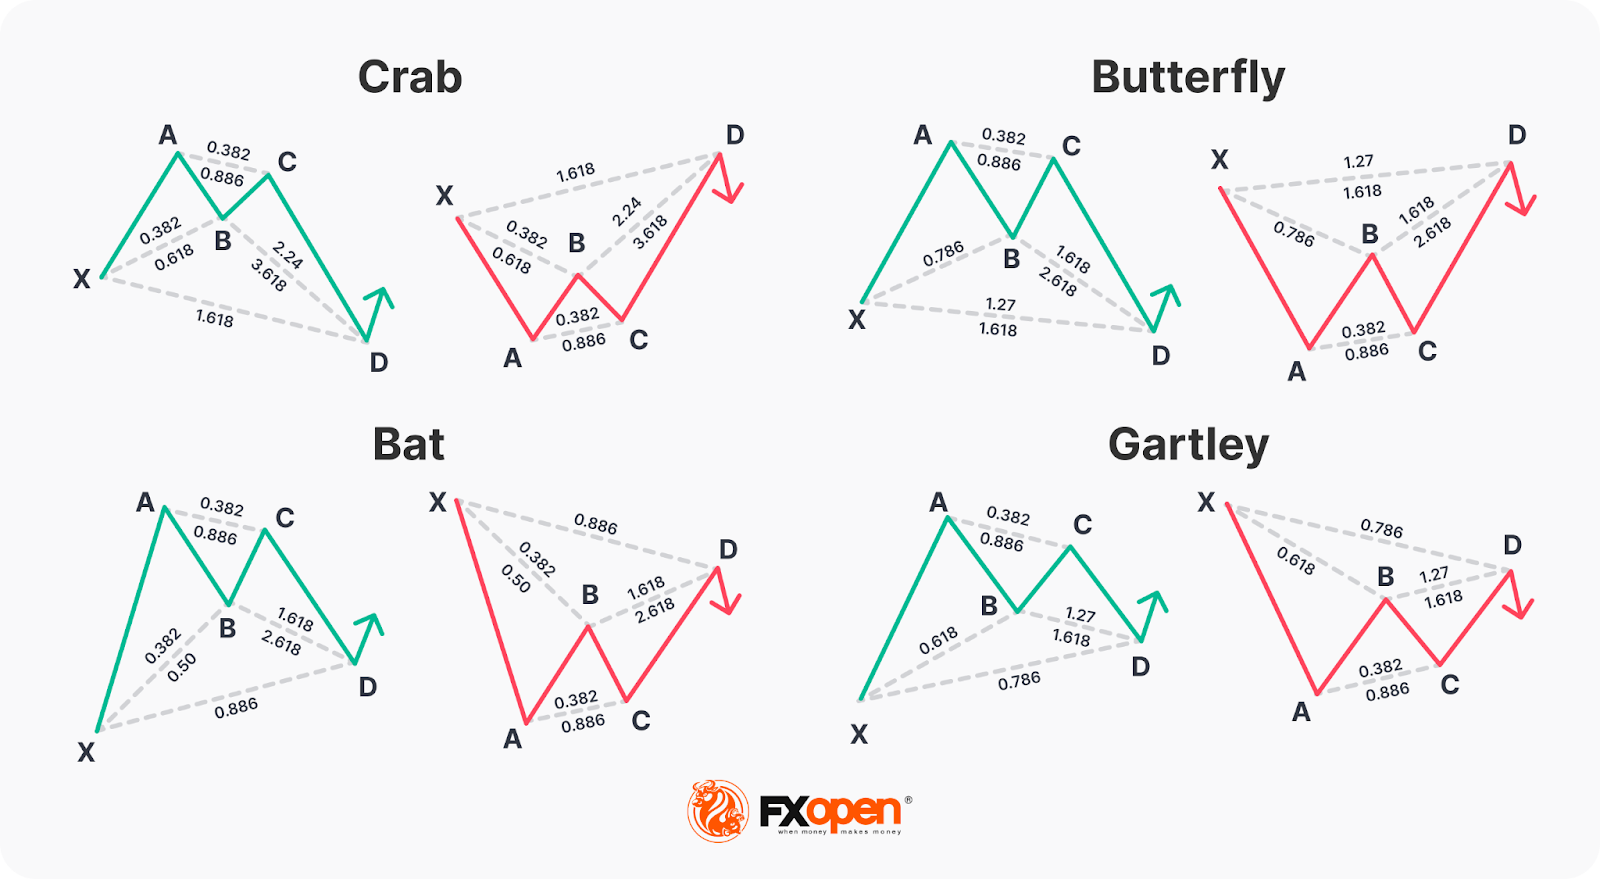
The best known Harmonic formations are Gartley, Crab, Butterfly, and Bat, distinguished by their shape and corresponding Fibonacci ratios.
What Is the Harmonic Bat Pattern?
The bat is a harmonic pattern used in trading to identify potential price reversals. It is one of several harmonic formations based on Fibonacci retracement levels, which help traders identify future price movements. The bat pattern was introduced by Scott M. Carney in 2001 and is considered one of the most popular harmonic formations due to its precise structure.
The bat rules are based on specific Fibonacci levels that define price swings at points labelled X, A, B, C, and D. These points form the distinctive bat-like shape on the chart. The D point, also known as the Potential Reversal Zone (PRZ), is where traders expect the price to reverse its current trend. A bat can be found on various timeframes, and the larger the timeframe, the more reliable the pattern tends to be.
Here are the general bat pattern rules:
- XA: Initial price movement, from a swing low/high (X) to a swing high/low (A).
- AB: Retracement from A, typically to 0.382 or 0.50 of the XA leg.
- BC: Retracement, from 0.382 to 0.886 of AB (ideally 0.618) of AB, but no higher than 1.00.
- CD: Final leg, ending at 0.886 of XA, forming the PRZ for a potential reversal.
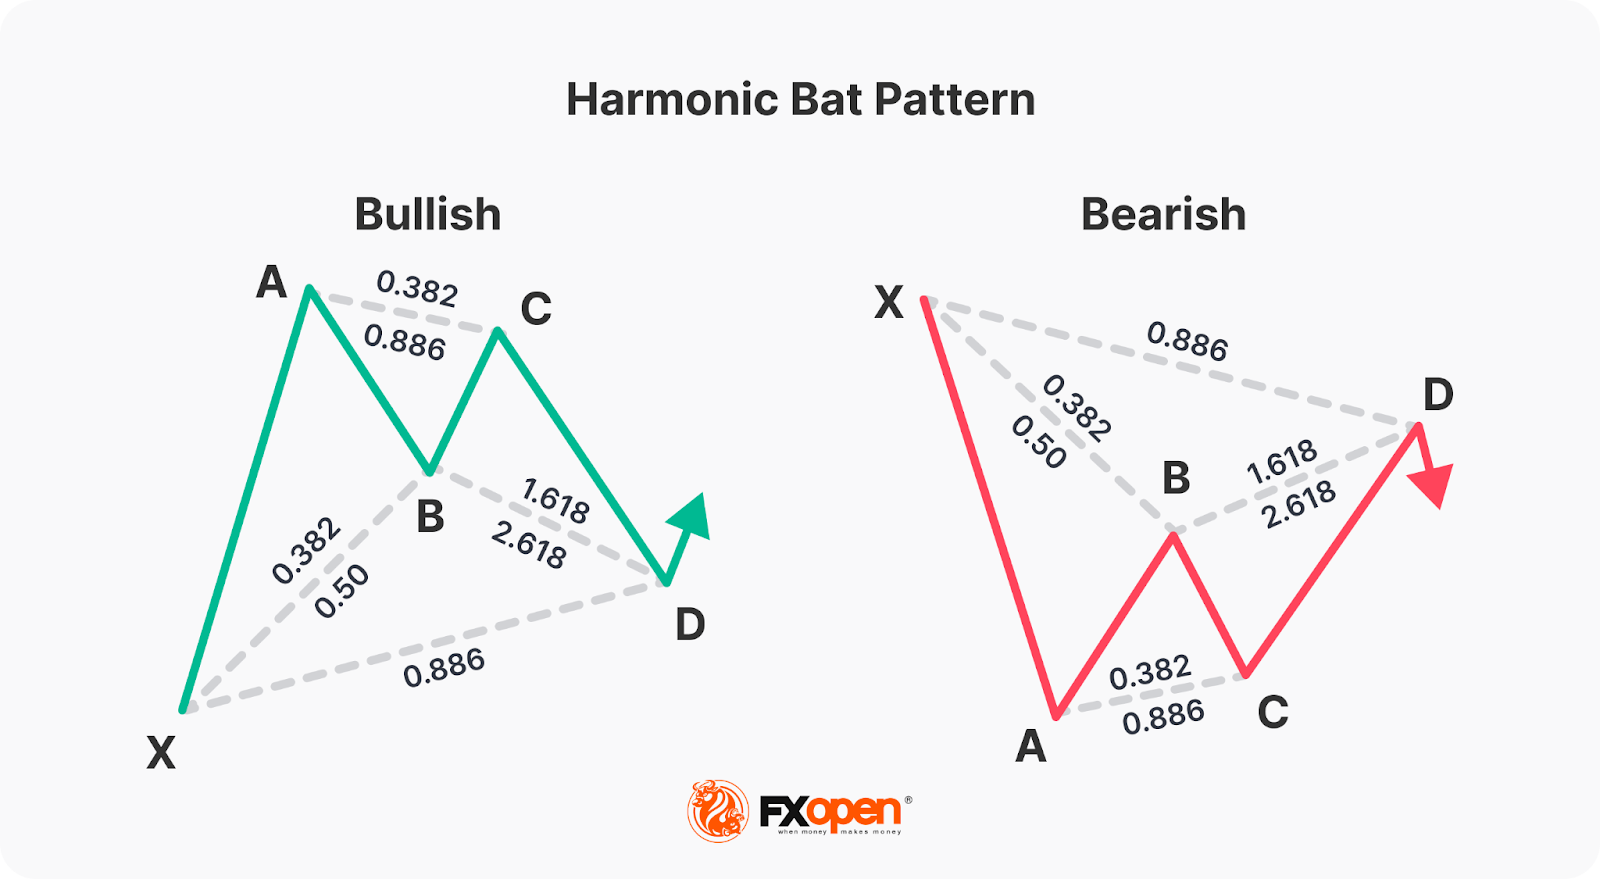
Bullish Bat Pattern
A bullish bat identifies a potential upward reversal. It begins with a price increase (XA) followed by a retracement to point B at 0.382 or 0.50 of XA. From B, the price moves to point C, reaching 0.382 to 0.886 of AB and then drops to point D, the key level at 0.886 of XA. This D point marks the Potential Reversal Zone, where traders expect the price to rise.
In the case of a bullish bat, traders typically enter a long position at point D and place stop-loss orders below the D level.
Bearish Bat Pattern
A bearish bat indicates a potential downward reversal. The price initially falls from X to A, retraces upwards to B (0.382 or 0.50 of XA), then retraces downward to C (from 0.382 to 0.886 of AB), before climbing back up to D at 0.886 of XA.
At point D, traders anticipate the price will reverse downward, presenting a good opportunity to enter a short position. Like the bullish bat, traders place stop-losses above the D point.
How We Identify the Harmonic Bat Pattern
Now, in order to fully get a grasp of the pattern, we are going to apply the bat pattern rules to live charts using our trading platform TickTrader.
The price of Bitcoin has increased by 8.86% from 12th to 16th December. Let’s examine whether there was any chance we could have foreseen this rise using the harmonic bat pattern.
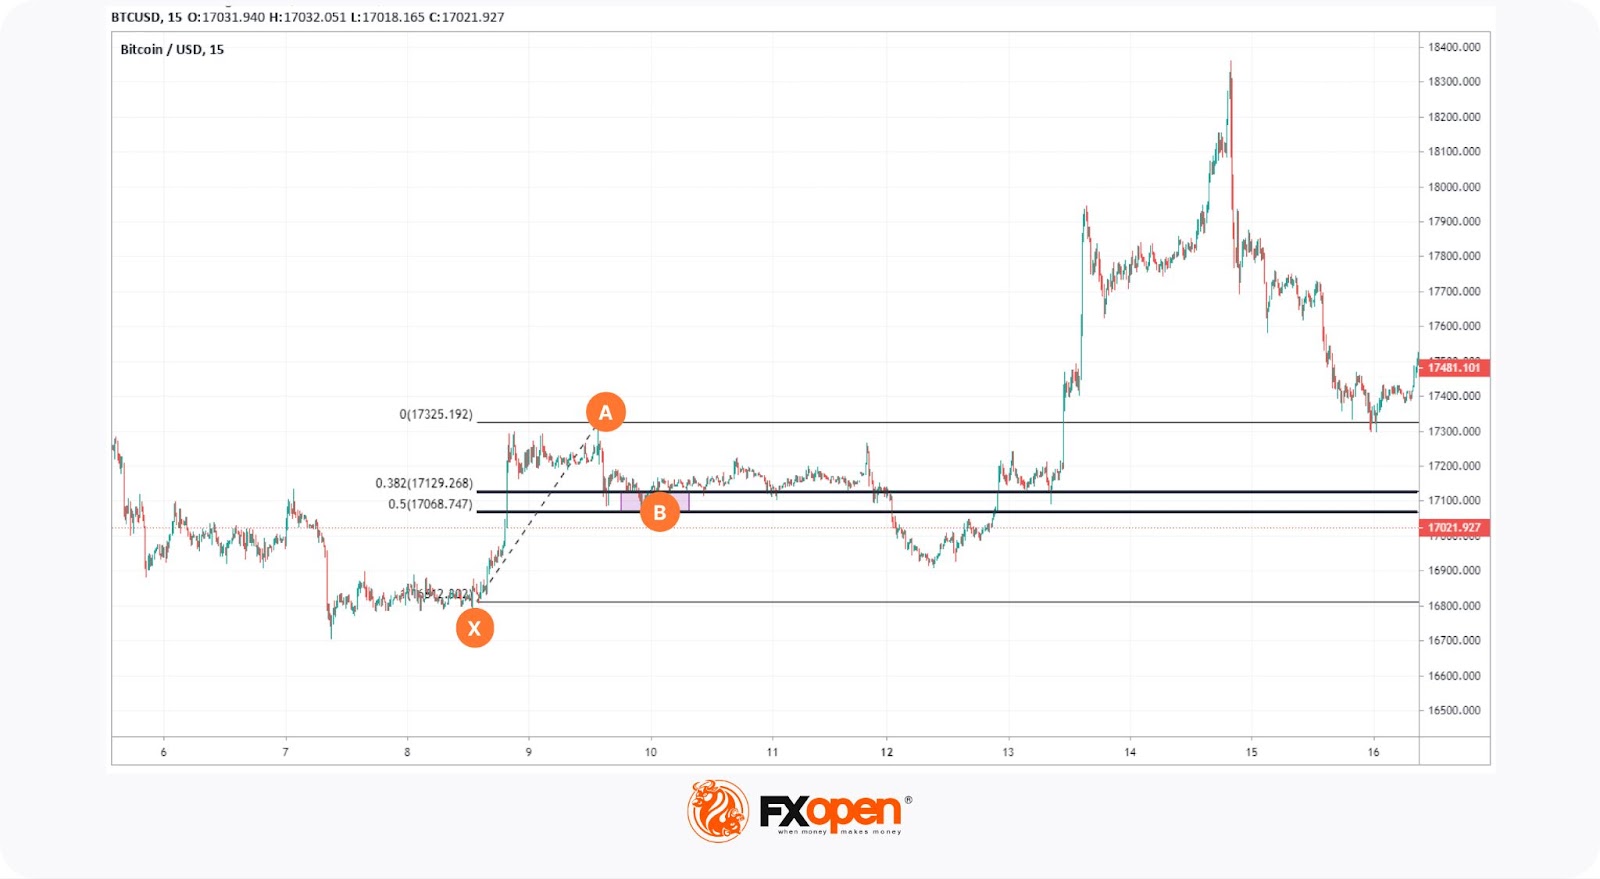
First, we are going to label the prior swing low with X and draw a line to the swing high, which we are labelling A. Next, let's validate the B wave using Fibonacci retracement drawn from X to A. As you can see, the B wave comes just at the 0.382 Fibonacci retracement level. So far, so good.
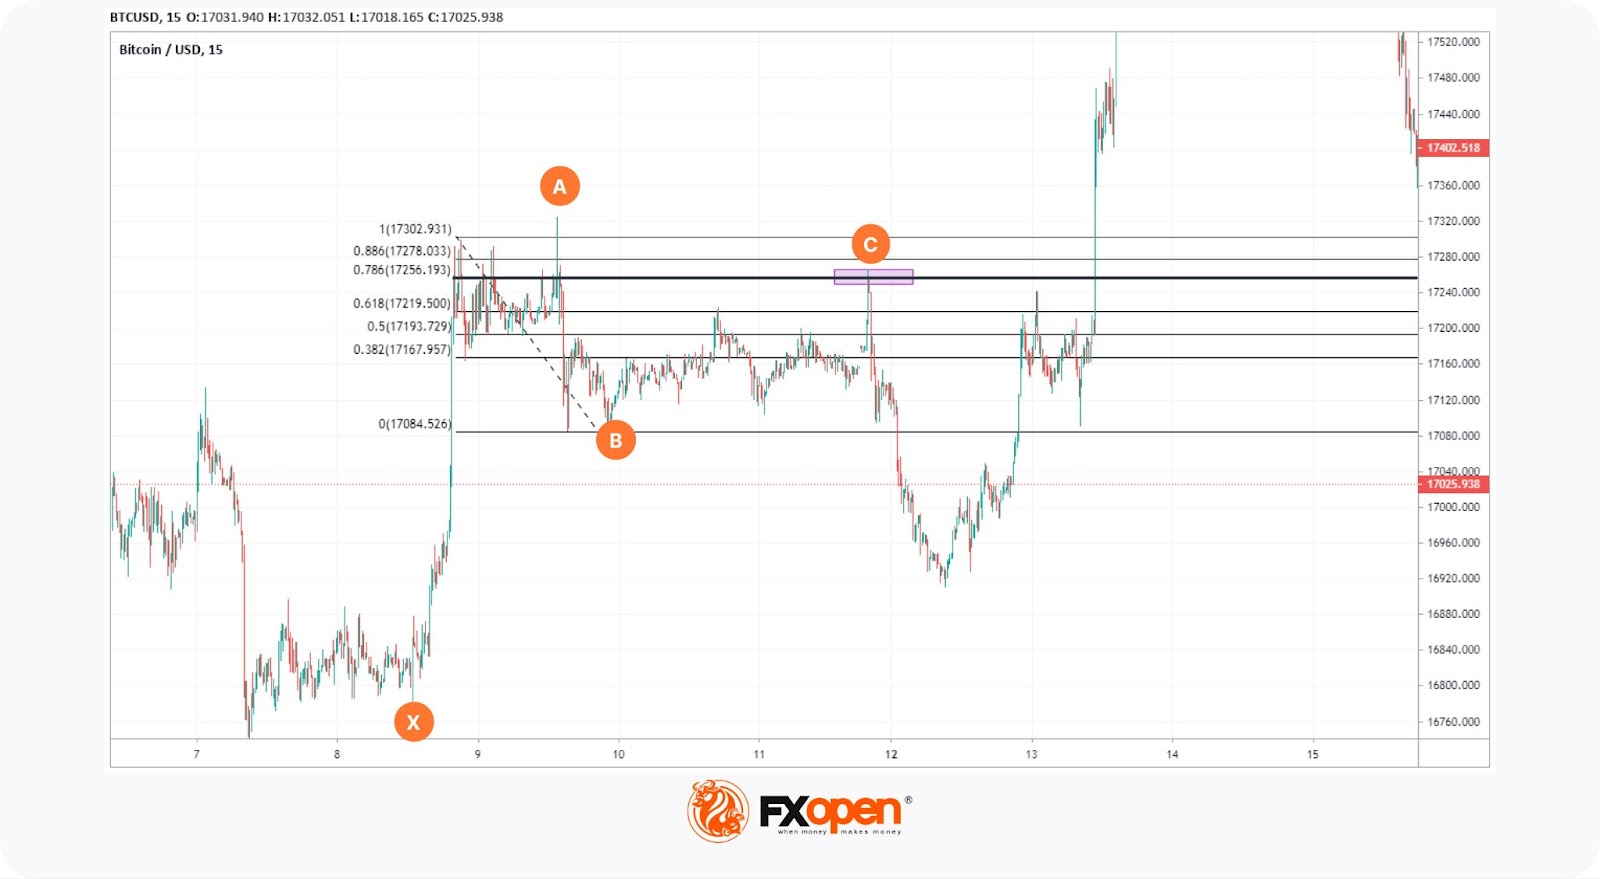
Now let's establish the C wave by drawing another Fibonacci retracement from point A to point B. The next lower high comes to 0.786, which confirms the C point because this is the ideal zone for the C wave to end.
Lastly, we are going to measure the target for the D point or Potential Reversal Zone. In this case, we already have another swing low so we are just going to examine its length compared to the length of XA with the Fib retracement tool.
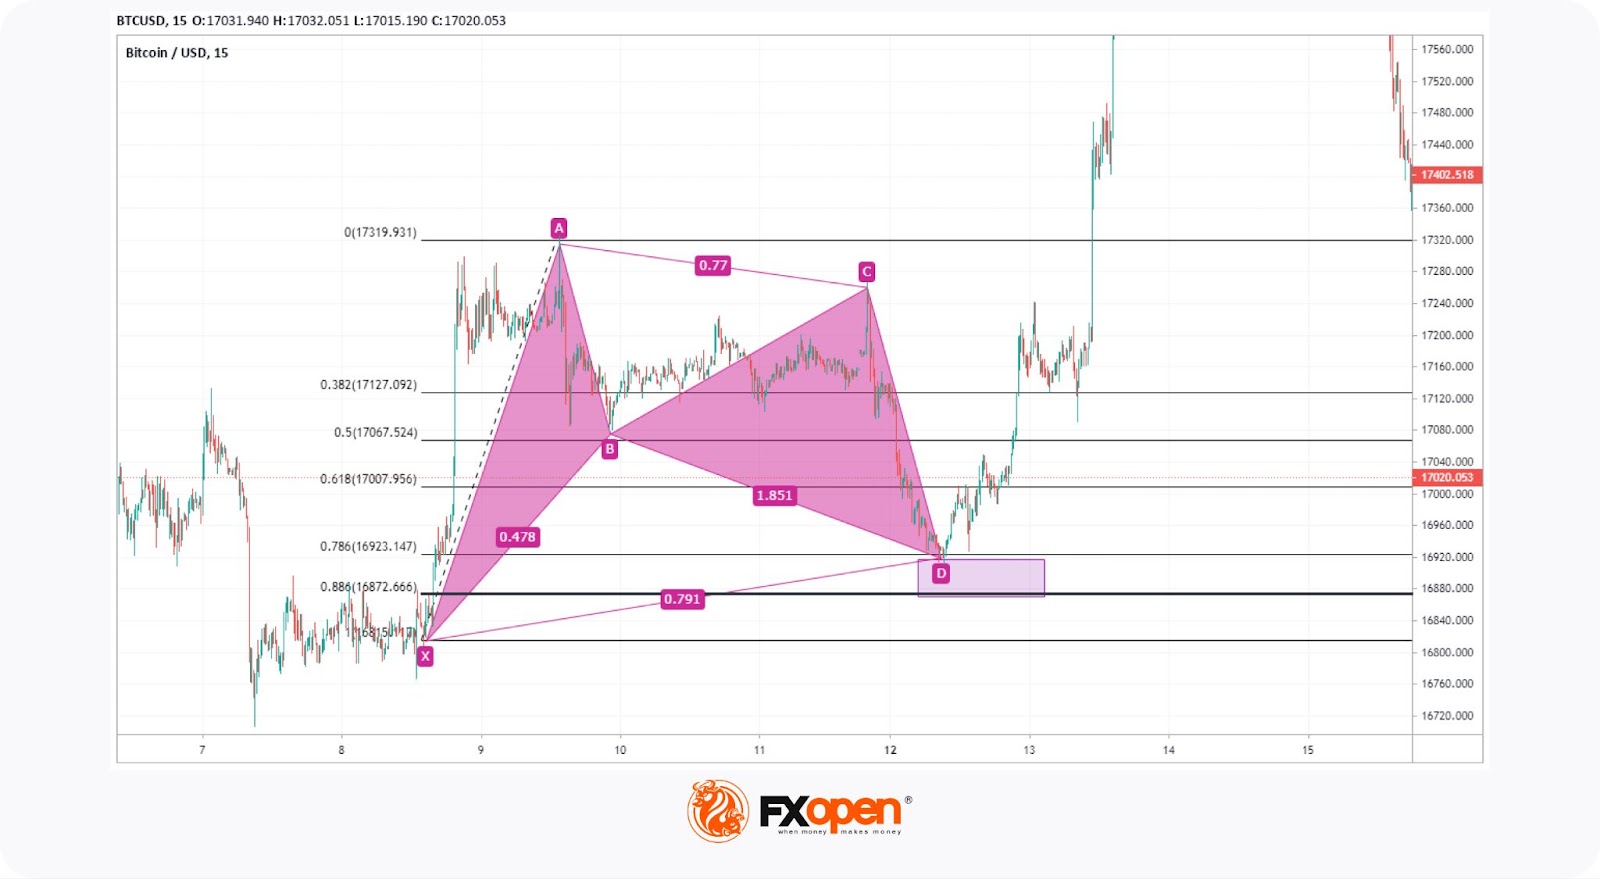
The PRZ is from 0.786 to 0.886, which is where the price found support and surged. This validated the bullish bat pattern and we have added the right and left bat wings to confirm our analysis.
How Can You Trade the Harmonic Bat Pattern?
Using the same example, let’s see how we can trade the harmonic bat pattern and outline a position in accordance with our analysis. Bat pattern trading is always done by opening a position in the Potential Reversal Zone.
It is important to be mindful of the horizontal support or resistance the zone correlates with, as this confluence points out the highest probability reversal level. In the case of Bitcoin, the price interacted with the 0.786 Fib retracement (D), which was on the horizontal support at $16,923.
You could look to set up a buy limit order or multiple ones in that area which would be your entry in this example. The stop loss could be set below the 0.886 Fib retracement.
Now that the entry and risk levels have been set, we will measure the risk/reward ratio to see if this is a position favourable for entry.
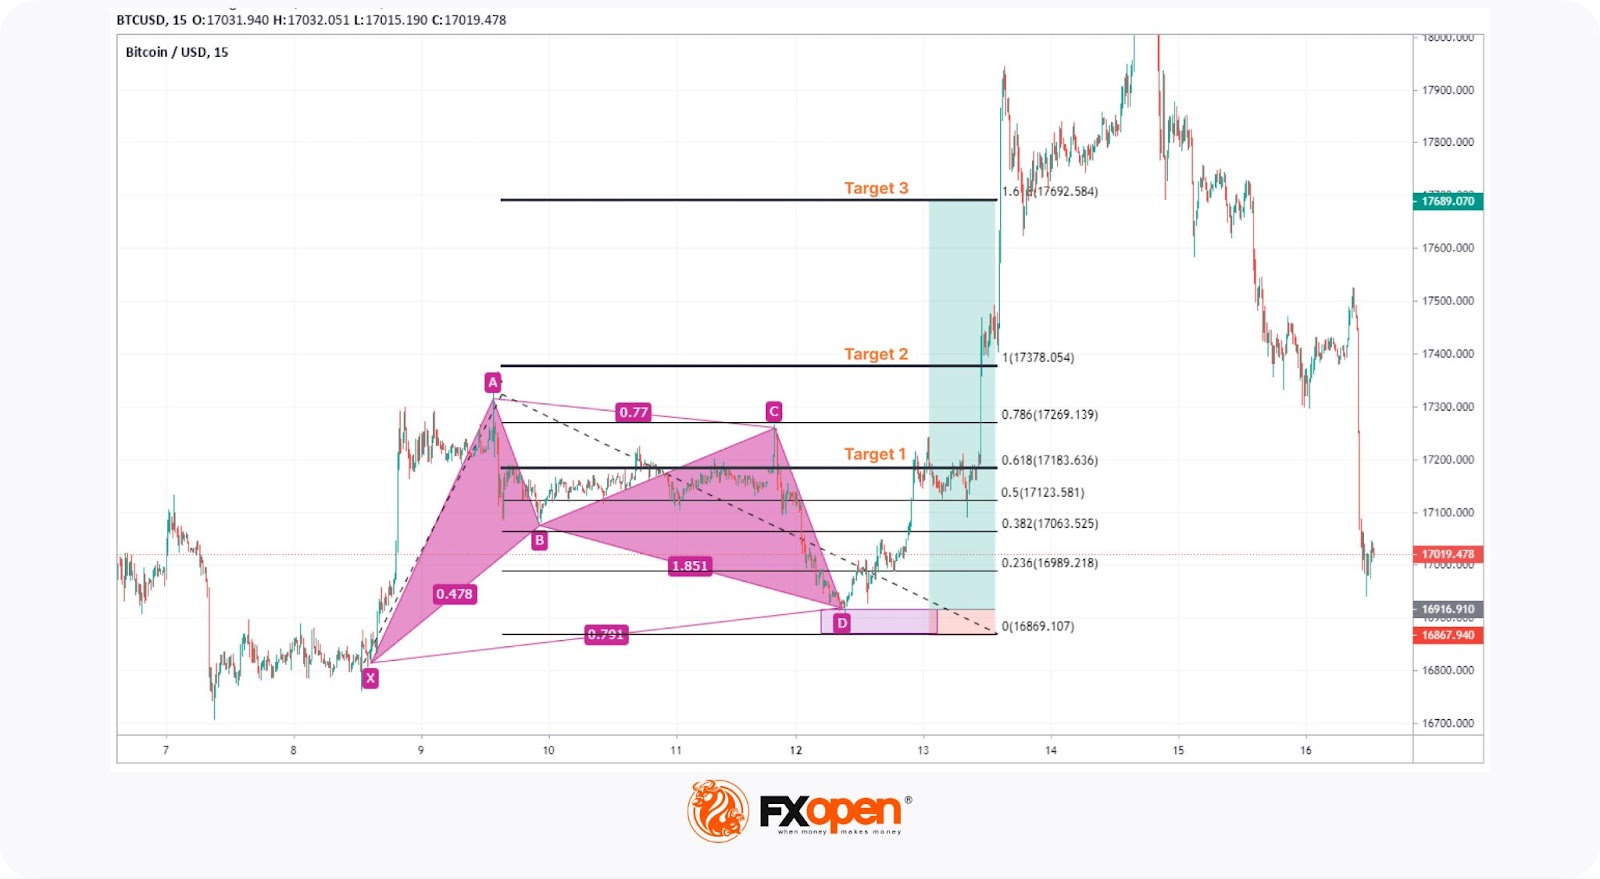
Using the Fibonacci extension first drawn from X to A and then to the D point, we could place the first target at $17,183 at the 0.618 Fib level. That comes at the 1:3 risk/reward ratio, thus making this position viable.
However, considering that the harmonic bat pattern is a reversal formation, usually, the price makes a higher high in a bullish formation, or a lower low in a bearish one, compared to its first swing point A. This is why the theory suggests traders divide a trade into three positions and close them when the price targets are met to ensure the maximum trade potential.
The next significant Fib levels are 1 and 1.618, which is why our targets 2 and 3 are there. In the Bitcoin example, we can see that the price indeed found resistance at those levels which again validates their significance.
How Traders Confirm the Bat
Confirming the harmonic bat is essential before entering a trade to ensure it aligns with the pattern’s strict rules. While it relies heavily on Fibonacci ratios, there are additional steps you can take to confirm its validity.
- Support and Resistance Levels. A strong confirmation comes when the Potential Reversal Zone (PRZ) aligns with established horizontal support or resistance. The more significant the level, the more reliable the reversal is likely to be.
- Candlestick Patterns. Bullish or bearish reversal candlestick formations such as hammer, engulfing, or morning star at the D point provide further validation of a price reversal. This adds confidence that the market is reacting to the pattern.
- Divergence on Oscillators. Indicators like the Relative Strength Index (RSI) or Moving Average Convergence Divergence (MACD) can offer added confirmation. If the price reaches the D point of the pattern, while the oscillator shows a bullish or bearish divergence, this strengthens the case for a reversal.
- Volume Analysis. A notable increase in trading volume at the D point suggests market interest and strengthens the likelihood of a reversal. Conversely, a lack of volume may imply the signal is weak or unreliable.
- Moving Averages. Moving averages can be used for confirmation. For a bullish bat, a price crossing above a significant moving average near the D point adds strength to the pattern. For a bearish bat, the price crossing below a key moving average can confirm a downward reversal.
- Larger market trends. The overall market context matters. A reversal signal provided by the bat might be more reliable when aligned with the broader trend, whether the market is trending up or down.
Common Mistakes to Avoid
Trading the harmonic bat might be rewarding, but mistakes often occur due to misinterpretation or improper application of the pattern’s rules. Avoiding these pitfalls can potentially improve your trading skills. Here are some common mistakes to watch out for:
- Ignoring precise Fibonacci levels. One of the key features of the bat formation is its strict adherence to Fibonacci retracement levels. Failing to follow the specific retracement ratios, such as 0.382 or 0.50 for point B, or 0.886 for point D, can invalidate the signal. Be sure to check that you’re measuring these levels accurately.
- Entering too early at the D point. The D point represents the Potential Reversal Zone (PRZ), but it’s not an exact entry point. Many traders rush into trades without waiting for additional confirmation, like a candlestick reversal pattern or a break of key support/resistance levels.
- Mislabeling points X, A, B, C, and D. Properly identifying each swing is crucial. Mislabeling these points can lead to an inaccurate pattern and unreliable analysis.
- Forgetting the larger trend. Even though bats identify reversals, it’s important to consider the overall market trend. Trading against a strong trend can result in losses if the reversal is temporary.
- Neglecting risk management. Overlooking stop-loss placements, especially below point D in a bullish formation or above it in a bearish one, can expose you to unnecessary risk.
Final Thoughts
The bat pattern is an advanced formation for traders who first and foremost understand the market structure, candlesticks, and Fibonacci levels. Without this foundation, it can be hard to apply it to trading. However, this is a helpful reversal pattern that can offer a favourable risk/reward ratio, and incorporating it into your trading arsenal can make a great difference. If you are ready to trade with the bat, open a trading account at FXOpen and enjoy low trading commissions, tight spreads, and high-speed trade execution. Good luck!
FAQ
What Is the Harmonic Bat Pattern?
The harmonic bat pattern is a technical chart pattern that identifies potential price reversals using Fibonacci retracement levels. Introduced by Scott M. Carney in 2001, it follows specific ratios between price swings to form a bat-like shape. The D point, or Potential Reversal Zone (PRZ), signals where traders expect the price to reverse.
Is the Bat Pattern Bullish or Bearish?
The bat pattern can be either bullish or bearish. A bullish pattern appears ahead of the upward reversal, while a bearish pattern signals a downward reversal.
What Is a Bat Strategy in the Stock Market?
The bat strategy involves identifying the harmonic bat pattern to enter trades at potential reversal points. Traders place buy or sell orders near the D point, based on whether the pattern is bullish or bearish.
This article represents the opinion of the Companies operating under the FXOpen brand only. It is not to be construed as an offer, solicitation, or recommendation with respect to products and services provided by the Companies operating under the FXOpen brand, nor is it to be considered financial advice.
Stay ahead of the market!
Subscribe now to our mailing list and receive the latest market news and insights delivered directly to your inbox.


Latest articles

US Dollar Index: A Defining Week for the King of the Markets
The dollar heads into a pivotal week trading near 101.80, just off a 15-month high, with the Fed's July 29 meeting standing as the clear focal point. Markets currently price roughly a 65% chance of a hold, though renewed

NZD/USD: Inflation Surge Meets Strong US Dollar Pressure
On 21 July, Stats NZ reported an acceleration in inflation: the Consumer Price Index rose 1.5% in the second quarter, while the annual inflation rate climbed to 4.1%, its highest level in more than two years and slightly

Weekly Market Insights with Gary Thomson: The Week of Central Banks and Earnings
In this video, we’ll explore the key economic events and market trends, shaping the financial landscape. Get ready for insights into financial markets to help you navigate the week ahead. Let’s dive in!
In this episode of Market