


Top 5 Patterns to Trade Breakouts
FXOpen

Most chart patterns are based on the breakout concept meaning they provide buy or sell signals when the price breaks beyond a certain level. This makes breakout trading much easier as traders know about entry points in advance. In this FXOpen guide, we will dive into the concept of breakout trading and learn the most common charts patterns traders use.
What Is a Breakout in Trading?
A breakout is a market condition when a price breaks above or below a strong level; a support and resistance breakout is the most common. As the price overcomes a strong level, a breakout is characterised by significant trading volumes. The rule says traders should buy when the price breaks above the level and sell when it moves with significant volumes below it.
Usually, the price consolidates for a while before breaking out. This helps traders identify entry points. Traders like breakouts because they can enter a trend at the early stages and gauge strong price momentum for potentially significant rewards.
Breakouts appear on charts of all assets and all timeframes. That is, a breakout in stocks, meaning a strong stock price move beyond a certain level, won’t differ from a breakout in forex, cryptocurrencies*, commodities, or indices.
Types of Breakouts
Breakouts can be divided into several categories:
Strength of the Signal
- Breakout. A breakout is a condition when a price breaks a certain level and continues moving in the breakout direction.
- Fakeout. Not all breakouts work. A breakout that doesn’t work is known as a fakeout. A fakeout is a market condition when the price moves beyond a strong level but turns around. A fakeout is accompanied by low trading volumes.
Trend
- Continuation. These are breakouts that occur in a solid trend after a period of short-term consolidation when the price breaks beyond the line in the direction of the prevailing trend.
- Reversal. These are breakouts that appear after a solid trend and signal the formation of a new one.
Price Direction
- Bullish. A breakout is bullish when the price moves above the level (usually the resistance level) and continues to rise.
- Bearish. A breakout is bearish when the price moves below the level (usually the support level) and continues falling.
How to Trade Breakouts
Regardless of the timeframe and market conditions, the general breakout trading rules are as follows:
Entry
The theory suggests that traders enter the market on a breakout with an aggressive approach. As part of a conservative strategy, they are likely to enter after a few candlesticks are formed following the breakout.
Stop Loss
A stop-loss order is placed below the broken level in a bullish breakout and above the broken level in a bearish one. In most cases, the price retests the broken level. Therefore, if you place a stop loss at the level or too close to it, you risk exiting the market too early. Still, the order size depends on numerous factors; it is not determined by the breakout.
Take Profit
A take-profit target can be easily identified when trading chart patterns, as they all have specific rules. Another option is to calculate recent price swings and take their average as a price target. For example, if you are trading breakouts in the forex market and the price is moving three pips on average over the past few swings, you can consider three pips as your target.
Note: you can modify these rules according to your trading approach, assets you trade, and trading strategy you utilise.
How to Identify Breakouts
There are a few signs of a breakout.
Consolidation
As it was already mentioned, the price usually moves within a narrow range before breaking beyond a strong level.
Strong Support and Resistance Levels
To identify a breakout, traders usually draw support and resistance levels. The more often the price touches either of them, the stronger the breakout is expected to be. At the same time, the length of the levels may identify the length of a breakout – the longer the price consolidates, the longer the move after the breakout is supposed to be.
Low Trading Volumes
During the consolidation, trading volumes are low as neither buyers nor sellers can take control of the market. When either of them drives the market, volumes increase.
Technical Analysis Tools
There are various indicators and patterns that help traders spot areas where the price could break out. In our article How to trade breakouts, we explain the tools and provide a breakout trading strategy.
Top 5 Breakout Patterns
Breakout technical analysis is based not only on indicators but also on chart patterns. As chart patterns frequently appear in price charts, by learning the most common of them, you will be able to spot trading opportunities easily.
Triangles
There are three types of triangles: ascending, descending, and symmetrical. They occur during and after a solid trend. An ascending triangle signals an upward movement, a descending triangle predicts a downward movement, while a symmetrical triangle doesn’t specify where the market will move.
Triangles are framed with two lines:
- In an ascending triangle, the upper line goes through almost equal highs, and the lower line connects higher lows.
- In a descending triangle, the upper line connects lower highs while the lower line goes through almost equal lows.
- In a symmetrical triangle, the upper boundary connects lower highs, while the lower boundary goes through higher lows.

Entry
Trading with an ascending triangle, traders usually buy when the price breaks above the upper line; in a descending formation, they wait for the price to fall below the lower line. In a symmetrical triangle, the position will depend on the overall market sentiment as the price can break beyond either of the lines.
Stop Loss
A stop-loss order is usually placed below the upper line in an ascending formation, above the lower line in a descending setup. When trading with a symmetrical triangle, traders usually place it below the upper level in a bullish breakout and above the lower level in a bearish one.
Take Profit
The theory suggests that the potential profit can be taken at a distance equal to the size of the widest part of the triangle, placed from the breakout level.
Flags
Flags signal a trend continuation and appear when the price tries to change its overall trend, but it fails, and the trend continues. Flags consist of the flag itself and the flagpole. They are framed with two trendlines, where in a bullish flag, they connect lower highs and lower lows, and in a bearish flag, they move through higher highs and higher lows. To spot the pattern in a price chart, you need to wait for a strong price movement followed by a move in the opposite direction.
Entry
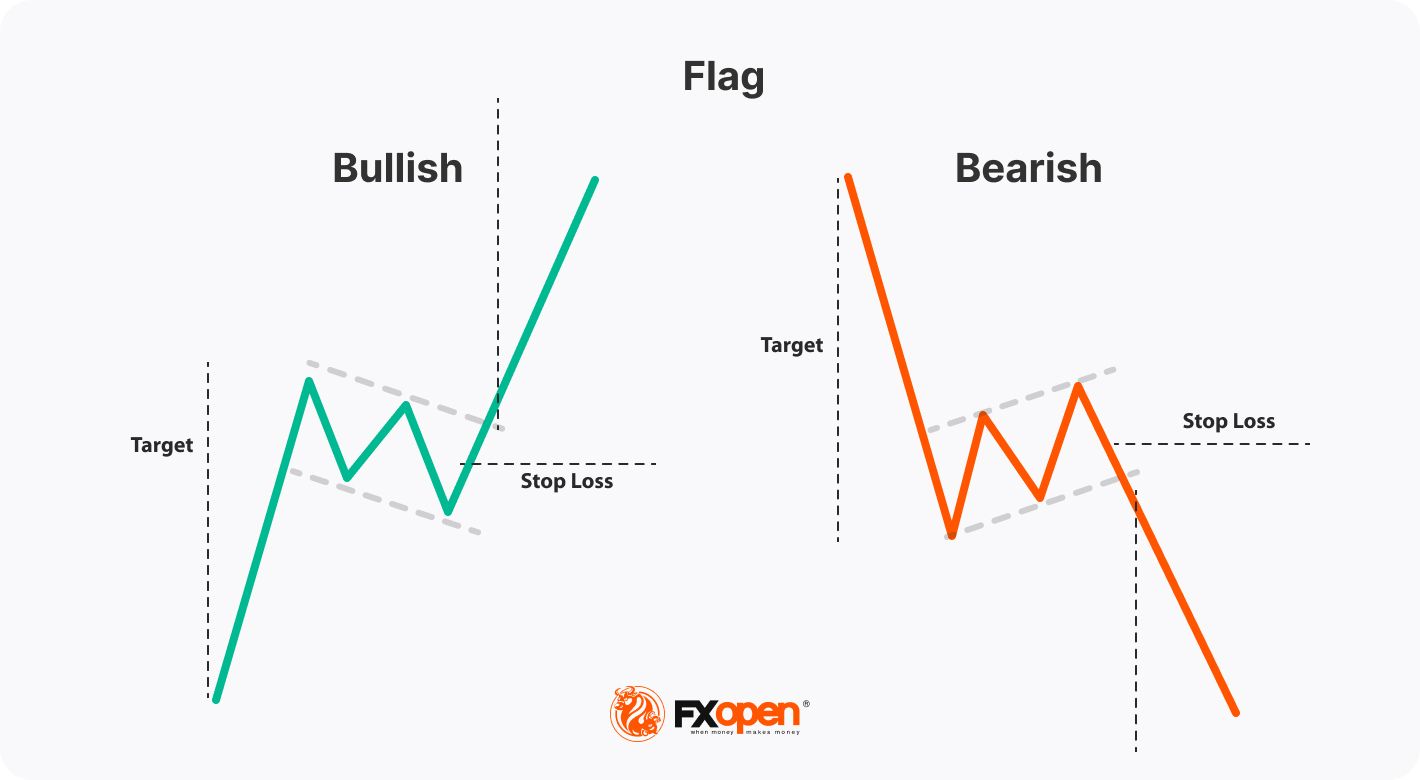
As flags signal a trend continuation, traders are supposed to sell in a bearish trend when the price falls below the flag’s lower boundary and buy in a bullish trend when the price rises above the flag’s upper boundary.
Stop Loss
A stop loss placement depends on the market conditions, but the common rule is to set it below the upper band of the flag when going long and above the lower band when going short.
Take Profit
When trading with flags, traders place a take-profit target at a distance equal to the length between the beginning of the trend and the pattern (flagpole).
Pennants
A pennant pattern combines the features of a symmetrical triangle with the features of the flag pattern. That is, it has the shape of a symmetrical triangle, but take-profit targets are identified the same as with a flag formation – based on the length of the flagpole.
The pennant is a continuation pattern that appears during a short-term consolidation within a strong trend. If you identify it in a bullish trend, it’s more likely the price will break above its upper boundary and continue rising. Conversely, if you meet a pennant in a downtrend, the price will likely fall after breaking its lower band.

Entry
On spotting a pennant in a downtrend, traders usually sell on a breakout of a lower line. When traders use a bullish pennant, they usually buy as soon as the price breaks above its upper line.
Stop Loss
A stop-loss level usually lies above the lower line when opening a sell position and below the upper line when buying.
Take Profit
According to common rules, the price is supposed to move the distance equal to the length between the beginning of the movement and the pattern (flagpole) counted from the breakout.
Wedges
Wedges are reversal patterns. A rising wedge occurs before a bullish trend turns down, while a falling wedge appears in a bearish trend before the price turns up. Wedges are formed with two sloping lines of different degrees. In a rising wedge, they connect higher highs and higher lows, while in a falling wedge, they go through lower highs and lower lows.
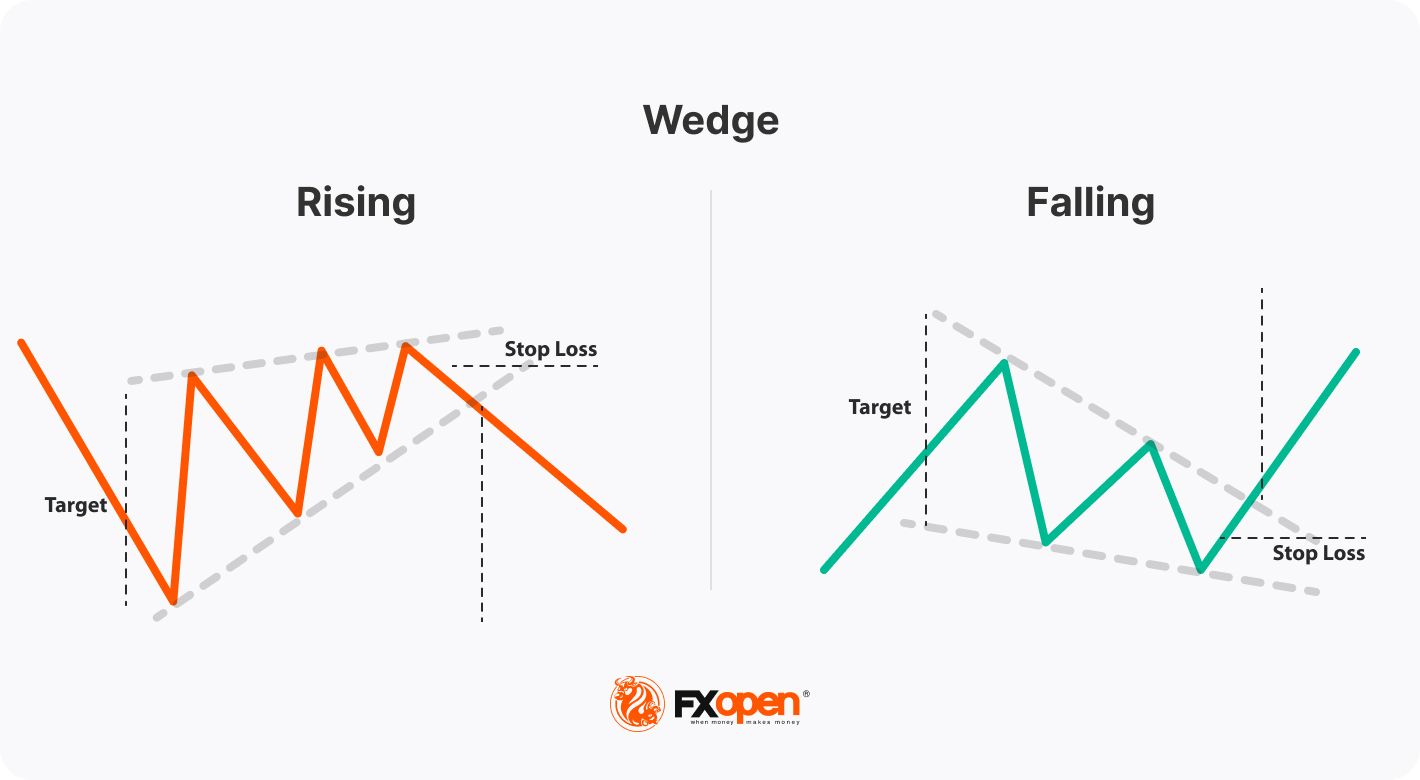
Entry
When a rising wedge appears in an uptrend, traders expect the price to reverse, so they enter at the breakout of its lower boundary. Conversely, when trading with a falling wedge, traders expect the price to rise soon; therefore, they wait for it to break above the upper band of the wedge.
Stop Loss
A stop-loss level lies above the lower line when opening a sell position and below the upper line when buying.
Take Profit
Traders usually measure the widest part of the wedge and place the same distance from the breakout line to identify potential profit targets.
Channels
There are three types of channels: ascending, descending, and rectangular. A channel is formed when the price moves within a narrow range framed with two lines – support and resistance. In an ascending channel, the lines go through higher highs and higher lows; in a descending channel, they connect lower highs and lower lows, while in the rectangular channel, highs and lows are almost equal.
Channels are dual patterns that can be both bullish and bearish. Still, in most cases, the ascending channel is bullish, and the descending channel is bearish. Traders wait for the price to break beyond either support or resistance to trade in the breakout direction.

Entry
As in channel formation, the price can break out in either direction, so traders consider overall market conditions and base their projections on other technical analysis tools, fundamental analysis, and market sentiment analysis. If the price breaks above the resistance, traders usually buy; if the price falls below the support, traders usually sell.
Stop Loss
A stop loss is usually placed below the resistance level in a long trade and above the support level in a short trade.
Take Profit
The theory says that after a breakout, the price should move at least the distance equal to the width of the pattern.
Final Thoughts
Breakout trading provides many opportunities. However, you should learn how to validate breakouts as sometimes they turn into fakeouts. Trading breakouts with a strategy is one of the keys to success. Before you enter the real market, you can test different approaches on the TickTrader platform. After that, you can open an FXOpen account for live trading.
*At FXOpen UK and FXOpen AU, Cryptocurrency CFDs are only available for trading by those clients categorised as Professional clients under FCA Rules and Professional clients under ASIC Rules, respectively. They are not available for trading by Retail clients.
This article represents the opinion of the Companies operating under the FXOpen brand only. It is not to be construed as an offer, solicitation, or recommendation with respect to products and services provided by the Companies operating under the FXOpen brand, nor is it to be considered financial advice.
Stay ahead of the market!
Subscribe now to our mailing list and receive the latest market news and insights delivered directly to your inbox.


Latest articles

Weekly Market Insights with Gary Thomson: The Week of Central Banks and Earnings
In this video, we’ll explore the key economic events and market trends, shaping the financial landscape. Get ready for insights into financial markets to help you navigate the week ahead. Let’s dive in!
In this episode of Market

Intel at a Crossroads: Earnings Beat Meets Technical Resistance
Intel has just delivered its strongest quarter in over fifteen years, and the market reaction says it all. Q2 2026 revenue surged 25% year-over-year to $16.1 billion, crushing the consensus estimate of $14.42 billion, while adjusted EPS of

Tesla: Complex Range Structure Breaks Down Following Quarterly Earnings
Tesla released its Q2 2026 results after the market closed on 22 July. Revenue increased 26% year-on-year to $28.24 billion, while vehicle deliveries reached a record 480,126 units. However, operating margin fell sharply to 1.4%, down from