


How to Trade on Support and Resistance Reversals
FXOpen
Trading in the financial markets can be a complex endeavour, but it may become more manageable when traders have a solid grasp of support and resistance levels. Recognising support and resistance reversals is a crucial skill that may enhance one's trading performance. In this FXOpen article, we will learn the types of support and resistance and consider some trading strategies based on market reversals.
Recognising Support and Resistance Reversals
It’s unlikely you will need to ask, “What are support and resistance lines?” Still, let’s refresh your memory.
A support line is a level at which an asset's price tends to find buying interest, preventing it from falling further. In other words, it's where demand for the asset is strong enough to counteract selling pressure. Traders often identify support as a potential point when going long or a take-profit target when selling. It can be formed at various price points on a chart and can be horizontal and diagonal (trendlines).
A resistance line is a level at which an asset's price tends to encounter selling pressure, preventing it from rising further. It represents a point where supply exceeds demand, leading to potential reversals or pullbacks. Traders often identify resistance as a potential point when going short or a take-profit target when buying. Like support, resistance levels can also be horizontal, diagonal, or coincide with round numbers.
Support and Resistance: Types
There are various types of support and resistance, including trendlines, round numbers, Fibonacci retracements and extensions, pivot points, and dynamic lines.
Trendlines
Trendlines are one of the most fundamental tools in technical analysis. They are lines drawn on a price chart to connect consecutive lows and consecutive highs to identify the direction of the market. Trendlines act as support and resistance, helping traders identify potential reversal points and trend continuations. The intersection of price movements with trendlines often signifies significant market sentiment shifts.
There are three fundamental types of trendlines:
- Uptrend Lines: Uptrend lines connect a series of higher lows and function as support levels on a price chart. These lines are indicative of bullish market conditions, signifying a consistent upward trajectory in asset value. Traders often use uptrend lines to identify potential entry points for long positions.
- Downtrend Lines: Downtrend lines link lower highs and act as resistance in technical analysis. They reflect bearish market conditions, suggesting a persistent downward trend in asset value. Downtrend lines are valuable for traders looking to establish potential entry points for short positions.
- Sideways or Range-Bound Lines: Sideways or range-bound lines connect comparable highs and lows, illustrating a market in a state of consolidation or trading within a defined range. These lines indicate the lack of strong trends in either direction and are essential for traders to recognise when markets are moving sideways.
Closest Swing Points
Traders can draw support and resistance through the most recent swing point.
- Support: To find a support level based on the closest swing point, traders identify a recent swing low. This low point is where buying interest emerged previously.
- Resistance: To determine a resistance level based on the closest swing point, traders look for the recent swing high. This high point is where selling pressure halted a previous uptrend.
Round Numbers
Round numbers are psychological levels that often serve as support or resistance. They tend to attract the attention of traders and investors due to their simplicity and significance. For example, in a currency pair like EUR/USD, a round number might be 1.2000. These levels can act as barriers where traders make decisions to buy or sell, making them essential reference points in technical analysis.
Fibonacci Retracements and Extensions
Fibonacci retracement and extension levels are based on the Fibonacci sequence and are used to identify potential support and resistance zones. The most commonly used Fibonacci retracements are 23.6%, 38.2%, 50%, and 61.8%. Traders apply these levels to charts to determine where price reversals or corrections may occur. Fibonacci extensions are key tools in technical analysis used to project potential price targets beyond the original trend. The most commonly used levels are 161.8%, 261.8%, and 423.6%.
Pivot Points
Pivot points are calculated levels that help traders identify critical support and resistance points. They are used to determine potential price reversals or breakouts. Traders often look at multiple pivot point levels, including support 1 (S1), support 2 (S2), resistance 1 (R1), and resistance 2 (R2), to gauge the market's sentiment and make trading decisions accordingly.
Dynamic Lines
Dynamic support and resistance are not fixed on the chart but change with market conditions. Common examples include moving averages and Bollinger Bands. Moving averages can act as dynamic support or resistance depending on their positioning relative to the current price: if the price is above the MA, the moving average serves as a support, while if the price is below the MA, the moving average can be used as a resistance. Bollinger Bands consist of a middle band (the moving average) and upper and lower bands that represent dynamic support and resistance zones based on price volatility.

Trading Strategies for Support and Resistance Reversals
Below, you will find two of the most straightforward strategies you can apply to various markets and timeframes.
Bounce Trading Strategy
Objective: To capitalise on confirmed support or resistance by entering positions when the price bounces off these levels.
Entry Point:
- Long Trade (Support Bounce): Traders may wait for the market to approach a strong support level. They always look for a confirmation signal, including a bullish candlestick pattern, such as a hammer or engulfing pattern, or a technical indicator. You may enter the trade at the opening of the next candle after the bullish confirmation signal.
- Short Trade (Resistance Bounce): The trader may wait for the market to approach a robust resistance level. They always look for confirmation with a bearish candlestick pattern, such as a shooting star or bearish engulfing pattern, near the resistance level or a technical indicator. You may enter the trade at the opening of the next candle after the bearish confirmation signal.
Exit Point:
- Take Profit: Traders might set a take-profit order at a reasonable distance from their entry point, aiming for a risk-reward ratio of at least 1:2.
- Stop-Loss: One common practice you may consider is to place a stop-loss order just below (for long trades) or above (for short trades) the support or resistance level you are trading. This may help protect against significant losses if the market moves against your trade.
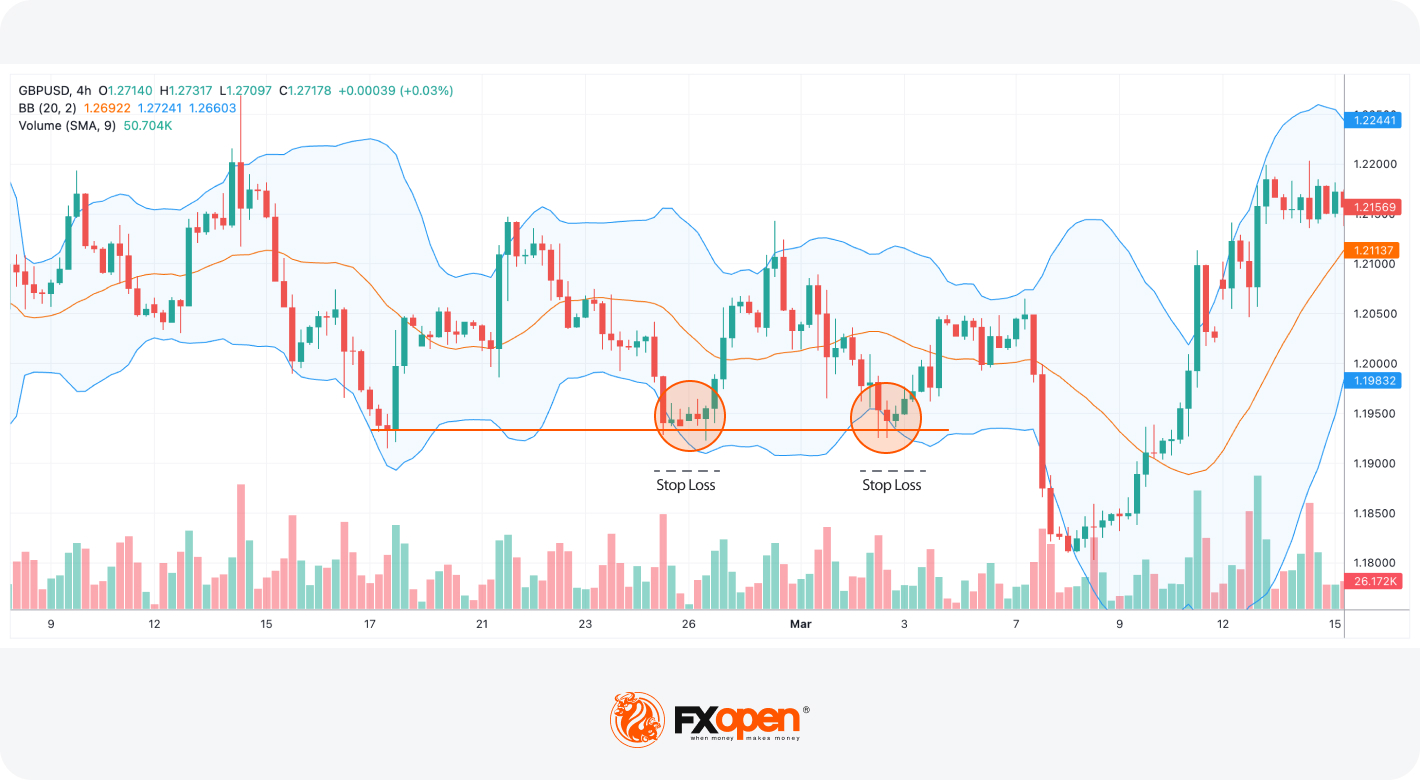
Look at the chart above. A trader could initiate two trades on the support level. In the first one, they could get confirmation from consecutive candles with small or non-existing lower shadows and rising bullish volumes. In the second trade, they may get confirmation from the Bollinger Bands as the lower band is aligned with the support level.
Pullback and Retest Strategy
Objective: To enter trades on pullbacks to previously broken support or resistance levels, which may now act as new support or resistance.
Entry Point:
- Long Trade (Resistance Turned Support): Traders wait for the price to break significant resistance and retrace to retest it as new support. To confirm a successful retest, you may look for reduced volume and bullish candlestick patterns. To enter a trade, you may wait for the next candle after the retest confirmation to open.
- Short Trade (Support Turned Resistance): Traders wait for the price to break substantial support and retrace to retest it as new resistance. You may ask, “If the price is dancing above the support zone but hasn't broken below it, what should we do?” To make the strategy work, you will need to wait for a breakout and confirm the retest. To get a confirmation signal, you may look for reduced volume and bearish candlestick patterns. An entry point may be initiated when the next candle after the retest confirmation opens.
Exit Point:
- Take Profit: You may set a take-profit order based on your desired risk-reward ratio, considering the potential price target based on the recent significant swing point.
- Stop-Loss: Traders usually place a stop-loss order just below (for long trades) or above (for short trades) the retested support or resistance level to manage risk.
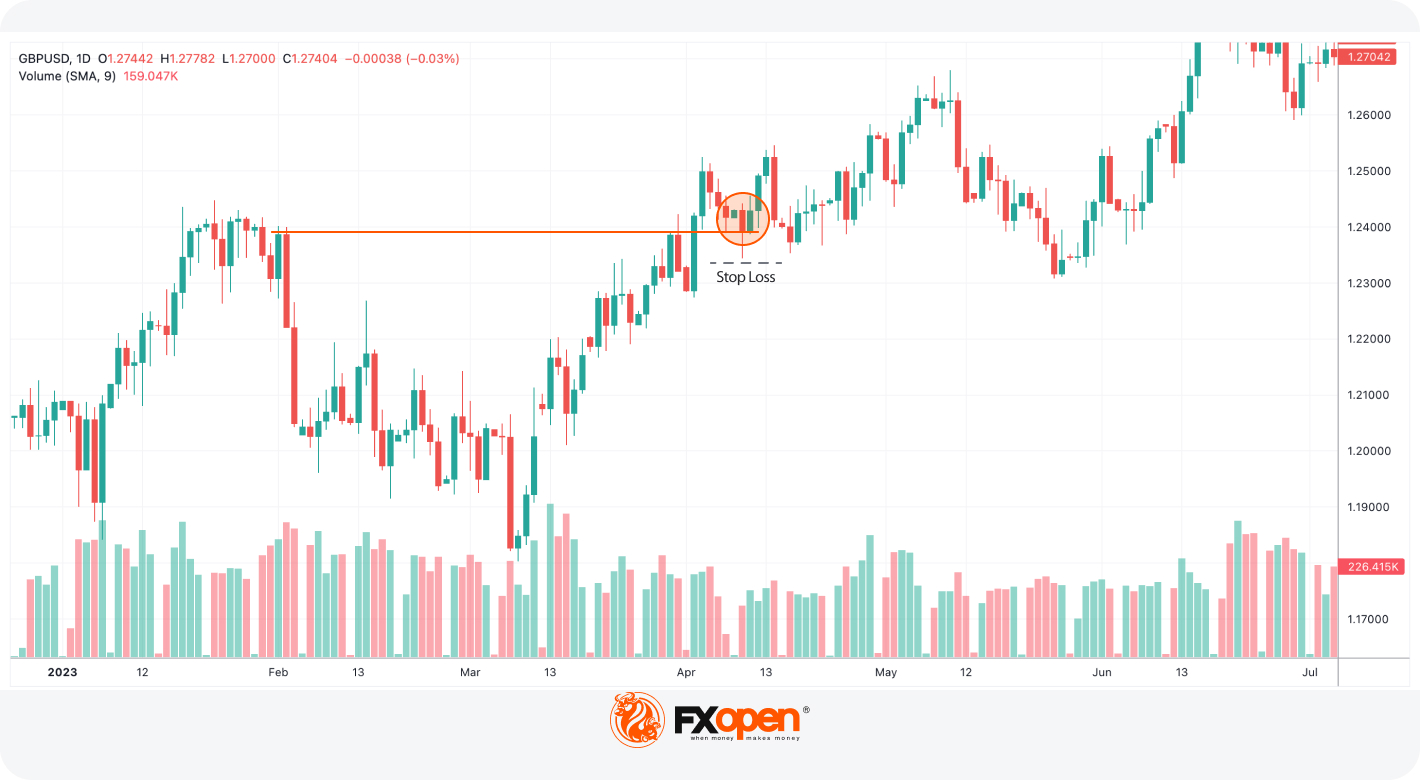
In the chart above, a trader could enter a trade on a retest of a broken resistance level that turned into support. Rising bullish volumes on a support point could serve as a confirmation signal.
Common Pitfalls to Avoid
Trading on support and resistance reversals may be a rewarding strategy, but it's essential to steer clear of common pitfalls that may lead to losses. Here are three significant pitfalls to avoid:
- Overtrading. As the support and resistance reversal strategies are straightforward and conditions for them can be found on almost any market and any timeframe, traders may fall into an overtrading trap. Overtrading occurs when traders execute an excessive number of trades, often driven by the fear of missing out or the desire for quick profits.
- Ignoring Fundamental Analysis. While technical analysis plays a crucial role in trading support and resistance reversals, ignoring fundamental analysis can be a significant pitfall. Economic data releases, geopolitical events, or company news can lead to unexpected market moves.
- Neglecting Risk Management. Neglecting risk management is a critical mistake that traders should avoid, regardless of their strategies. Failing to implement proper risk management can result in substantial losses that outweigh gains.
Final Thoughts
Understanding the various types of support and resistance, including trendlines, round numbers, Fibonacci retracements and extensions, pivot points, and dynamic levels, is essential for traders and analysts to make informed decisions in the financial markets. These tools offer valuable insights into potential market reversals and overall market sentiment. Support vs resistance trading strategies are straightforward and may be applied to almost any market. If you want to test them, open an FXOpen account and enjoy trading in over 600 markets on the TickTrader platform!
This article represents the opinion of the Companies operating under the FXOpen brand only. It is not to be construed as an offer, solicitation, or recommendation with respect to products and services provided by the Companies operating under the FXOpen brand, nor is it to be considered financial advice.
Stay ahead of the market!
Subscribe now to our mailing list and receive the latest market news and insights delivered directly to your inbox.


Latest articles

Amazon Analysis: Strong Earnings Coincide with a Breakout from the Correction
On 30 July, Amazon.com reported its financial results for the second quarter of 2026, significantly exceeding market expectations. Revenue rose 20% year-on-year to $200.6 billion, compared with the consensus forecast of around $196.5 billion. The main growth

GBP/USD and EUR/GBP Await Key Bank of England Decision
The pound strengthened following the outcome of the US Federal Reserve meeting, where the central bank, as expected, kept interest rates unchanged. However, the Fed did not provide the market with clear signals of an imminent shift towards rate cuts,

Microsoft Analysis: Earnings Beat Expectations
On 29 July 2026, Microsoft reported its results for the fourth quarter of fiscal year 2026. Revenue reached $90 billion, up 18% year-on-year, while adjusted earnings per share came in at $4.74, comfortably ahead of analysts' expectations of $4.