


How to Trade with a Gartley Pattern
FXOpen

The Gartley is a trend continuation pattern, meaning that after it completes, the trend is likely to continue with greater momentum. It has the potential to be found in any market, including Forex, stocks, cryptocurrencies, and commodities. On the other hand, it may appear on any timeframe, so it's suitable for any style of trading — from swing to day trading, and even scalping.
In this FXOpen post, we talk about the history of the Gartley pattern, its relation to the ABCD formation, and ways to identify and use it in trading.
What Is the Gartley Pattern?
The Gartley is a harmonic pattern. It is named after H.M. Gartley, who first introduced it in 1930 in his book “Profits in the Stock Market.” This is the most common harmonic chart setup used in stock, cryptocurrency, commodity, and Forex trading.
It’s a well-known fact that the Gartley pattern’s indicators are Fibonacci retracement and extension. The formation is based on Fibonacci numbers and ratios. Interestingly, Gartley didn’t use the Fibonacci levels to identify the setup. Larry Pesavento later introduced them in his book “Fibonacci Ratios with Pattern Recognition” in order to make a distinction between all harmonic formations.
Gartley is a type of ABCD trading pattern. Usually, it implies a trend continuation after a reversal. In the following paragraphs, we are going to explain the Gartley variation of the ABCD setup and how you may use it for trading.
Gartley Explained
There are bullish and bearish Gartley patterns that differ with the price movements from X to A. However, both setups consider the general rules.
- The Gartley consists of four points of the ABCD setup and an additional point, X, which is always the beginning of the setup. The first price swing is labelled with A, and the first leg goes from X to A.
- The first retracement after the initial swing is point B.
- It’s followed by the next price swing, which is marked with C. It’s a corrective move to the retracement of the AB leg.
- The next swing from C to D is an extension of the BC leg, which completes the setup.
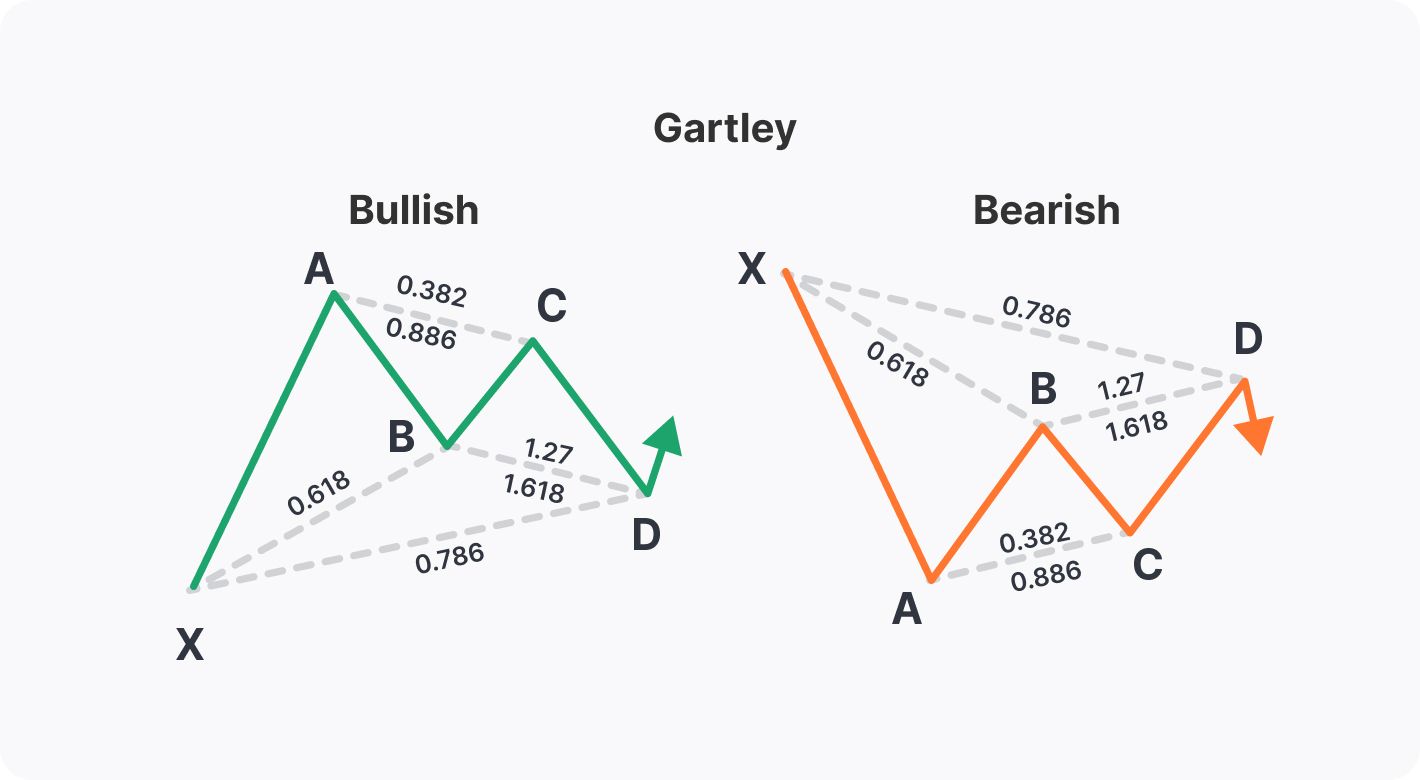
The Fibonacci ratios and levels between these points are what distinguish the Gartley from other harmonic formations.
Gartley Pattern Rules
Considering that the Gartley is one of the variations of the harmonic setups, let's see how we can identify it specifically. We are going to apply rules and outlined Fibonacci ratios between the points in order to do so. The rules to identify the Gartley setup are:
- Point B should retrace at 61.8% of the first price swing from X to A.
- Point D should at the end at the 61.8% or 78.6% retracement of the first price swing from X to A
- Point C comes at 38.2% or 88.6% of A to B length
- The CD leg should be the 113% or 161.8% extension of BC leg
Now let's look at some of the live charts from TickTrader and try to identify a Gartley pattern on Forex.
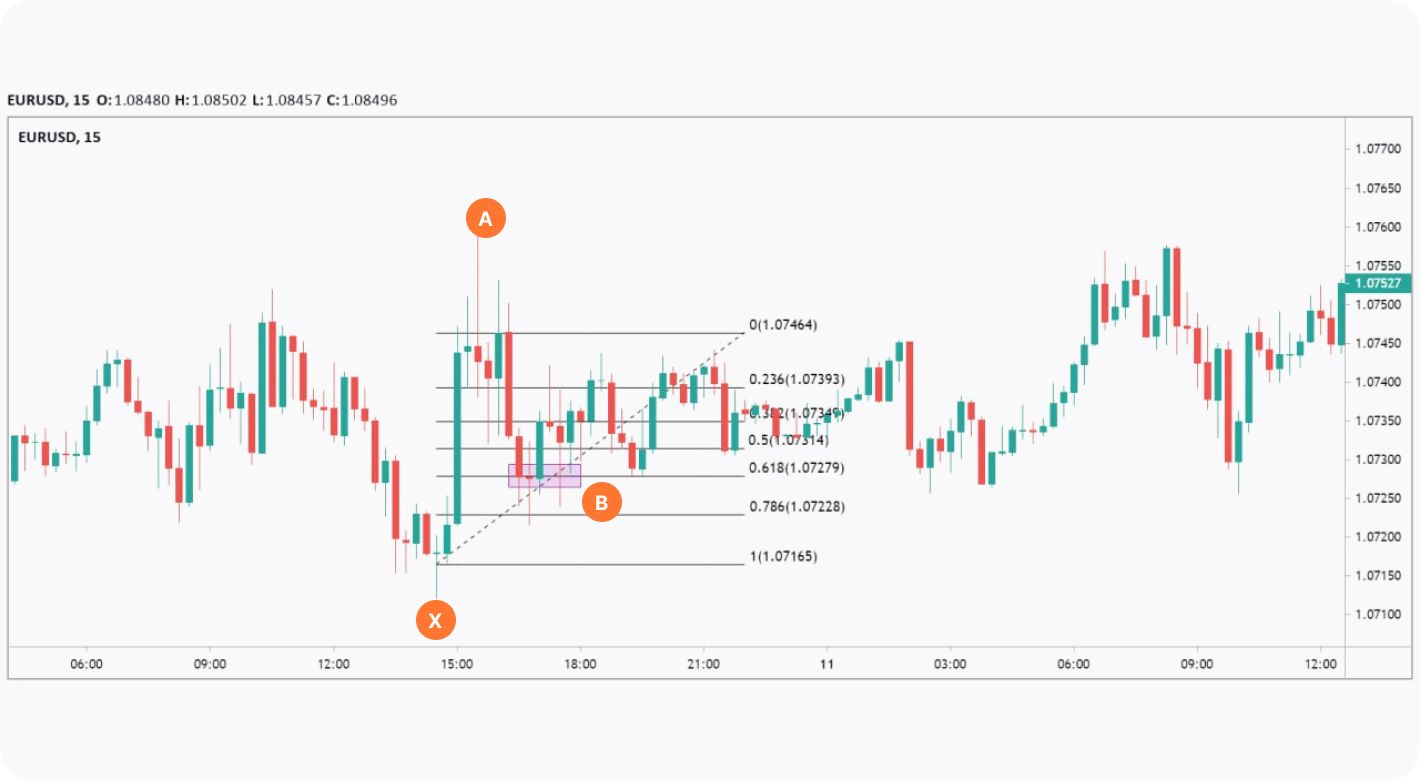
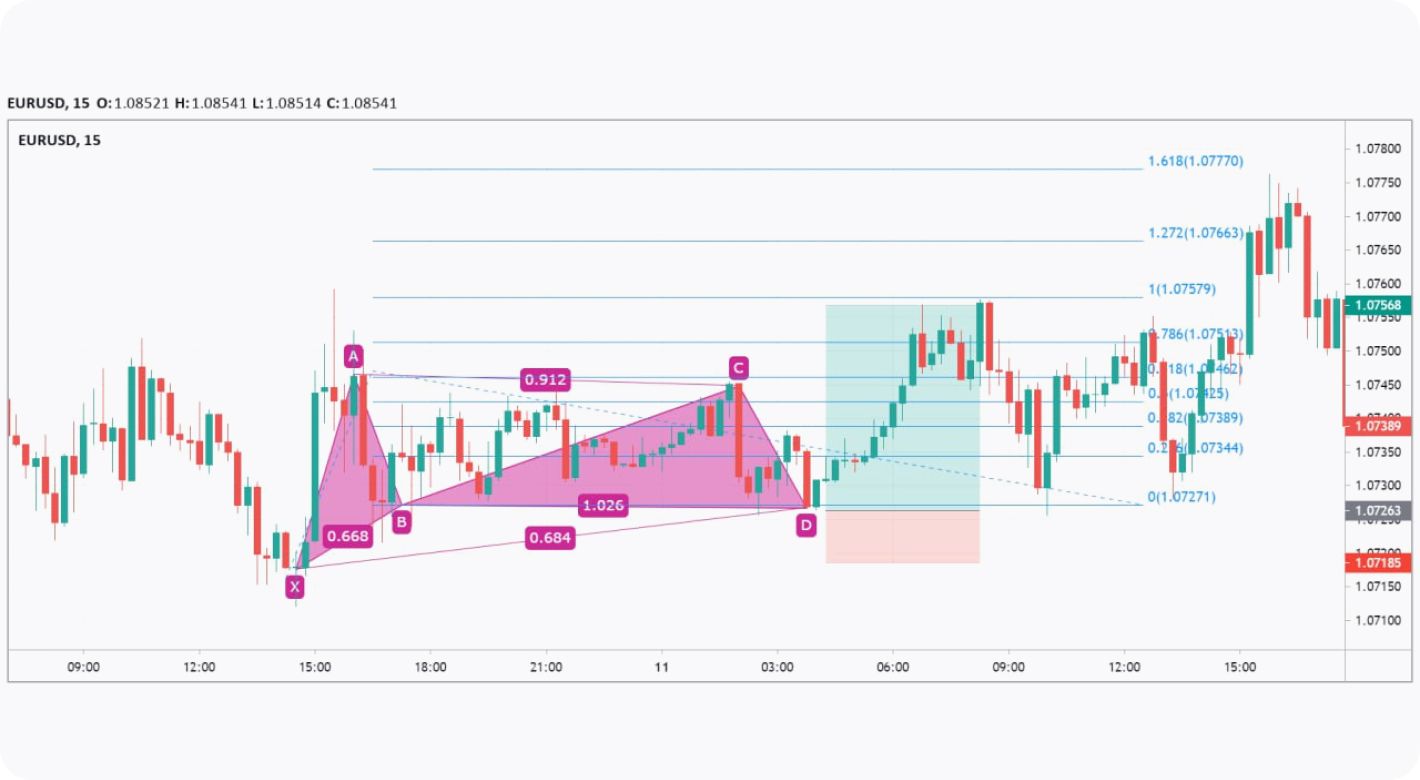
On January 10th, 2023, EUR started increasing again after a period of consolidation and rose from 1.071 to 1.0795. We label this upward swing the XA leg. Then we measure the retracement of the next descending move and as it comes to 0.618 of the AB, so we validate our point B.
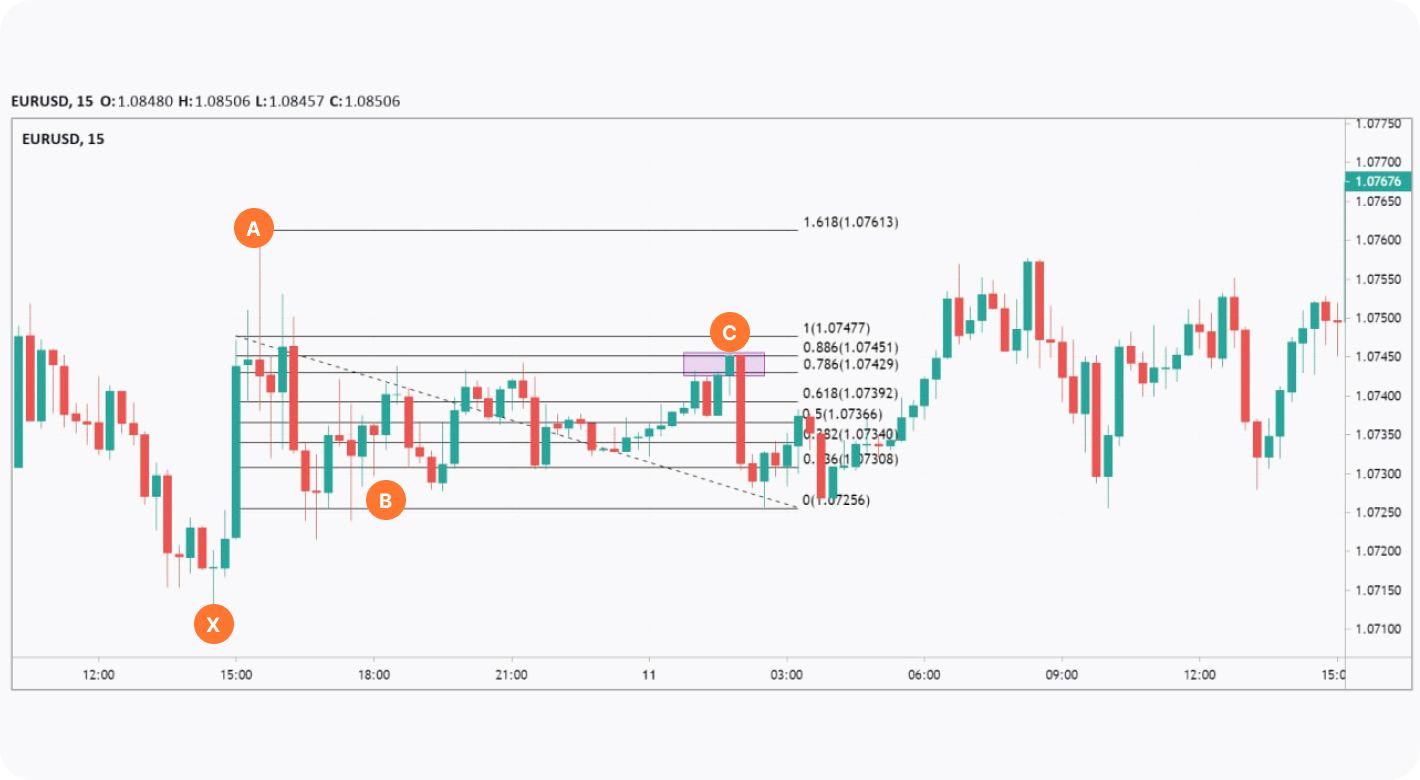
Next, we measure the Fibonacci retracement from the AB length to the next swing high in order to find point C. The 15-minute chart below shows that the point C comes between the 0.786 and the 0.886 Fib retracement level.
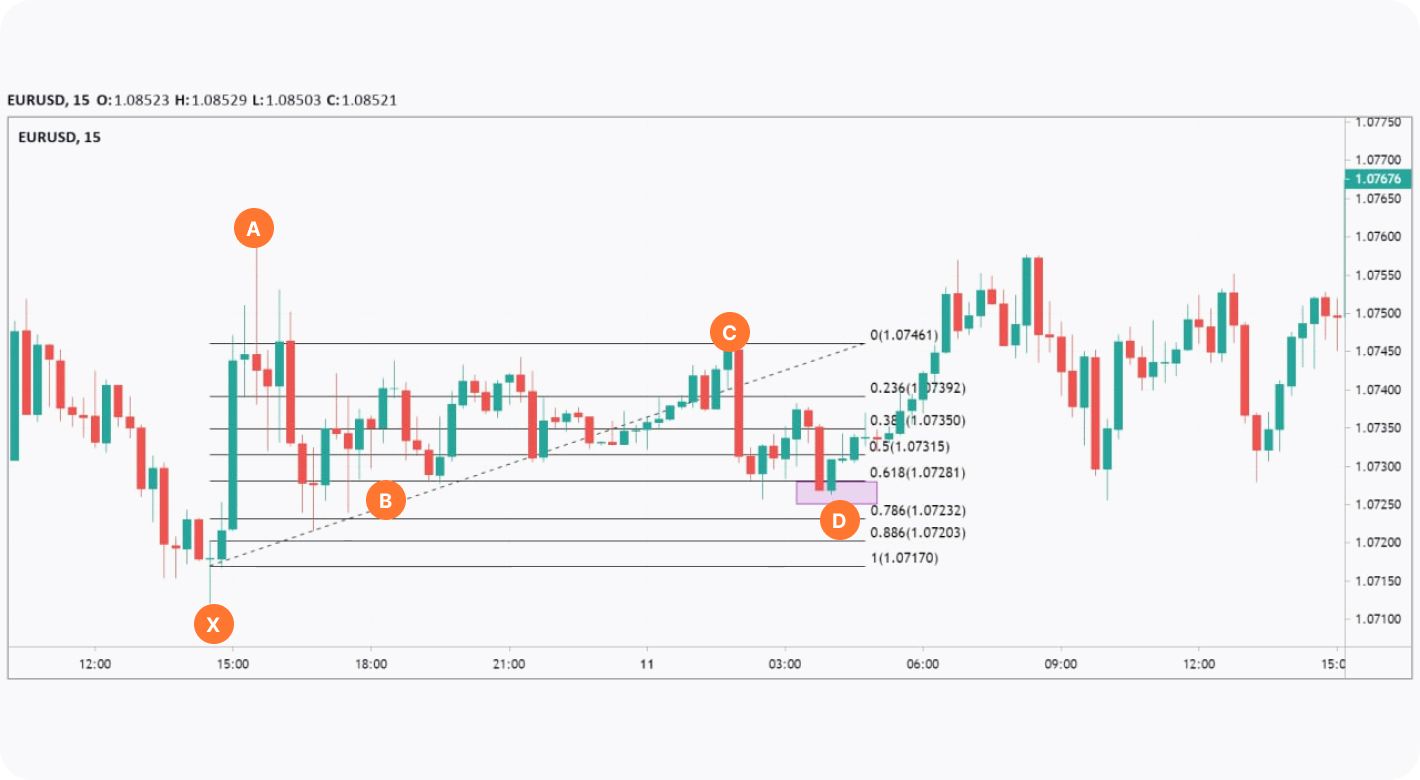
Now, all that’s left to do is to identify point D as a 61.8% or 78.6% retracement of the AX length. This was an example of a bullish Gartley.
How to Trade the Gartley
Now that we have identified the Gartley formation on a price chart, we will consider how we could open real trades.
The Gartley pattern rules mean entering the market at around D. A stop-loss level may be placed below D in a bullish formation or above D in a bearish formation on either some of the Fibonacci levels or at the X at maximum. The take-profit target varies. Traders may set it on C in a conservative approach or on a higher high compared to swing A since a trend is expected to continue. A riskier approach is to place the take-profit order at Fibonacci levels above a higher high after point A.
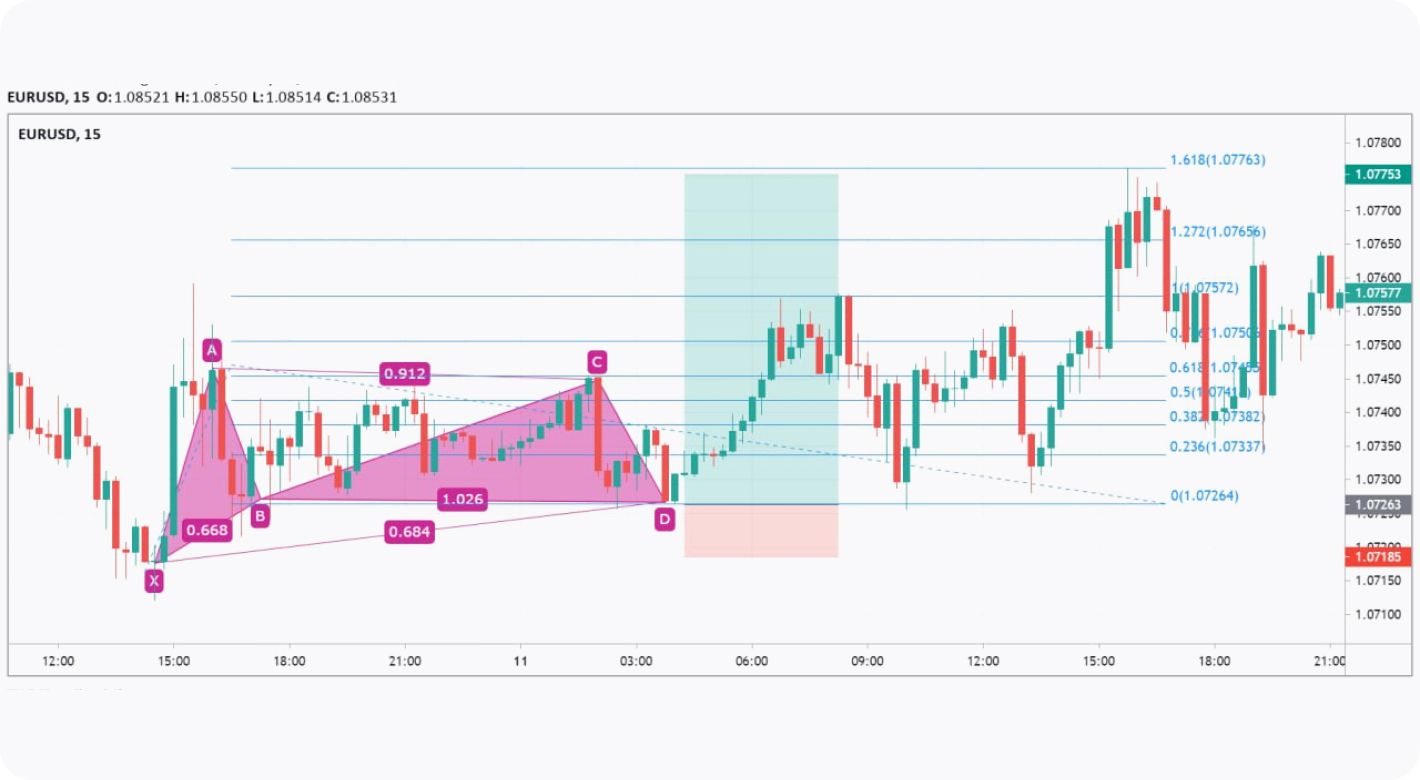
Using these rules we come up with the long position shown on the chart below.
With our stop loss at 1.0718, our entry at 1.0726 and our target at 1.0756 our position had a risk-to-reward ratio of 3.91. The risk/reward ratio may differ as a stop loss may be tighter and the take-profit target may be more than the length of the XA leg.
If we are expecting an uptrend, the next move to the upside could have greater momentum which is why our target could be at the 1.618 Fibonacci extension of the XA length, coming up with a RR of 6.28.
Takeaway
Having a wide range of trading tools and strategies at your disposal may increase your trading success rate. Although harmonic patterns seem complicated, they are common trading tools. To become better in harmonic trading, you may practise on a demo account. Once you feel ready, you may start trading with it on a live account.
This article represents the opinion of the Companies operating under the FXOpen brand only. It is not to be construed as an offer, solicitation, or recommendation with respect to products and services provided by the Companies operating under the FXOpen brand, nor is it to be considered financial advice.
Stay ahead of the market!
Subscribe now to our mailing list and receive the latest market news and insights delivered directly to your inbox.

Latest articles

Weekly Market Insights with Gary Thomson: The Week of Central Banks and Earnings
In this video, we’ll explore the key economic events and market trends, shaping the financial landscape. Get ready for insights into financial markets to help you navigate the week ahead. Let’s dive in!
In this episode of Market

Intel at a Crossroads: Earnings Beat Meets Technical Resistance
Intel has just delivered its strongest quarter in over fifteen years, and the market reaction says it all. Q2 2026 revenue surged 25% year-over-year to $16.1 billion, crushing the consensus estimate of $14.42 billion, while adjusted EPS of

Tesla: Complex Range Structure Breaks Down Following Quarterly Earnings
Tesla released its Q2 2026 results after the market closed on 22 July. Revenue increased 26% year-on-year to $28.24 billion, while vehicle deliveries reached a record 480,126 units. However, operating margin fell sharply to 1.4%, down from