


Chande Kroll Stop: Definition, Calculation, and Trading Strategies
FXOpen
In the ever-changing landscape of financial markets, traders are constantly seeking effective tools to manage risk and protect their investments. The Chande Kroll Stop, a dynamic indicator, is one such tool that has gained popularity due to its ability to help traders determine optimal stop loss locations. In this article, we will delve into the Chande Kroll Stop, exploring its definition, formula, and application.
What Is the Chande Kroll Stop?
The Chande Kroll stop is a technical analysis indicator that is used to determine the optimal placement of a stop-loss order. It was developed by Tushar Chande and Stanley Kroll, two highly-respected figures in trading in the mid-90s, and is grounded in the idea of volatility.
By taking into account the current price, market volatility, and the security's average true range (ATR), the indicator calculates an appropriate stop-loss level that moves in tandem with the security's price. It’s plotted as two lines that help traders determine their stop losses, regardless of whether they go long or short. It is applicable to virtually every asset class – traders can use the Chande Kroll Stop for forex, commodities, stocks, and cryptocurrencies*.
Calculation of Chande Kroll Stop
The Chande Kroll encompasses three key components: the average true range (ATR), the multiplier, and the current price of the security
- ATR: The ATR is a volatility measure calculated by averaging the true ranges over a specific timeframe. The true range is determined by finding the maximum of the following:
- The range between the high and low of the current period.
- The difference between the close of the previous period and the high of the current period.
- The difference between the close of the previous period and the low of the current period.
- Multiplier: The multiplier adjusts the ATR and is typically set between 1 and 3, depending on the trader's risk tolerance.
- Price: The current price of the security being analysed.
The Chande Kroll Stop formula is as follows:
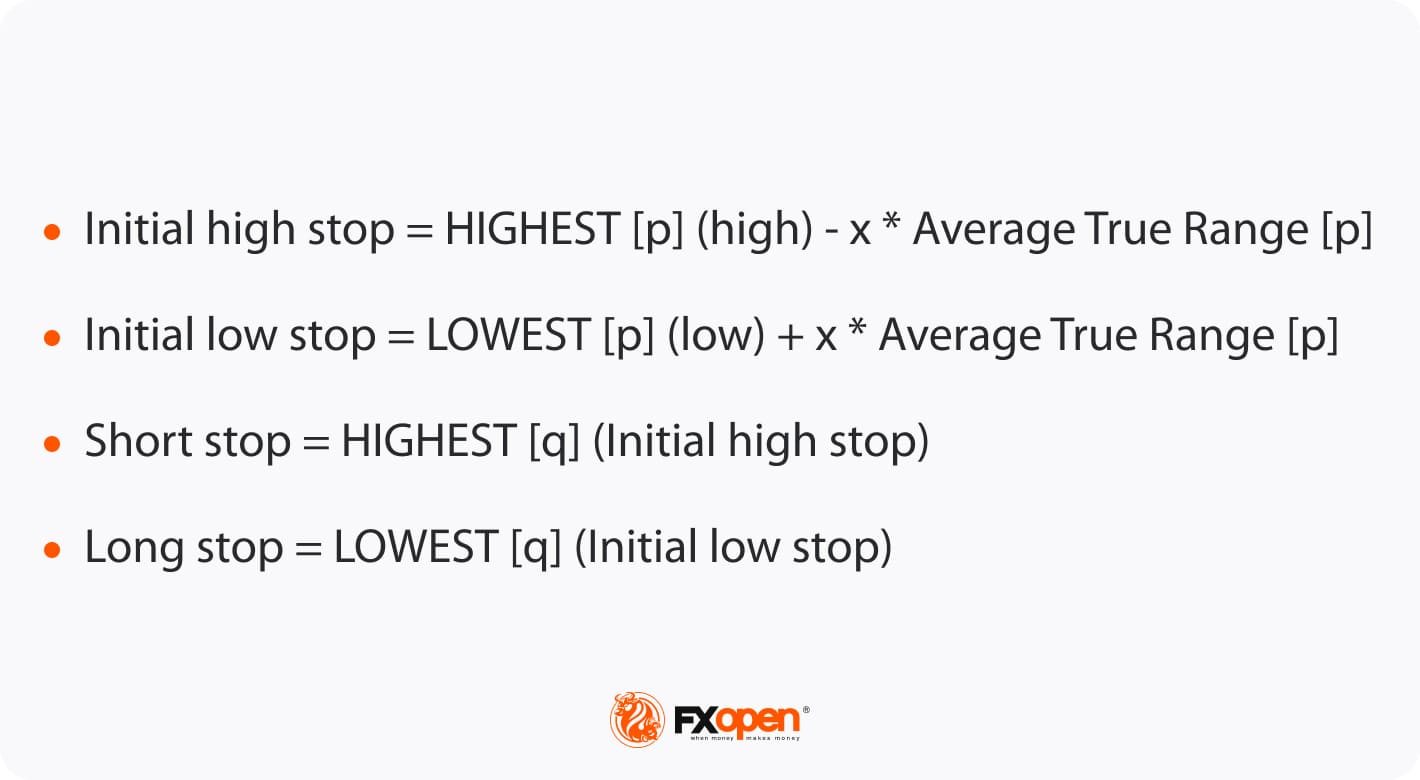
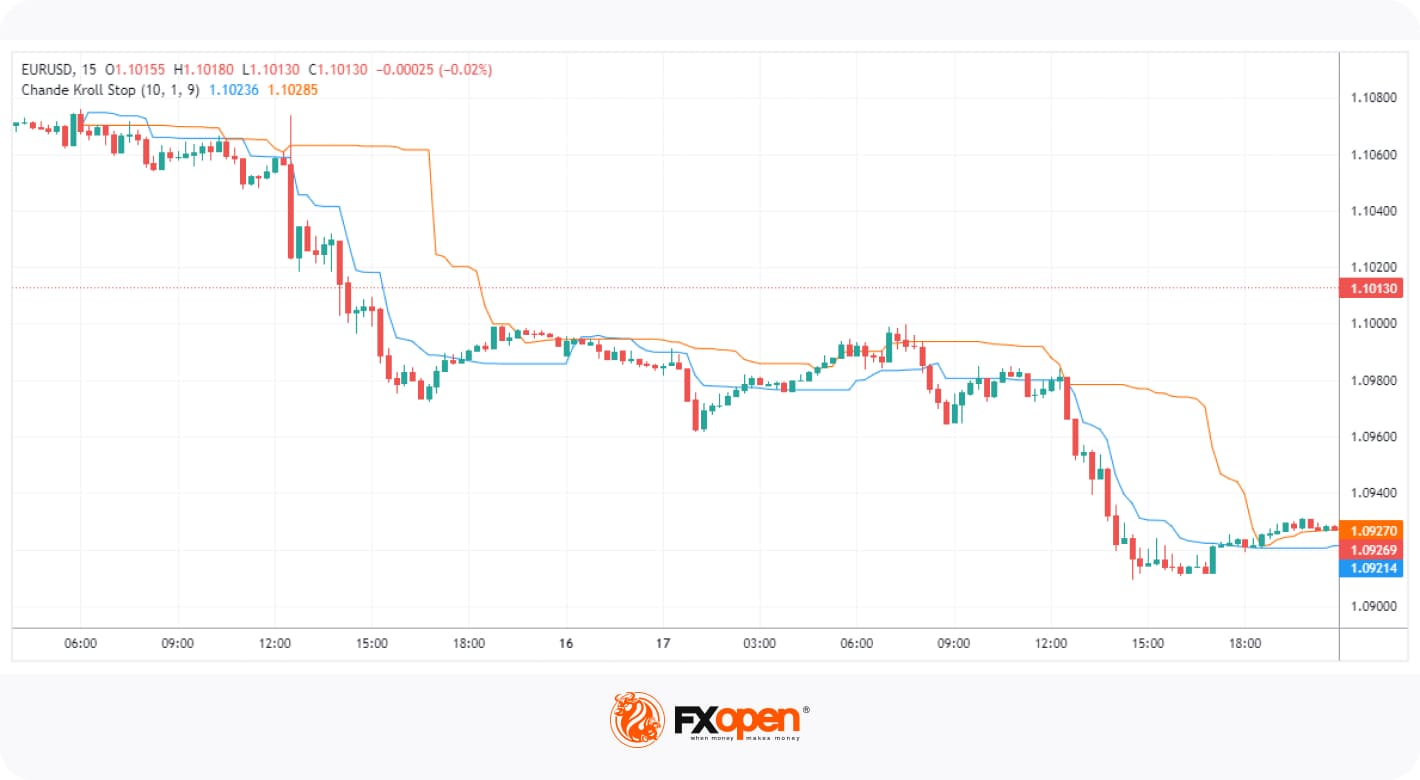
This calculation produces two stop-loss levels, typically a red (or orange) and green (or blue) line. The stop-loss may be placed below the green line for a long position, while it could be placed above the red line for a short position.
So what are the three numbers for the Chande Kroll stop? The ATR’s current period is denoted by the letter P (10 by default), while X represents the ATR multiplier (1 by default). Q is the lookback period for updating the indicator lines; its initial value, 9, means that the indicator will adapt to the highest and lowest values of the short-stop and long-stop lines, respectively, across the previous 9 bars.
However, there’s no need to perform these calculations yourself. In FXOpen’s free TickTrader platform, you’ll discover the Chande Kroll Stop alongside dozens of other tools ready to help you navigate the markets.
How to Use the Chande Kroll Stop Indicator in Trading
When learning how to read the Chande Kroll stop, there are three key areas to be aware of: setup, stop-loss implementation, and entry signals.
Setup
The first step is to adjust your Chande Kroll Stop settings to suit your risk tolerance and trading style. In essence, setting a higher period for P will widen both lines and give your positions more room to breathe, while increasing X will bring the line closer to the current price. Similarly, a lower Q value will produce a more responsive indicator that will stop you out sooner.
Stop Loss Implementation
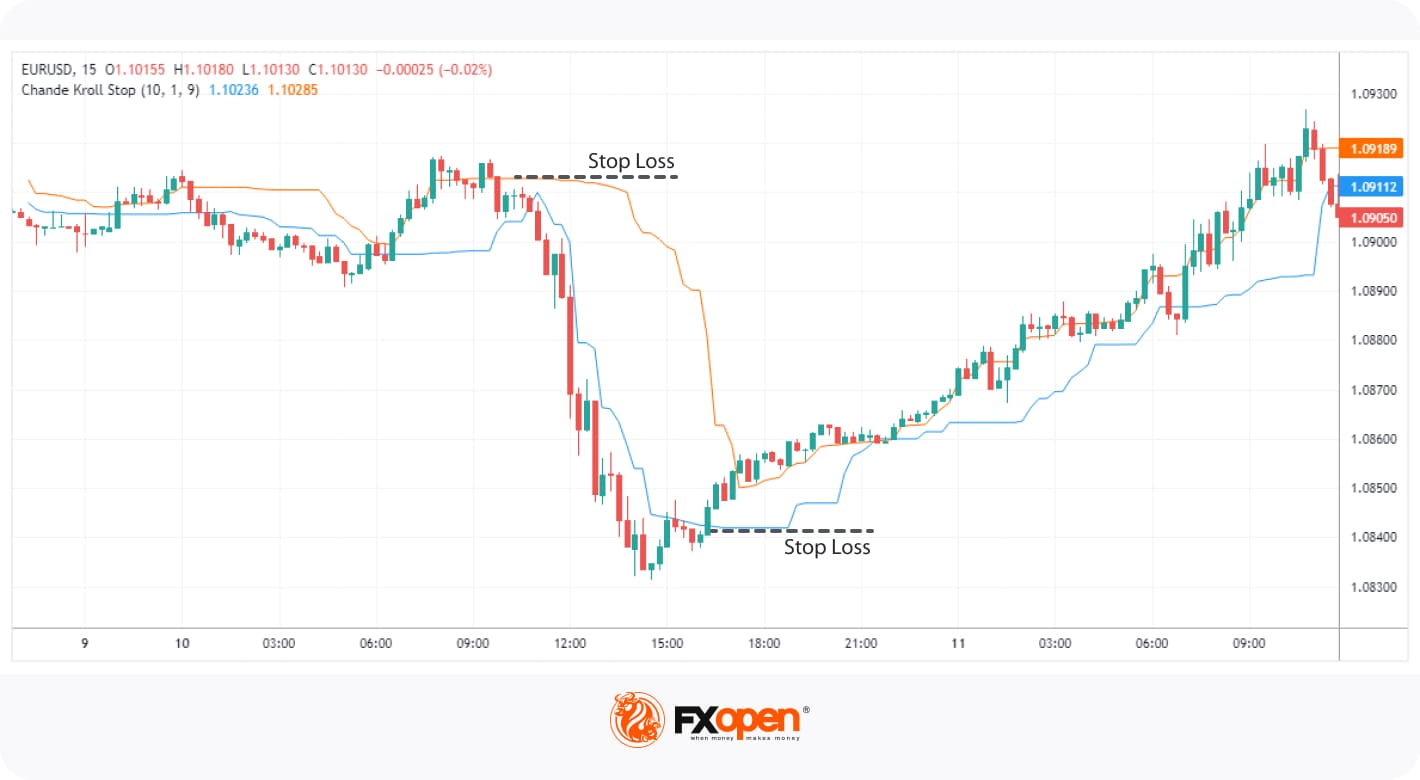
Once you have found your preferred settings and added the indicator to your chart, you can use it as a dynamic stop-loss. For a long position, you can place your order below the applicable level (blue line) and adjust it as the indicator adapts. In a short position, traders place it above the orange line.
Entry Signals
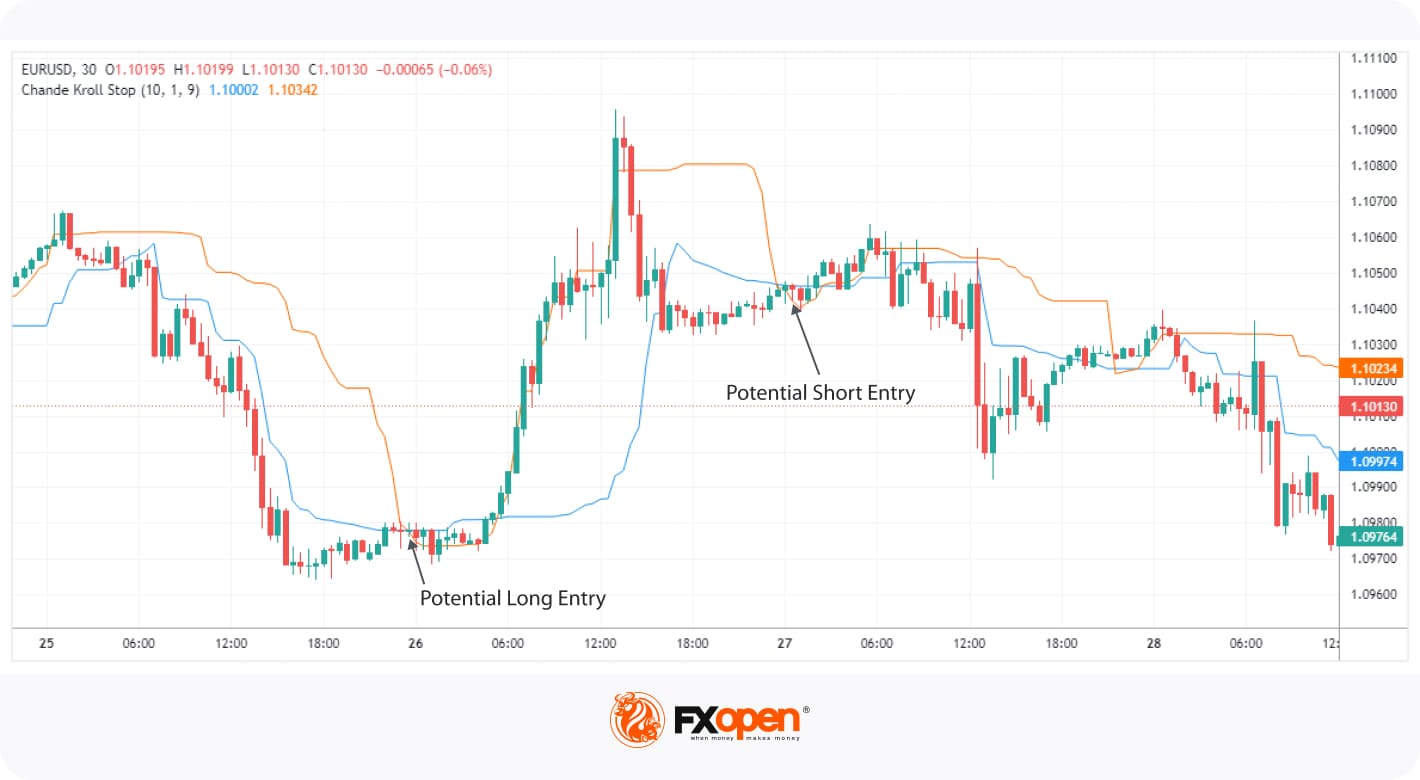
Although the Chande Kroll is primarily a stop-loss tool, it can also provide entry signals. When the long-stop line crosses above the short-stop line, it can signal that bullish momentum is entering the market. Conversely, the opposite can indicate that a short position could be opened.
Advantages and Limitations of Chande Kroll Stop Indicator
Advantages:
- The Chande Kroll Stop is a dynamic indicator that adapts when the price moves, making it a potent risk management tool.
- By taking into account market volatility, it offers protection against sudden price fluctuations, becoming particularly useful in volatile assets.
- The simplicity of Chande Kroll's calculation and application makes it accessible to traders of all experience levels.
Limitations:
- The indicator can be overly sensitive to price movements, leading to premature stop-outs and potentially missed opportunities.
- It may be less effective for assets with low volatility, which could make it unsuitable for certain trading approaches or timeframes.
- The Chande Kroll should not be used in isolation. It's best to combine it with other technical indicators and analysis techniques.
Final Thoughts
Overall, the Chande Kroll stop is a useful tool for traders looking for a dynamic stop-loss order that takes into account volatility. Now that you have a solid overview of the Chande Kroll stop and how to use it, why not consider opening an FXOpen account? You can enjoy access to over 600 markets, low-cost trading, and the confidence that comes with partnering with Traders Union’s Most Innovative Broker of 2022. Good luck!
*At FXOpen UK and FXOpen AU, Cryptocurrency CFDs are only available for trading by those clients categorised as Professional clients under FCA Rules and Professional clients under ASIC Rules, respectively. They are not available for trading by Retail clients.
This article represents the opinion of the Companies operating under the FXOpen brand only. It is not to be construed as an offer, solicitation, or recommendation with respect to products and services provided by the Companies operating under the FXOpen brand, nor is it to be considered financial advice.
Stay ahead of the market!
Subscribe now to our mailing list and receive the latest market news and insights delivered directly to your inbox.


Latest articles
EUR/GBP: June ECB Meeting Could Bring the Period of Equilibrium to an End
Fundamental backdrop
The divergence in the monetary policy paths of the ECB and the Bank of England is creating a mixed outlook for the pair. Having completed a cycle of eight consecutive rate cuts in 2025, the ECB left its

USD/CHF: Consolidation After the Trend
Fundamental Backdrop
The Swiss franc remains influenced by two opposing forces. On the one hand, there is steady demand for safe-haven assets amid tariff-related risks stemming from the United States. On the other, the policy stance of the Swiss National

FTSE 100: Correction Has Ended, but a New Impulse Has Yet to Form
Fundamental backdrop
The UK inflation report for April, published on 20 May, delivered unexpectedly positive figures: annual inflation slowed to 2.8% in April 2026 from 3.3% in March, coming in below the consensus forecast of 3.0% and