


How to Use the Fisher Transform Indicator
FXOpen
Navigating the ever-changing landscape of financial markets can be a daunting task, even for seasoned traders. However, there are tools that can help. One such example is the Fisher Transform indicator, a tool known for its ability to predict trend reversals. In this article, we’ll explore how the Fisher Transform works, how it’s applied to trading strategies, and the best indicators to combine it with.
What Is the Fisher Transform Indicator?
The Fisher Transform (FT) indicator is a versatile technical analysis tool used to pinpoint potential trend reversals across financial markets. By operating under the assumption that prices gravitate towards a normal distribution over time, the Fisher Transform uses a mathematical algorithm to transform input data into a Gaussian normal distribution. This process allows traders to identify extreme price movements that may be likely to reverse.
Applicable to various financial instruments, including stocks, currencies, and commodities, the FT harnesses the power of statistics to produce effective results. To optimise its signals, the indicator is frequently used alongside other technical analysis tools, such as moving averages, trend lines, and support and resistance levels.
How to Calculate the Fisher Transform
The Fisher Transform uses a relatively complex mathematical algorithm that transforms any input data into a Gaussian normal distribution. It can be calculated using the following Fisher Transform formula:
Fisher Transform = 0.5 * ln[(1 + X) / (1 - X)]
Where X is the input data, which can be any financial instrument, such as the closing price of a stock or the exchange rate of a currency, and In is the natural logarithm.
Once the FT is calculated, it’s plotted on the chart with two lines: the Fisher Transform and a moving average signal line. It’s possible to change the lookback period, although the default 9 periods are often suitable.
You don’t need to worry about performing this calculation yourself. In FXOpen’s free TickTrader platform, you’ll discover a wide range of indicators and tools, including the Fisher Transform, ready to be used.
Interpreting Fisher Transform Signals
The Fisher Transform indicator is a powerful tool for identifying potential trend reversals in financial markets. To make the most of the FT, it's crucial to understand how to interpret its signals. Let’s examine some of them.
Crossovers
The Fisher Transform indicator generates two types of crossovers: signal line crossovers and zero line crossovers.
Signal Line Crossovers

The signal line is a simple moving average of the FT values over a specified period. Crossovers between the FT and the signal line can indicate trend reversals, providing actionable insights for traders.
Bullish Crossover: When the Fisher Transform crosses above the signal line, it suggests a potential bullish reversal, indicating a favourable time to consider buying the asset.
Bearish Crossover: Conversely, when the FT crosses below the signal line, it indicates a potential bearish reversal, demonstrating an opportunity to sell the asset.
These crossovers are usually most effective when they occur outside of the normal distribution range of 1/-1 and especially beyond 1.5/-1.5.
Zero Line Crossovers
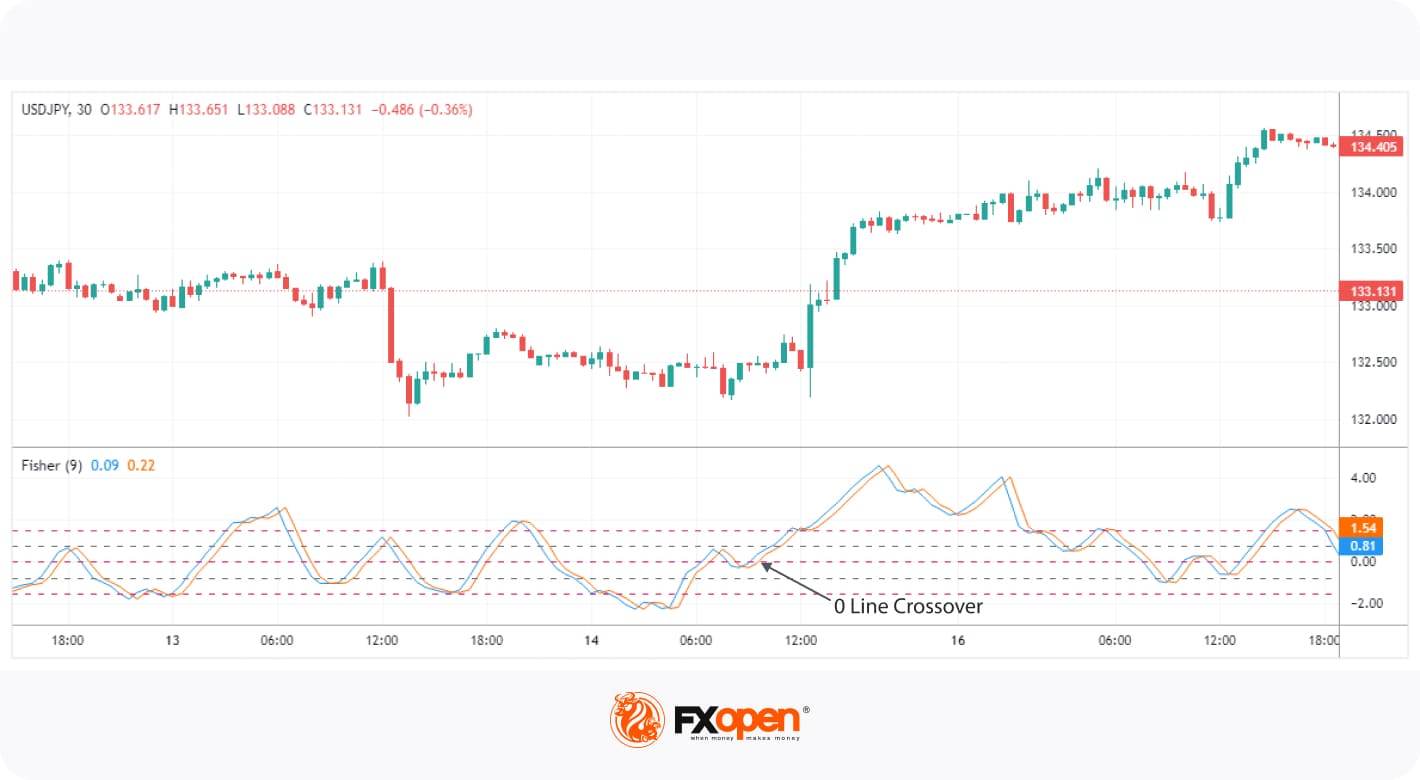
Zero line crossovers occur when the FT crosses the midpoint, which itself represents an area of trend neutrality. This can help traders predict an upcoming trend.
Bullish Zero Line Crossover: When the FT crosses above the zero line, it signifies a possible shift from a bearish to a bullish trend, which may present a buying opportunity.
Bearish Zero Line Crossover: Conversely, when the FT crosses below the zero line, it implies a potential shift from a bullish to a bearish trend, suggesting that it might be time to sell the asset.
These moves are less reliable than the aforementioned crossovers since the indicator will frequently fluctuate around the zero line. Here, it’s best to combine the FT with other technical tools to avoid confusion.
Divergences
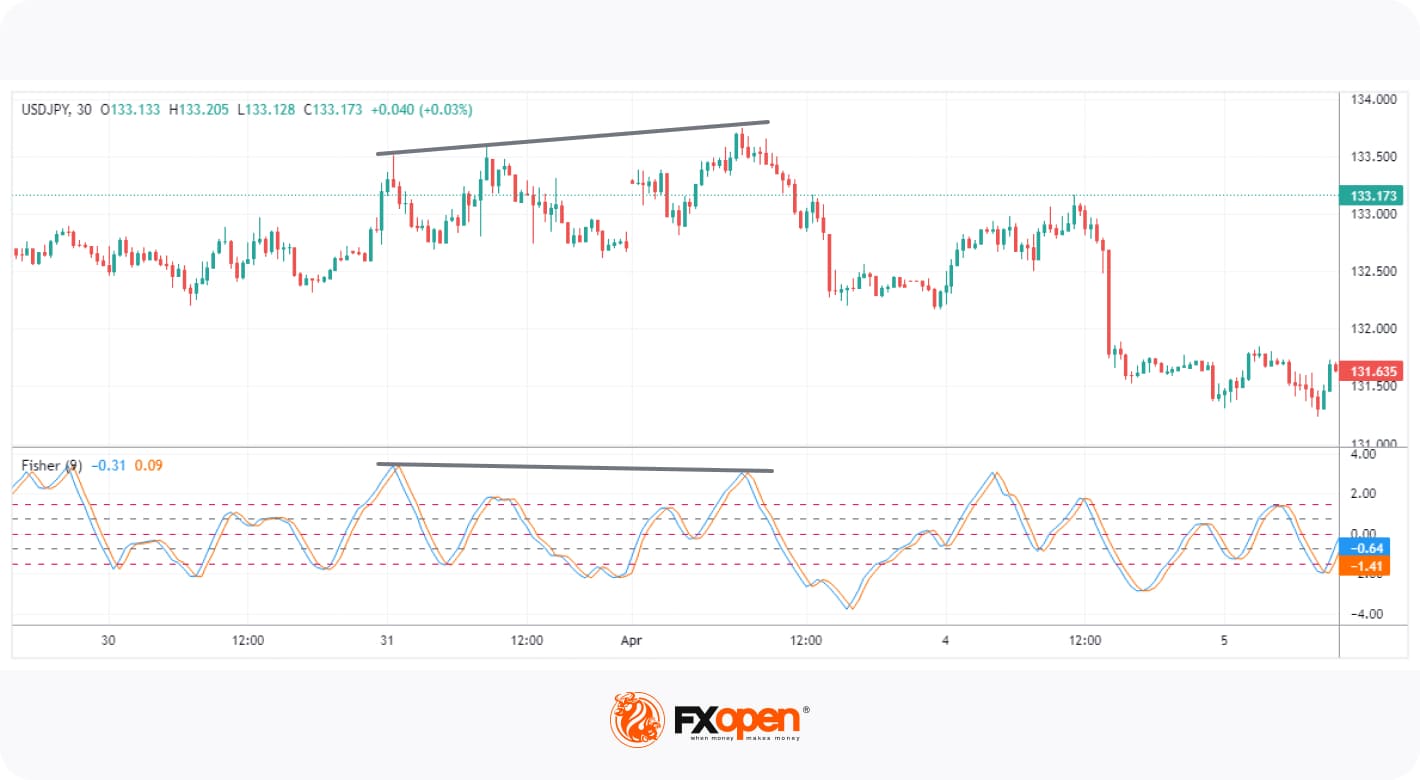
Divergence analysis is another vital component of interpreting Fisher Transform signals. A divergence occurs when the price of an asset and the FT move in opposite directions, highlighting a potential trend change.
A bullish divergence arises when the price of an asset forms a lower low while the FT forms a higher low. This suggests that the downward trend may be losing momentum, and that a reversal to the upside could be imminent. Conversely, a bearish divergence occurs when the price of an asset forms a higher high, but the FT forms a lower high. This indicates that the upward trend may be weakening, and a reversal to the downside might follow.
How to Combine the Fisher Transform with Other Indicators
One potential drawback of the Fisher Transform indicator is that it can be prone to false signals during periods of low volatility. During these periods, the FT may fluctuate around the zero line, making it difficult to identify potential trend reversals. Traders may want to consider using additional indicators or strategies during these periods to confirm their trades.
Here are some examples of how the Fisher Transform indicator can be combined with different indicators:
- Relative Strength Index (RSI): As a momentum oscillator, the RSI gauges the strength of an asset's price action. Overbought or oversold RSI readings may indicate potential price reversals. The FT can be employed to confirm these signals. For instance, when the RSI is overbought, and the Fisher Transform crosses below its signal line, a bearish reversal may be due.
- Bollinger Bands: Serving as a volatility indicator, Bollinger Bands can help identify potential trend reversals. When an asset's price touches the upper or lower Bollinger Band, it may suggest overbought or oversold conditions. The FT can be used to confirm these conditions. For example, when an asset's price reaches the upper Bollinger Band and the FT crosses below its signal line, a potential bearish reversal may be indicated.
- Fibonacci Retracement Levels: Widely used in technical analysis, Fibonacci retracement levels help identify potential support and resistance. The FT can confirm these levels by providing additional insights. When an asset's price reaches a Fibonacci retracement level, and the Fisher Transform crosses above its signal line, it could demonstrate a bullish reversal is inbound.
Final Thoughts
Now that you have a solid overview of how to use the Fisher Transform indicator in trading, why not consider opening an FXOpen account? You’ll be able to put your newfound knowledge to good use across 600+ markets and benefit from low trading costs, ultra-fast execution speeds, and a partnership with Traders Union’s Most Innovative Broker of 2022. Happy trading!
This article represents the opinion of the Companies operating under the FXOpen brand only. It is not to be construed as an offer, solicitation, or recommendation with respect to products and services provided by the Companies operating under the FXOpen brand, nor is it to be considered financial advice.
Stay ahead of the market!
Subscribe now to our mailing list and receive the latest market news and insights delivered directly to your inbox.


Latest articles

Weekly Market Insights with Gary Thomson: US Inflation, UK GDP, Chair Warsh Testimony, and Earnings
In this video, we’ll explore the key economic events and market trends, shaping the financial landscape. Get ready for insights into financial markets to help you navigate the week ahead. Let’s dive in!
In this episode of Market

GBP/AUD Analysis: The Tug-of-War Begins
Oil is back in the driver's seat, and both the pound and the aussie are feeling its grip. The Bank of England held rates at 3.75% in June, but with UK inflation at 2.8% and crude oil climbing

Australian Dollar Holds Above the Current Market Profile
The minutes from the Reserve Bank of Australia's (RBA) June meeting, released on 30 June, suggested that policymakers are not yet ready to rule out further policy tightening. Board members noted persistent excess demand and broad-based inflationary pressures across the