


Market Analysis: The Price of Brent Oil Approaching the Highs of the Year
FXOpen

The price is driven up by:
→ the policy of limiting oil production by OPEC+ countries. For example, Saudi Arabia last week announced a cut in production by 1 million barrels per day until the end of September, adding that the decision could be extended. Russia is also reducing production volumes. We wrote about the scenario of increasing growth in the price of Brent oil due to production cuts in a post dated July 7;
→ hopes/rumors that the Chinese authorities will stimulate the economy, which is not recovering enough after the lifting of COVID-related restrictions.
Selling pressure is driven by:
→ raising rates by Western central banks to fight high inflation.
Under the influence of these and other factors, the price of Brent oil rose close to the highs of the year around USD 87 per barrel, forming an upward channel. At the same time, in August, the price bounced strongly from its lower border twice, indicating the strength of demand. On the other hand, the progress of the bulls in the formation of the August high is very small, if you compare this peak with the previous one, set on the 2nd of August — a sign of the exhaustion of the bullish momentum.
It is reasonable to assume that the market can find a balance at current levels, and the price will enter the consolidation range, as holders of long positions can take profits after the increase in the price of Brent oil by more than 14% since July 1. At the same time, false breakdowns of the high of the year are not ruled out.
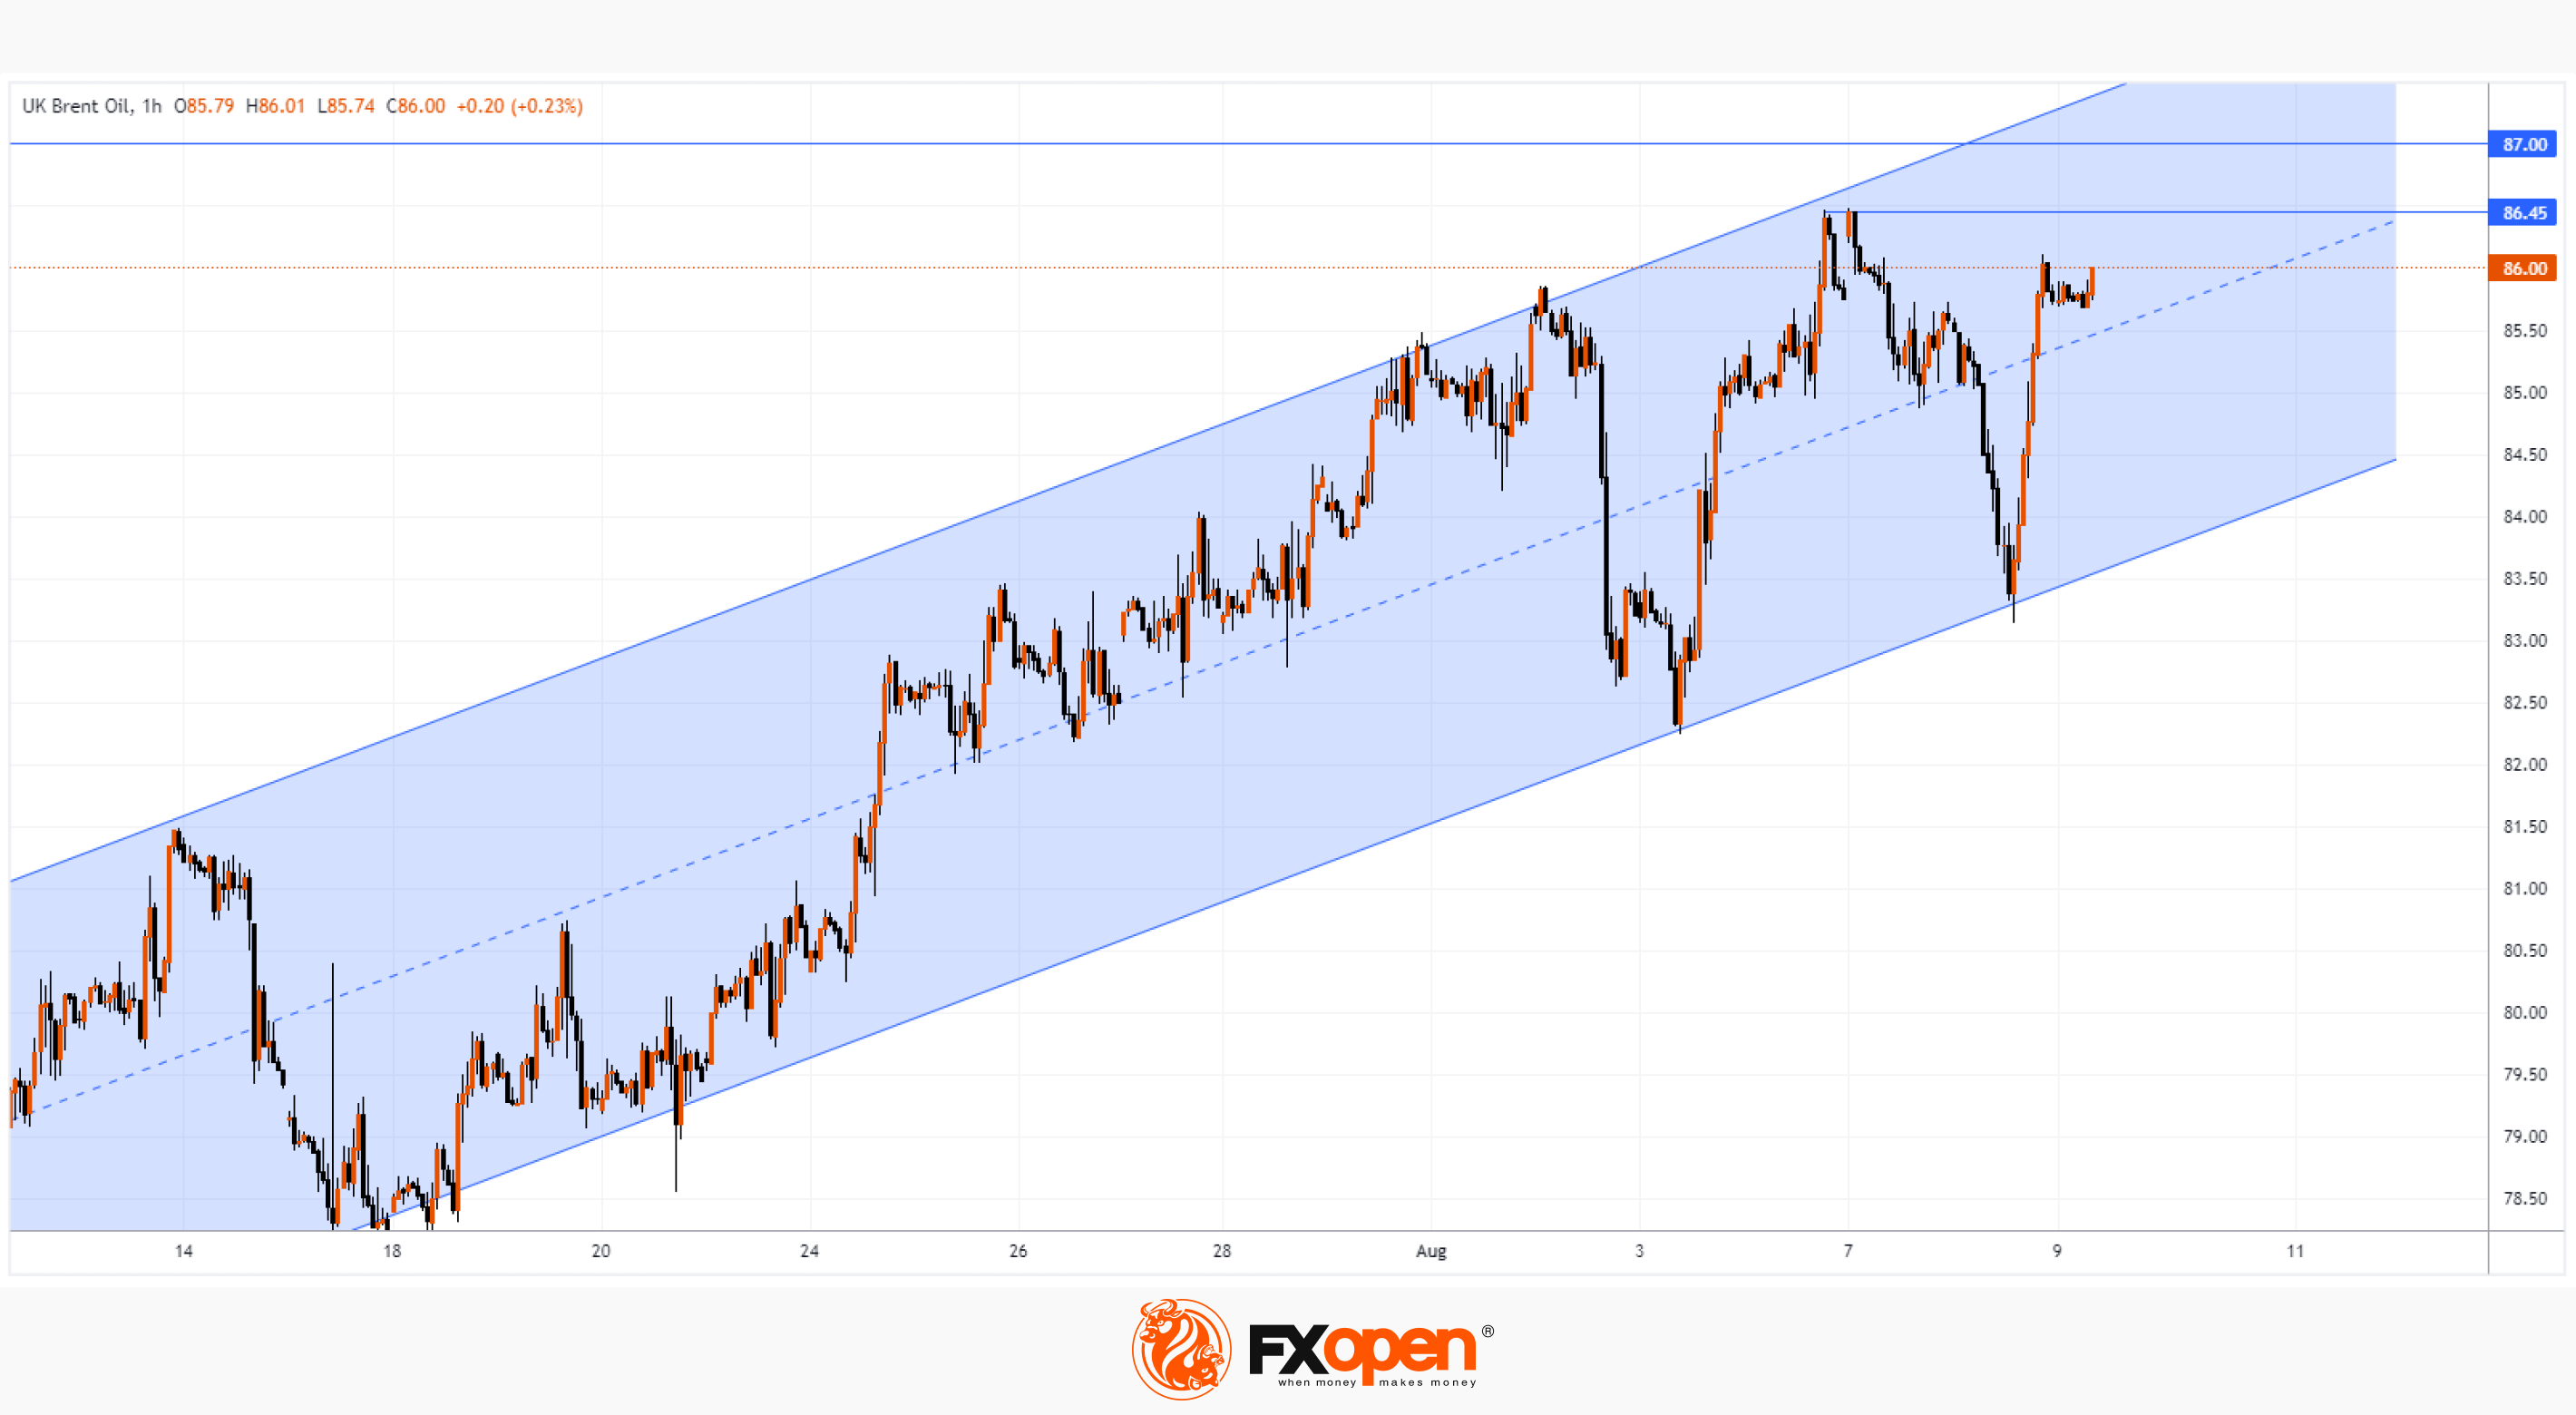
Important levels:
→ USD 87.15 – resistance of the high of the year;
→ USD 86.45 – resistance from August high;
→ borders of the ascending channel.
Start trading commodity CFDs with tight spreads (additional fees may apply). Open your trading account now or learn more about trading commodity CFDs with FXOpen.
This article represents the opinion of the Companies operating under the FXOpen brand only. It is not to be construed as an offer, solicitation, or recommendation with respect to products and services provided by the Companies operating under the FXOpen brand, nor is it to be considered financial advice.
Stay ahead of the market!
Subscribe now to our mailing list and receive the latest market news and insights delivered directly to your inbox.


Latest articles

AI Valuations Are Back in the Spotlight
Artificial intelligence remains the dominant investment theme of 2026, but investors are increasingly questioning whether AI stock valuations are keeping pace with reality.
💰 Big Tech continues to invest at an unprecedented scale, with hyperscaler AI spending projected to exceed $800

AUD/CAD: Months of Indecision — Is a Breakout Finally Coming?
The Australian dollar has clawed back most of its end-of-June losses, when it touched three-month lows against the greenback amid escalating Middle East tensions. Since then, sentiment has improved: the RBA's Assistant Governor Sarah Hunter signalled the board stands ready

USD/JPY: Battling at the Top of the Triangle
On 3 July, Japan's Finance Minister, Satsuki Katayama, stated that the Ministry of Finance remains in close contact with US authorities regarding developments in USD/JPY as the yen traded near its weakest level in almost 40 years. Similar verbal