


Market Analysis: Results of the OPEC+ Meeting
FXOpen
The OPEC+ meeting was held this week. CNBC reports the words of its head, Haitham al-Ghais, here’s a brief summary:
→ the organization (which currently consists of 13 countries) is looking for new members;
→ the macroeconomic situation is unclear due to the banking crisis, high inflation, the possibility of a recession and new outbreaks of COVID;
→ nevertheless, the organization is positive about the demand for oil in the second half of 2023.
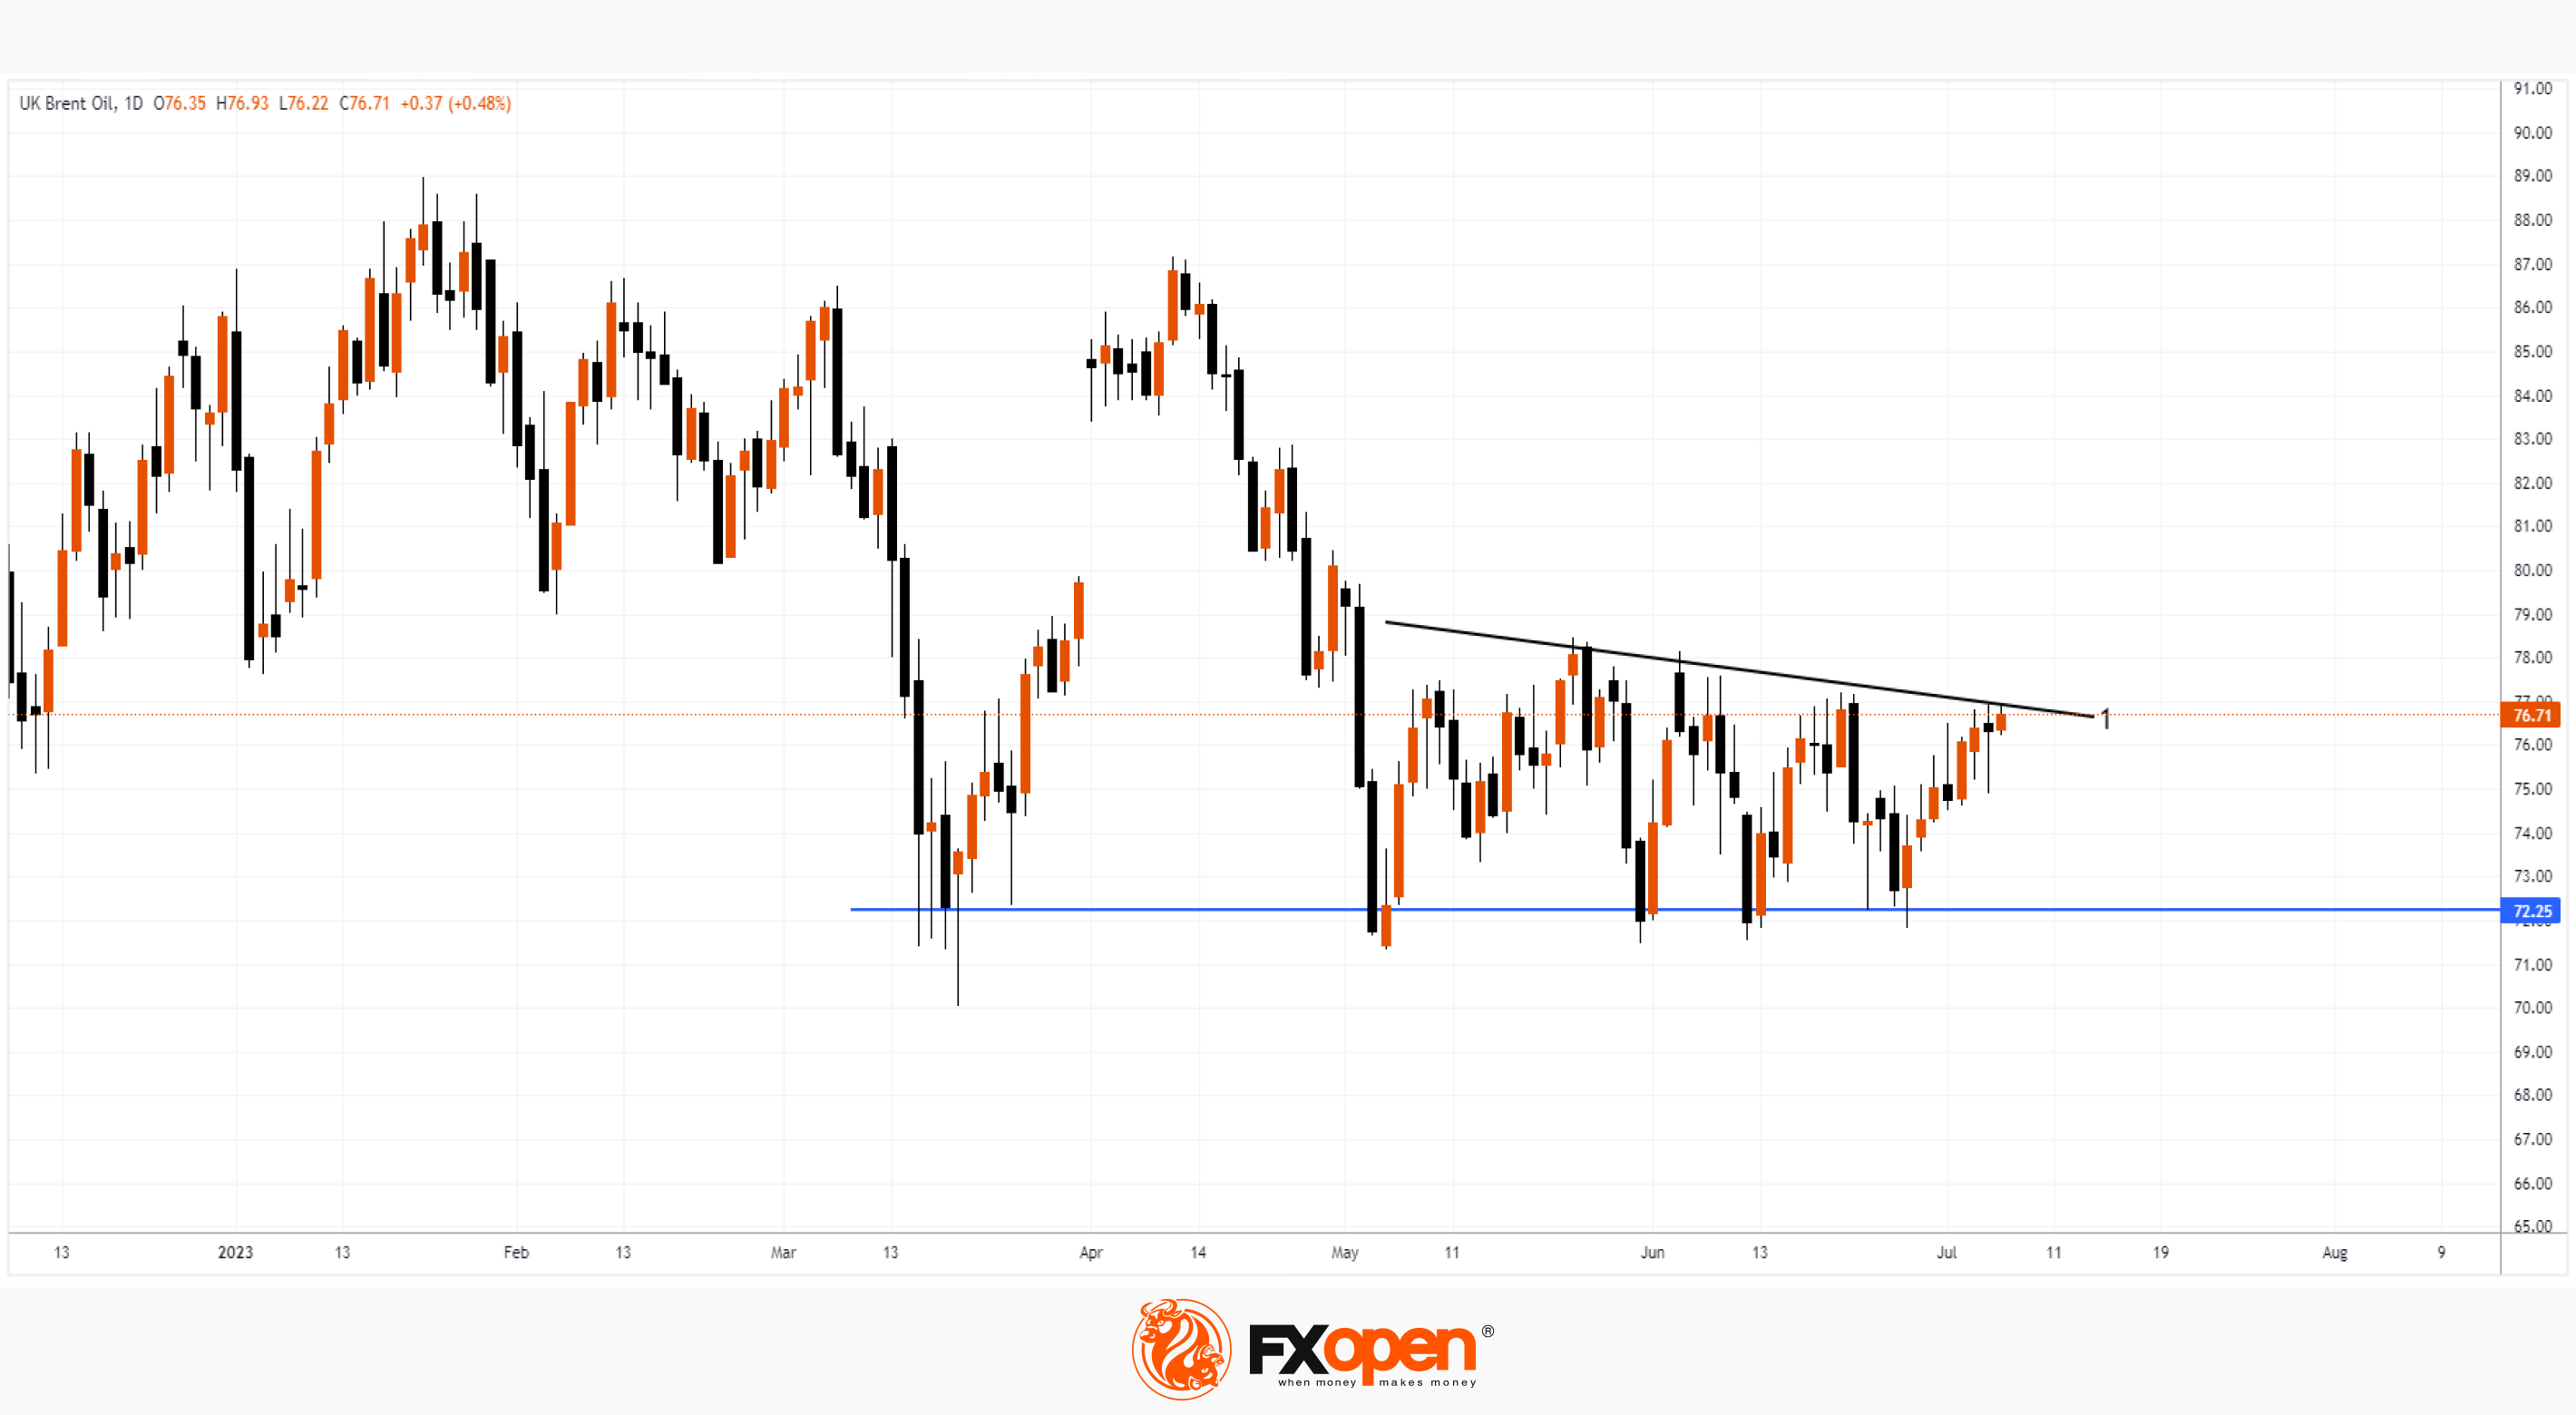
Judging by the fact that no sharp statements were made, OPEC members are satisfied with the current situation. The oil price chart shows that the level of 72.25 in June confirmed its support for the market. It may be based on the decisions of OPEC to reduce production volumes when prices fall to these levels.
It can be stated that the market has been in the consolidation stage for 2 months already. But with strong support from OPEC, the bulls may try to break through the current resistance level (1).
Start trading commodity CFDs with tight spreads (additional fees may apply). Open your trading account now or learn more about trading commodity CFDs with FXOpen.
This article represents the opinion of the Companies operating under the FXOpen brand only. It is not to be construed as an offer, solicitation, or recommendation with respect to products and services provided by the Companies operating under the FXOpen brand, nor is it to be considered financial advice.
Stay ahead of the market!
Subscribe now to our mailing list and receive the latest market news and insights delivered directly to your inbox.


Latest articles

USD/JPY: Battling at the Top of the Triangle
On 3 July, Japan's Finance Minister, Satsuki Katayama, stated that the Ministry of Finance remains in close contact with US authorities regarding developments in USD/JPY as the yen traded near its weakest level in almost 40 years. Similar verbal

Dow Jones (DJIA): Consolidation Beyond the Trend
Federal Reserve Chair Kevin Warsh testified before Congress on 14–15 July, reaffirming the Fed's commitment to bringing inflation back to target while providing no clear guidance on the future path of interest rates. Meanwhile, June inflation data came in

European Currencies Strengthen Ahead of Key Macroeconomic Releases
EUR/USD and GBP/USD continue to recover moderately following the recent weakening of the US dollar. European currencies have been supported by expectations that US inflationary pressures will continue to ease after softer-than-expected CPI and PPI data, reinforcing market