


Netflix (NFLX) Shares Reach a Two-Month High
FXOpen
As shown on the daily chart of Netflix (NFLX) shares, the price surpassed the July 19 peak around $677 on Friday but closed well below the day’s highs. Notably:
→ Since August 5, Netflix (NFLX) has outperformed stock indices;
→ The stock has risen by about 15% from the August 5 close.
Will the rally continue?
Bullish argument:
→ Analysts expect an improvement in the company’s fundamentals following enhancements to its business model. According to Zacks, Netflix might report earnings of $5.07 per share for the current quarter, representing a year-on-year increase of +35.9%. The Zacks consensus estimate has risen by +7.9% over the past 30 days.
Bearish argument:
According to SEC filings, Netflix’s Chief Legal Officer sold $7 million worth of shares. Could this sale be motivated by insider information that might lead to a decline in the stock price?
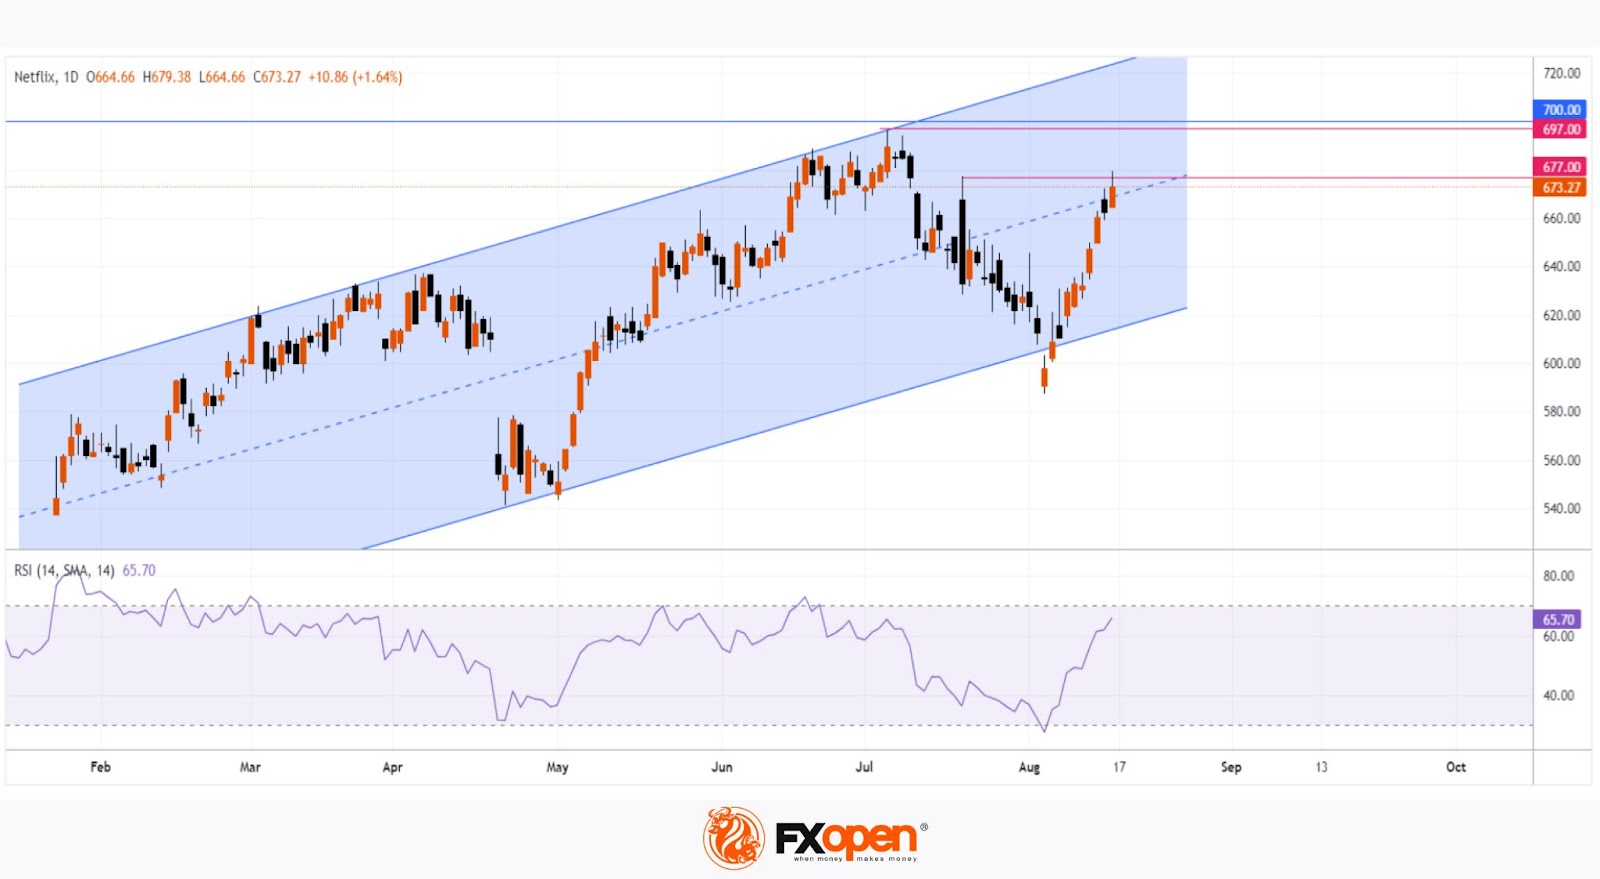
Technical analysis of the Netflix (NFLX) daily chart indicates that the price is moving within an ascending channel (shown in blue), and the sharp rise from the August 5 low has pushed the RSI indicator from the oversold zone to the brink of the overbought zone. However, resistance levels have come into focus:
→ The median of the ascending channel;
→ The peak around $697;
→ The psychological resistance around $700.
Given Friday’s weak close and the sharp rise over the past two weeks, it’s reasonable to suggest that Netflix (NFLX) shares are vulnerable to a correction.
The average price forecast for Netflix (NFLX) is $704.94 over the next 12 months (according to a survey of analysts conducted by TipRanks).
Buy and sell stocks of the world's biggest publicly-listed companies with CFDs on FXOpen’s trading platform. Open your FXOpen account now or learn more about trading share CFDs with FXOpen.
This article represents the opinion of the Companies operating under the FXOpen brand only. It is not to be construed as an offer, solicitation, or recommendation with respect to products and services provided by the Companies operating under the FXOpen brand, nor is it to be considered financial advice.
Stay ahead of the market!
Subscribe now to our mailing list and receive the latest market news and insights delivered directly to your inbox.


Latest articles

AI Valuations Are Back in the Spotlight
Artificial intelligence remains the dominant investment theme of 2026, but investors are increasingly questioning whether AI stock valuations are keeping pace with reality.
💰 Big Tech continues to invest at an unprecedented scale, with hyperscaler AI spending projected to exceed $800

AUD/CAD: Months of Indecision — Is a Breakout Finally Coming?
The Australian dollar has clawed back most of its end-of-June losses, when it touched three-month lows against the greenback amid escalating Middle East tensions. Since then, sentiment has improved: the RBA's Assistant Governor Sarah Hunter signalled the board stands ready

USD/JPY: Battling at the Top of the Triangle
On 3 July, Japan's Finance Minister, Satsuki Katayama, stated that the Ministry of Finance remains in close contact with US authorities regarding developments in USD/JPY as the yen traded near its weakest level in almost 40 years. Similar verbal