


FXOpen
In the realm of technical trading, seasoned traders and beginners alike often turn to indicators to gauge market momentum and potential reversals. While many are familiar with popular tools like RSI (Relative Strength Index) and MACD (Moving Average Convergence Divergence), this article takes a different route. Here, we delve into other oscillators—each with its own unique features, significance in trading strategies, and methods for interpreting signals. Once you understand these instruments, you can open an FXOpen account to try them out on the live markets, trading with tight spreads from 0.0 pips and low commissions from $1.50.
Stochastic
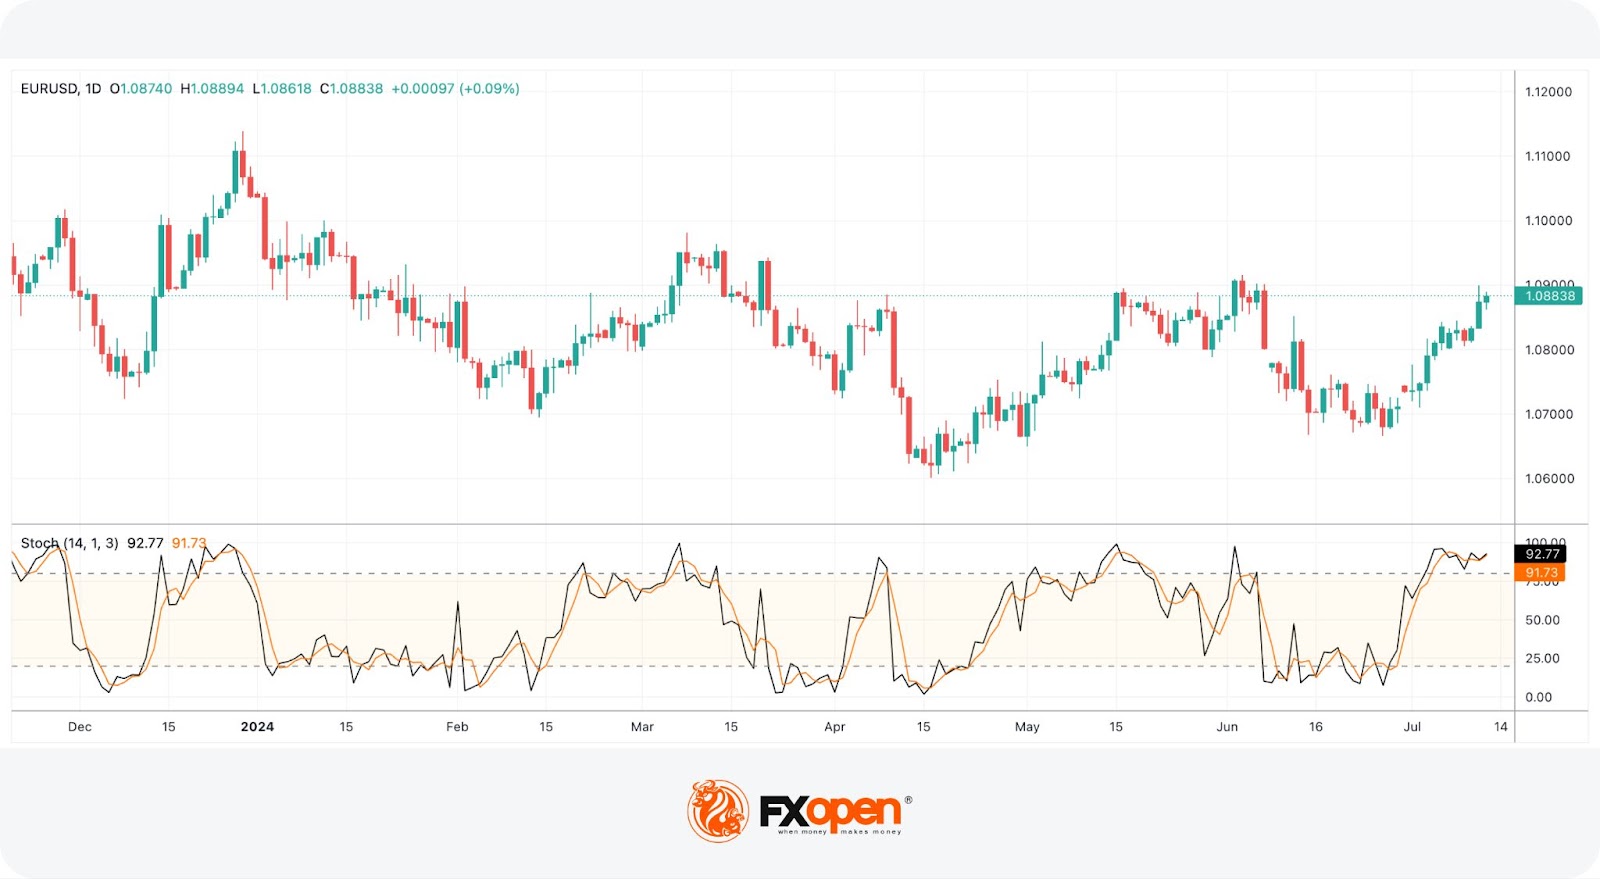
The Stochastic Oscillator, developed by Dr. George Lane in the late 1950s, serves as a momentum indicator. It identifies overbought and oversold conditions in a market and signals potential price reversals. It consists of two lines, and unlike trend-following indicators, such as moving averages, it’s placed below the chart, fluctuating between two bands (0-100).
The Stochastic is calculated based on two lines: %K and %D.
- %K is the primary line calculated using the most recent close price relative to the high and low prices over a specified period.
- %D is a 3-period simple moving average (SMA) of %K.
Its common setting is 14 periods, which means that it compares the current closing price to the highest and lowest prices over 14 periods (minutes, hours, days, etc., depending on the timeframe).
There are three types of Stochastic:
- Fast Stochastic: Uses the raw %K and %D lines, providing frequent signals.
- Slow Stochastic: A smoothed version of the Fast Stochastic, offering fewer but more reliable signals.
- Full Stochastic: Allows customisation of both %K and %D parameters for specific trading strategies.
Signals
The Stochastic Oscillator indicator provides three primary signals:
- Overbought/Oversold Conditions: An asset is considered overbought when the Stochastic is above 80 and oversold when it's below 20.
- Divergences: A bullish divergence occurs when the price forms a lower low, suggesting a downtrend, while the Stochastic simultaneously forms a higher low, indicating underlying strength and potential for an upward reversal. Conversely, a bearish divergence manifests when the price forms a higher high, signalling an uptrend, but the Stochastic forms a lower high, hinting at weakening momentum and a possible downward reversal.
- Crossovers: When the %K line crosses above the %D line, it provides a buy signal. Conversely, when the %K line crosses below the %D line, it provides a sell signal.
Awesome Oscillator
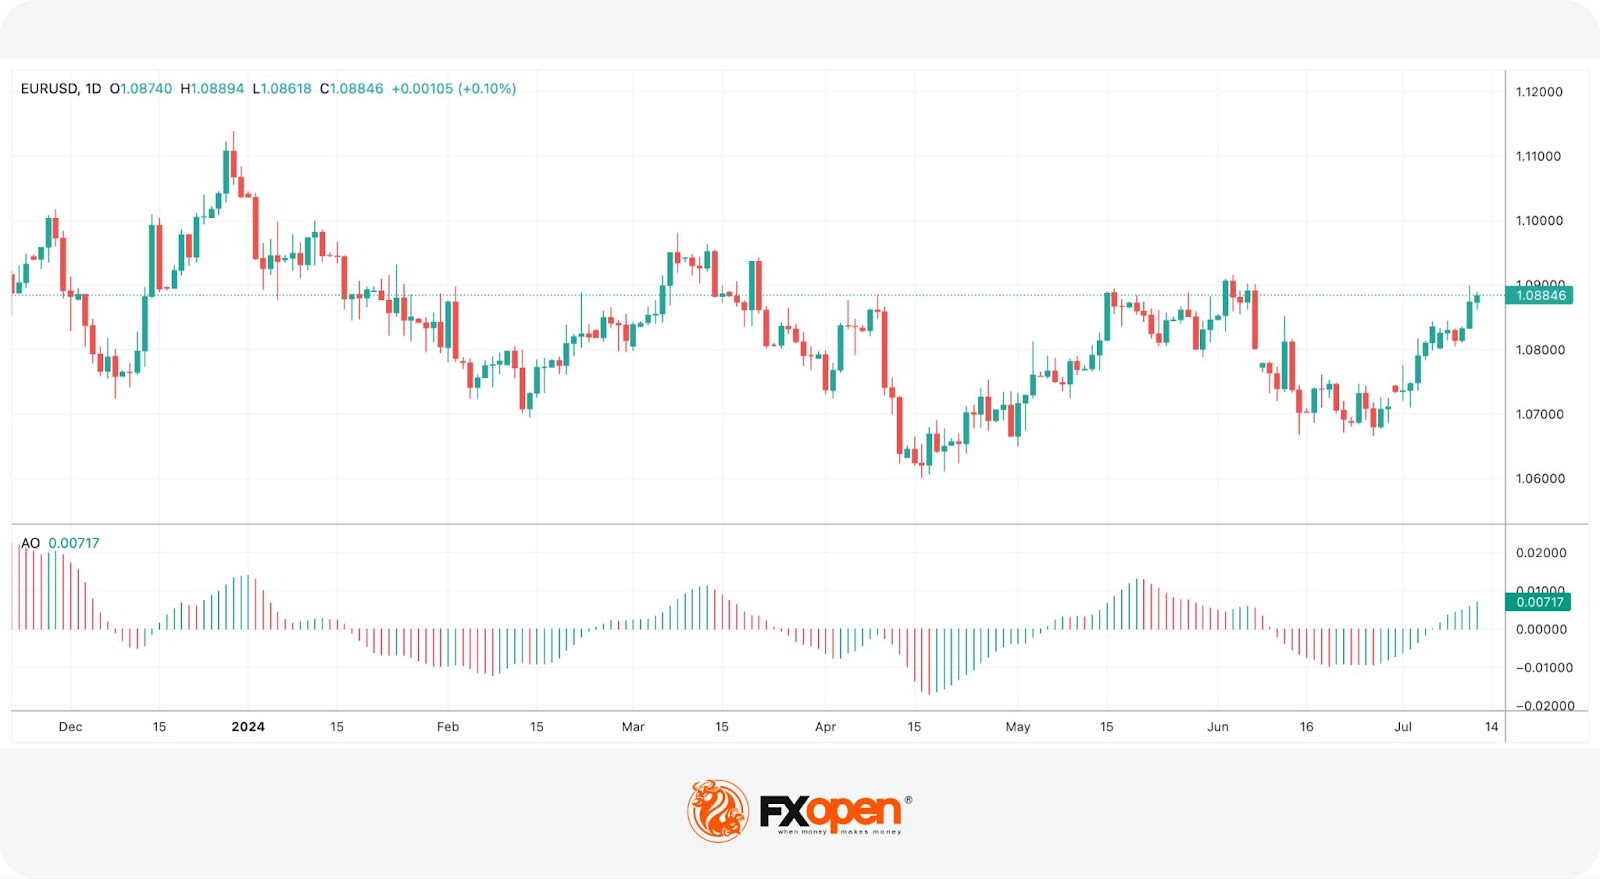
The Awesome Oscillator (AO) is a well-known oscillator in trading. It was developed by Bill Williams for evaluating market momentum and potential trend reversals using a histogram that oscillates around the zero line. The AO is calculated as the difference between a 5-period and 34-period simple moving average (SMA) of the median price (the average of the high and low prices). The default settings are 5 and 3, but they can be customised according to the trader's strategy and market conditions.
Signals
The AO provides several key signals:
- Bullish and Bearish Saucers: A bullish saucer occurs when the AO histogram is above the zero line and shows a series of three bars where the first two bars are red (decreasing in value) and the third bar is green (with a higher value), indicating a potential bullish reversal. Conversely, a bearish saucer occurs when the AO histogram is below the zero line and shows a series of three bars where the first two bars are green (decreasing in value) and the third bar is red (with a higher value), indicating a potential bearish reversal.
- Zero Line Crossovers: A bullish crossover happens when the AO histogram crosses above the zero line, suggesting a potential upward trend. Conversely, a bearish crossover occurs when the AO histogram crosses below the zero line, suggesting a potential downward trend.
- Twin Peaks: A bullish twin peaks signal occurs when there are two lows in the AO histogram below the zero line, with the second low higher than the first low. This suggests a potential bullish reversal. Conversely, a bearish twin peaks signal occurs when there are two highs in the AO histogram above the zero line, with the second high lower than the first high. This suggests a potential bearish reversal.
- Divergence: A bullish divergence occurs when the price makes a lower low, but the AO makes a higher low, indicating that downward momentum is weakening, suggesting a potential bullish reversal. Conversely, a bearish divergence appears on the chart when the price moves higher, but the AO makes a lower high, indicating that upward momentum is weakening, suggesting a potential bearish reversal.
Klinger Oscillator
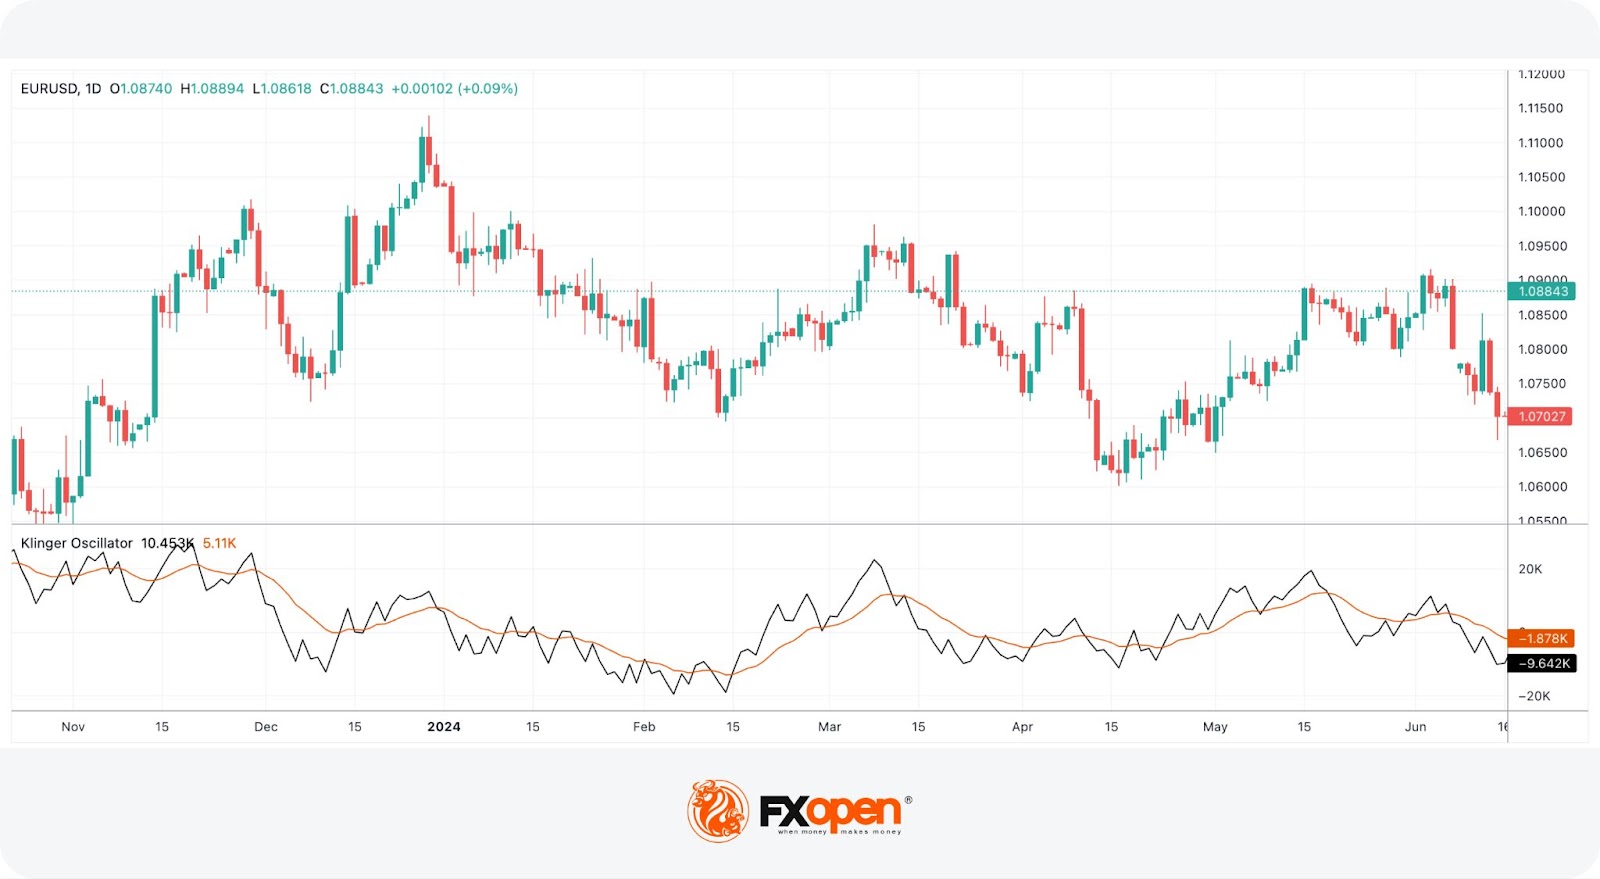
The Klinger Oscillator, also known as the Klinger Volume Oscillator, was developed by Stephen Klinger in the 1980s. It measures the difference between two exponential moving averages of volume and is represented by two lines. It addresses the limitations of other volume indicators by focusing on changes in volume trends alongside price movements. The oscillator consists of two lines on a chart: the Klinger line and the signal line, typically a 13-period EMA of the Klinger line.
The standard settings for the Klinger Oscillator typically use a 34-period and a 55-period EMA for the Klinger line. The signal line is usually a 13-period EMA of the Klinger line. These settings are designed to capture the medium- to long-term volume trends and filter out short-term noise.
Signals
The Klinger provides several signals:
- Divergences: Bullish divergences occur when the oscillator forms a higher low while the price makes a new low, indicating buying pressure. Bearish divergences occur when the oscillator forms a lower high as the price makes a new high, suggesting potential downward reversals.
- Crossovers: Trading signals occur with the Klinger line crossing the signal line. A bullish crossover (Klinger above signal) signals potential price upward movement. Conversely, a bearish crossover (Klinger below signal) suggests opportunities for short positions, indicating bearish momentum.
- Zero Line Crossings: Movements across the zero line may define price movements. Crossing above zero may indicate bullish sentiment while crossing below zero suggests bearish sentiment.
Chande Momentum Oscillator
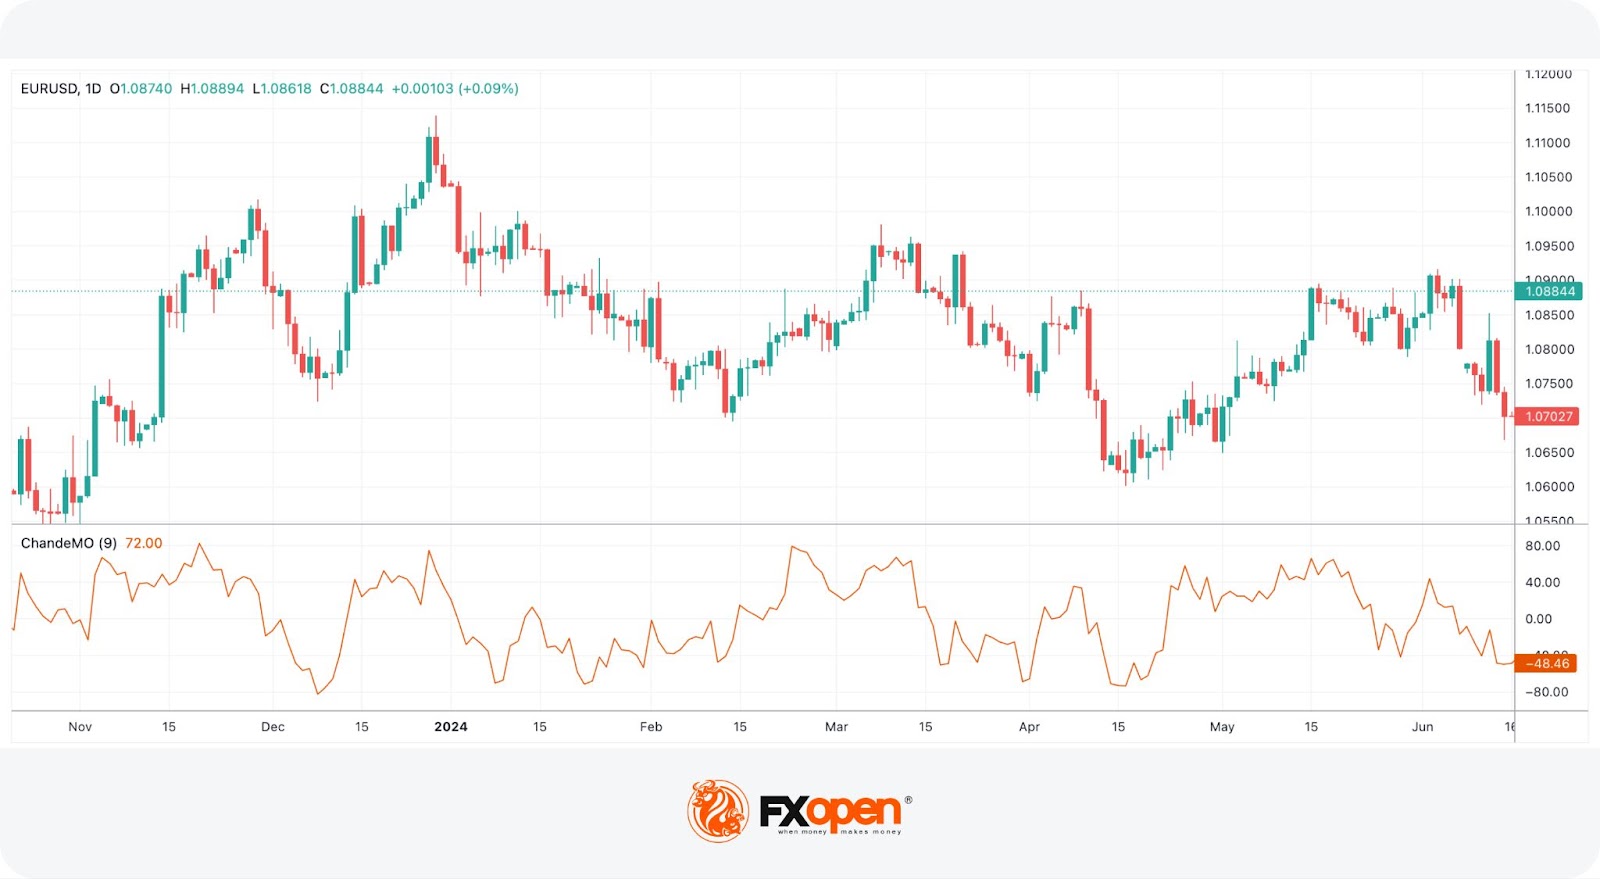
The Chande Momentum Oscillator (CMO), developed by Tushar Chande, is designed to measure the momentum of a financial instrument. Unlike oscillators that typically range between 0 and 100, the CMO, consisting of a single line, oscillates between -100 and +100. This range allows traders to assess the momentum's strength and direction more dynamically.
The standard settings for the Chande Momentum Oscillator (CMO) typically use a 9-period look-back, which aligns with common practices in technical analysis for measuring short- to medium-term momentum. This means that the CMO calculates the momentum based on the price changes over the past 9 periods.
Signals
The Chande Momentum Oscillator in the stock market and other financial markets provides key signals for traders:
- Interpreting Momentum: Values above zero indicate upward momentum, with higher values suggesting stronger bullish momentum and vice versa.
- Overbought and Oversold Conditions: Readings nearing +100 suggest overbought conditions, potentially indicating a reversal or slowdown in the upward trend. Conversely, values nearing -100 may signal oversold conditions, suggesting a potential reversal or slowdown in the downward trend.
- Zero Line Crossover: Crossing above zero may signal a bullish trend while crossing below zero may indicate a bearish trend, providing traders with entry or exit points.
Volume Oscillator
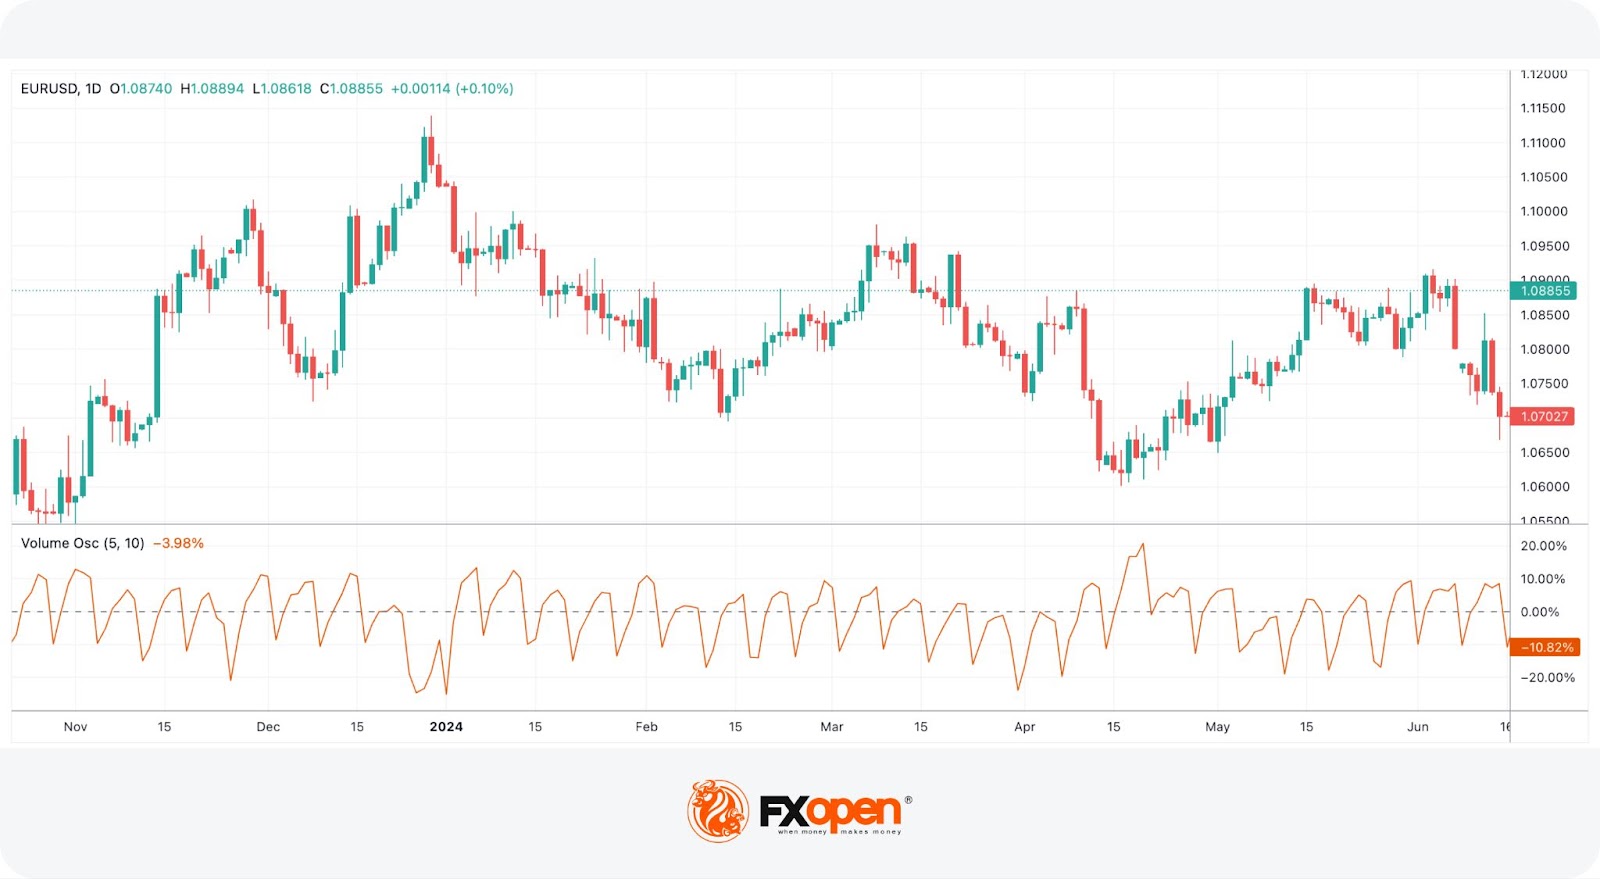
The Volume Oscillator is one of the more popular oscillators in trading. It assesses market trends and their strength by comparing two moving averages of trading volume. It consists of a single line. Unlike price-based oscillators, which focus solely on price movements, the Volume Oscillator incorporates volume data, providing insights into the underlying market activity.
The standard settings for the Volume Oscillator typically use:
- Short-term moving average of volume: 5 periods
- Long-term moving average of volume: 20 periods
These settings can be adjusted based on the trader's preferences and the specific market or asset being analysed.
Signals
The Volume Oscillator generates the following signals:
- Signs of Strength and Weakness of the Price Movement: A positive oscillator signals strong buying/selling, supporting the current trend and hinting at continuation. Conversely, a negative oscillator suggests the trend may reverse or slow down.
- Divergence Signals: Divergence occurs when the Volume Oscillator's direction differs from the direction of the price movement. For example, new price highs accompanied by lower highs in the oscillator may indicate weakening upward momentum, possibly foreshadowing a downturn. Conversely, new price lows without corresponding lows in the oscillator could signal an upcoming upward reversal.
The Bottom Line
While oscillator indicators provide insights into price movements and potential reversals, relying solely on them for trading decisions may not be sufficient. Considering additional factors like trend analysis, candlestick patterns, support and resistance levels, and broader market sentiment may strengthen trading strategies and mitigate risks. The TickTrader platform has a variety of oscillators that market participants may use to analyse over 600 markets.
FAQs
How Does an Oscillator Work?
Oscillators fluctuate within a defined range or around a centreline. Using mathematical formulas applied to market data, they signal overbought or oversold conditions, trend reversals, or shifts in momentum.
What Does Oscillate Mean in Trading?
In trading, oscillate refers to the movement of a momentum indicator back and forth within a specific range or around a midpoint. It helps identify trend reversal, momentum changes, and potential trading opportunities.
What Is the Oscillator Strategy?
An oscillator strategy uses oscillators as the primary tool for trading decisions, getting signals like overbought/oversold conditions, divergences, or crossovers to determine when to enter or exit trades.
What Is the Difference Between Indicators and Oscillators?
Indicators are the general toolbox for technical analysis, encompassing different tool types, such as trend indicators, oscillators, and volumes. Oscillators are a specific type of indicator that wiggle within set limits, helping traders identify overbought or oversold conditions and potential price reversals.
This article represents the opinion of the Companies operating under the FXOpen brand only. It is not to be construed as an offer, solicitation, or recommendation with respect to products and services provided by the Companies operating under the FXOpen brand, nor is it to be considered financial advice.
Stay ahead of the market!
Subscribe now to our mailing list and receive the latest market news and insights delivered directly to your inbox.


Latest articles

Tesla (TSLA) Shares Surge Following Musk’s Announcements
According to the chart, Tesla (TSLA) shares had been under significant pressure since the start of 2026: from their December high, they had lost around 25% of their value. The main bearish drivers included:
→ Intense competition from Chinese automakers, particularly

XTI/USD Analysis: WTI Oil Prices Under Pressure from Trump’s Statements
Yesterday, following a false bullish breakout above the psychological $100 level, WTI crude prices fell sharply towards the $85 area. The primary driver of this rapid decline was comments made by the US President.
According to Donald Trump:
→ the United
