


Trading Strategies with Pivot Points
FXOpen
Pivot points are a go-to tool for traders seeking to identify potential reversal zones in the markets. From combining them with the Relative Strength Index (RSI) to harnessing the power of Fibonacci retracements, this article discusses three multi-layered approaches to pivot point trading. Dive in to optimise their utility in your trading toolkit.
Understanding Pivot Points
Pivot points serve as key markers in trading, identifying potential areas of support and resistance. Calculated based on the high, low, and closing prices of an asset from the previous trading period, they help in forecasting price movement. These markers are beneficial in intraday trading, although they can be applied to various time frames.
The use of pivot points is multifaceted. Traders typically utilise them to gauge market sentiment and to identify entry and exit positions. They are also commonly used in conjunction with other indicators to build robust pivot trading strategies.
Regarding the best time frame for pivot points, they are often most effective in shorter time frames like the 15-minute or 1-hour charts, although some traders do employ them in daily or even weekly charts. It's important to remember that the accuracy often depends on the market’s volatility and the asset being traded.
Below are three pivot point strategies. If you’d like to follow along, head over to FXOpen’s free TickTrader platform to get started in minutes. Alternatively, you can use the pivot point indicator in MT4, MT5, and TradingView with FXOpen.
Pivot Points With RSI and Candlestick Confirmation
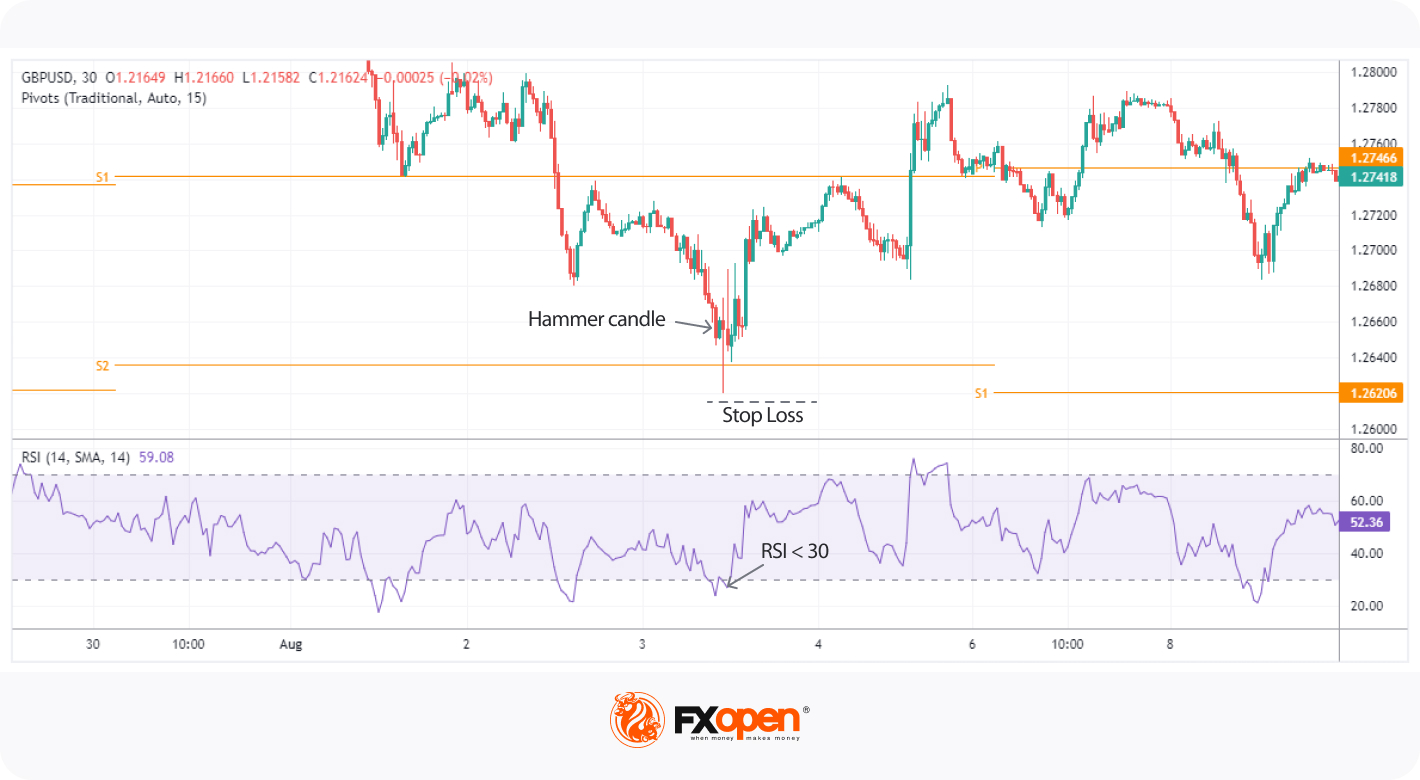
This strategy combines pivots with the Relative Strength Index (RSI) and candlestick patterns to identify potential reversal setups. Here, these points serve as the key support and resistance levels. RSI, one of the best indicators to use with pivot points, gauges the asset's momentum, and candlestick patterns provide entry confirmation.
Entry
- Traders wait for the price to be near a pivot.
- RSI should either be above 70 (indicating overbought conditions) or below 30 (indicating oversold conditions).
- Entries can be taken after seeing a candlestick reversal pattern, such as an engulfing candle, hammer, or tweezer candle, ideally in the 5-30 minute time frame.
Stop Loss
- Traders often set a stop loss just beyond the reversal point where the candlestick pattern occurred.
Take Profit
- Profits are typically taken at the next pivot. The rationale here is that price is likely to experience resistance or support at these levels, making them suitable areas to secure gains.
While pivot points and RSI provide a foundational understanding of where the asset might reverse, the candlestick pattern offers the final confirmation, reducing false signals. Such a multi-layered approach can increase the probability of making a successful trade.
Pivot Points and Fibonacci Retracements
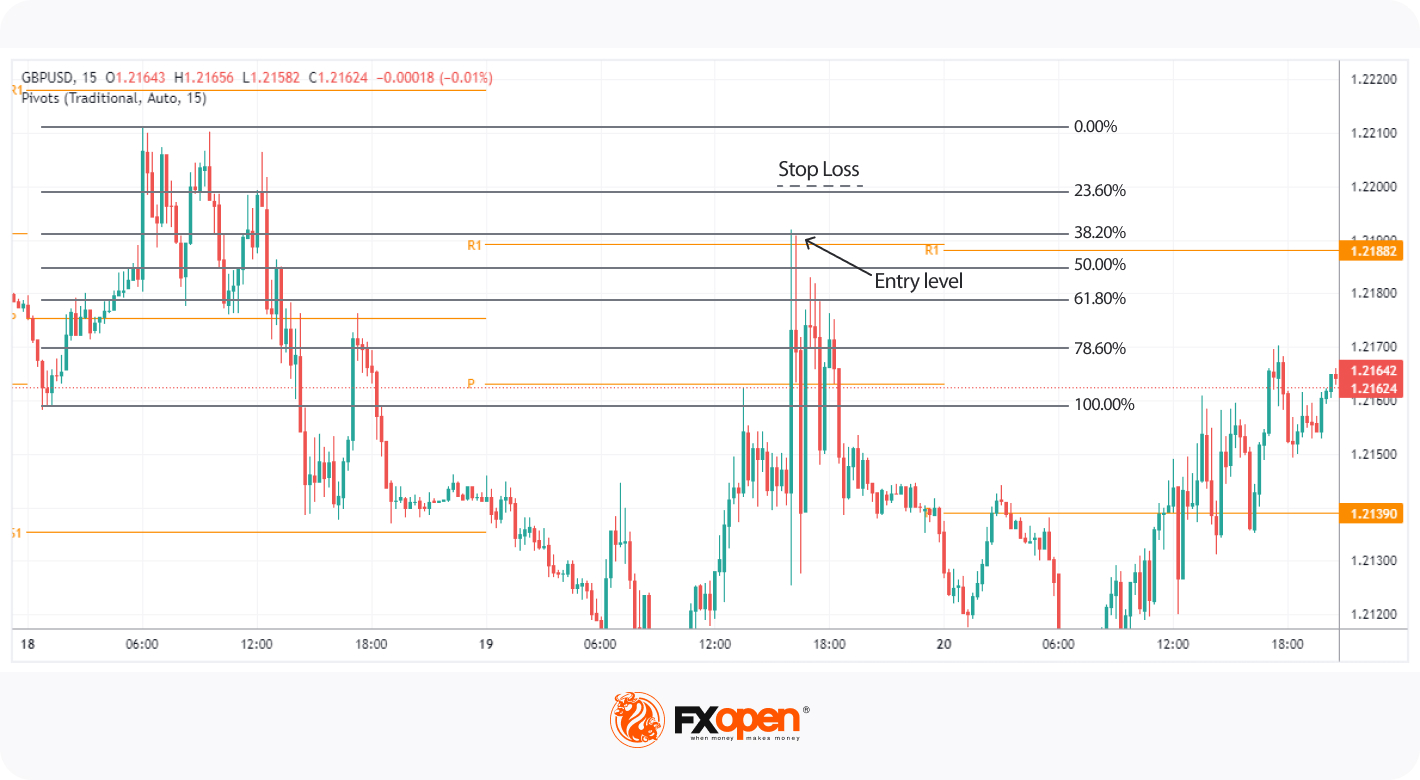
This strategy marries pivot points with Fibonacci retracements to find high-probability reversal zones. The synergy happens when a pivot coincides with one of the key Fibonacci retracement levels—38.2%, 50%, or 61.8%—in line with the broader market trend. While these Fibonacci-pivot point setups are relatively rare, they can offer strong confirmation that the asset is likely to experience a reversal in those areas.
Entry
- Traders wait for a pivot to roughly align with a Fibonacci retracement level of 38.2%, 50%, or 61.8%, setting a limit order at either to make an entry.
Stop Loss
- A stop loss is generally placed beyond the adjacent Fibonacci level to the entry. The positioning here is strategic; it accounts for the asset possibly breaching the Fibonacci level before resuming its broader trend.
Take Profit
- Traders typically aim to close their positions at the next available pivot, given that these are the next probable zones where price may stall or reverse.
The value of this strategy lies in its ability to combine Fibonacci levels for trend confirmation with pivot points for potential reversal zones, creating a more reliable framework when entering and exiting trades.
Pivot Points and VWAP
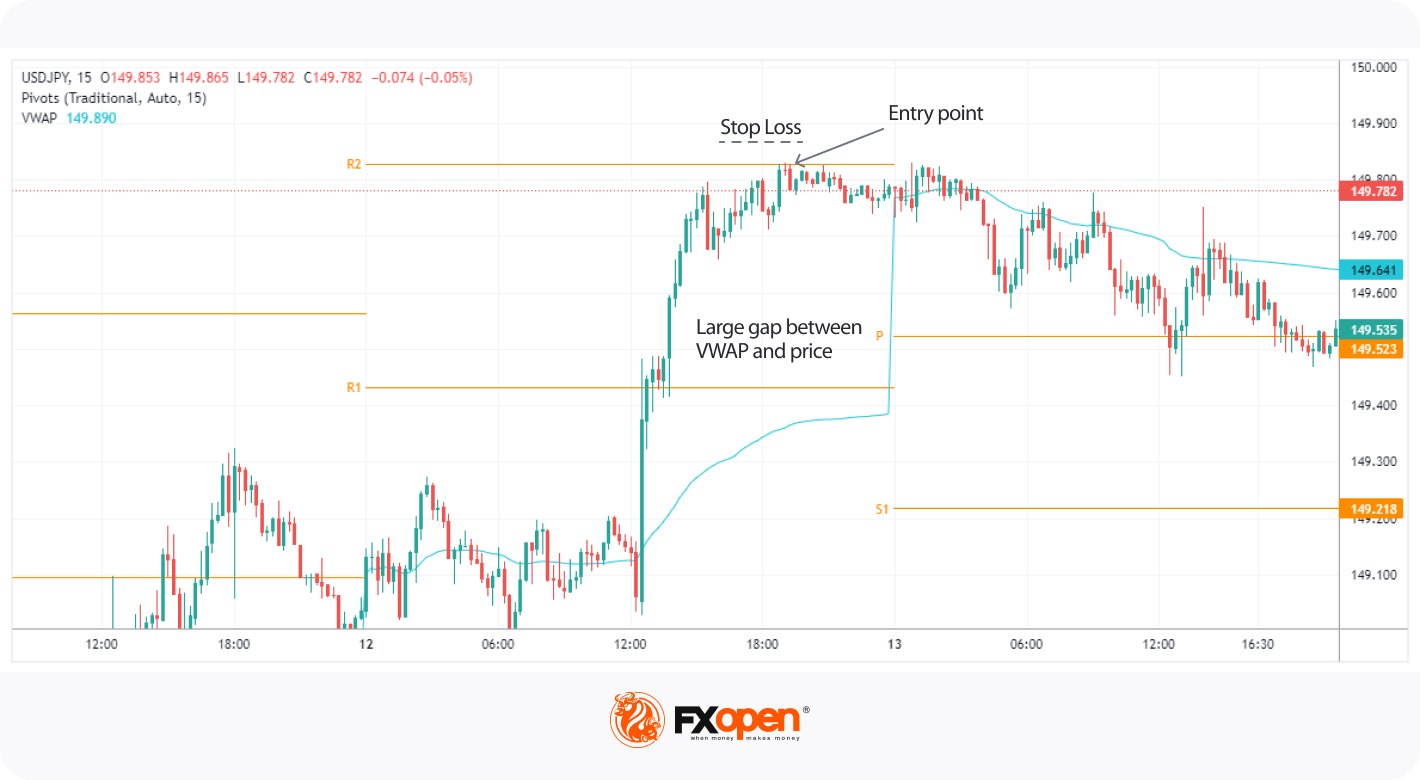
Here, pivot points are combined with the Volume Weighted Average Price (VWAP) to identify opportunities based on mean reversion. The core idea is to look for instances where the price has deviated significantly from the VWAP and reached a pivot. This can be a particularly effective forex pivot point trading strategy.
Entry
- Traders often look for the asset's price to be noticeably distanced from the VWAP and to hit a pivot before entering.
Stop Loss
- A stop loss is generally placed just beyond the pivot to manage risk.
Take Profit
- Profits can either be taken at the VWAP or at the next pivot, depending on the trader's assessment of market conditions and risk tolerance.
The underlying rationale of this strategy is the principle of mean reversion. When an asset's price strays significantly from its VWAP, it's likely to return closer to its mean value eventually. By targeting entries at pivot points that are far removed from the VWAP, traders aim to capitalise on this tendency for price to revert to the mean.
Best Practices for Pivot Point Trading
While these strategies offer setups for different market conditions, some nuanced considerations can enhance their effectiveness.
- Be Wary of False Breakouts: Pivots are well-known levels where traders place orders. Sometimes, the market deliberately moves past these points to trigger orders before reversing.
- Time of Day Matters: Pivots calculated from the opening and closing prices in forex, which operates 24/5, may vary in reliability compared to those in stock markets with defined trading hours.
- Multiple Timeframes: Look at pivots across different time frames for a comprehensive view. A point that appears on both daily and weekly charts typically holds more weight.
The Bottom Line
In summary, pivot points offer traders a systematic way to identify potential reversal areas in the market, serving as a cornerstone in various strategies, including those involving the RSI, Fibonacci Retracements, and VWAP. To leverage these strategies in over 600 markets and gain access to over 1,200 analytical tools, consider opening an FXOpen account. Happy trading!
This article represents the opinion of the Companies operating under the FXOpen brand only. It is not to be construed as an offer, solicitation, or recommendation with respect to products and services provided by the Companies operating under the FXOpen brand, nor is it to be considered financial advice.
Stay ahead of the market!
Subscribe now to our mailing list and receive the latest market news and insights delivered directly to your inbox.


Latest articles

NVIDIA: Record Revenue Sustains Interest, but Shares Remain Under Pressure
NVIDIA's revenue for the first quarter of fiscal year 2027 surged by 85% to $81.62 billion, marking another record quarter for the company. Adjusted earnings per share came in at $1.87, exceeding the Wall Street consensus forecast of

Dollar Gains Fresh Momentum: Market Assesses the Impact of the NFP Report
The US dollar strengthened against its major counterparts after the release of a robust US labour market report. Non-farm payrolls increased by 172K in May, well above the forecast of 85K, confirming the resilience of the US economy and reducing
Inverted Cup and Handle Pattern Explained
The inverted cup and handle is a bearish