


Tweezer Candlestick Patterns for Trend Trading
FXOpen

There are numerous patterns and indicators that can help traders determine the formation of a new trend. One valuable tool in a trader's arsenal is the Tweezer candlestick pattern. In this FXOpen article, we will discuss the definition of Tweezers, elucidate the importance of these patterns in trading, and emphasise their role in potentially achieving precision in trend trading.
What Is a Tweezer?
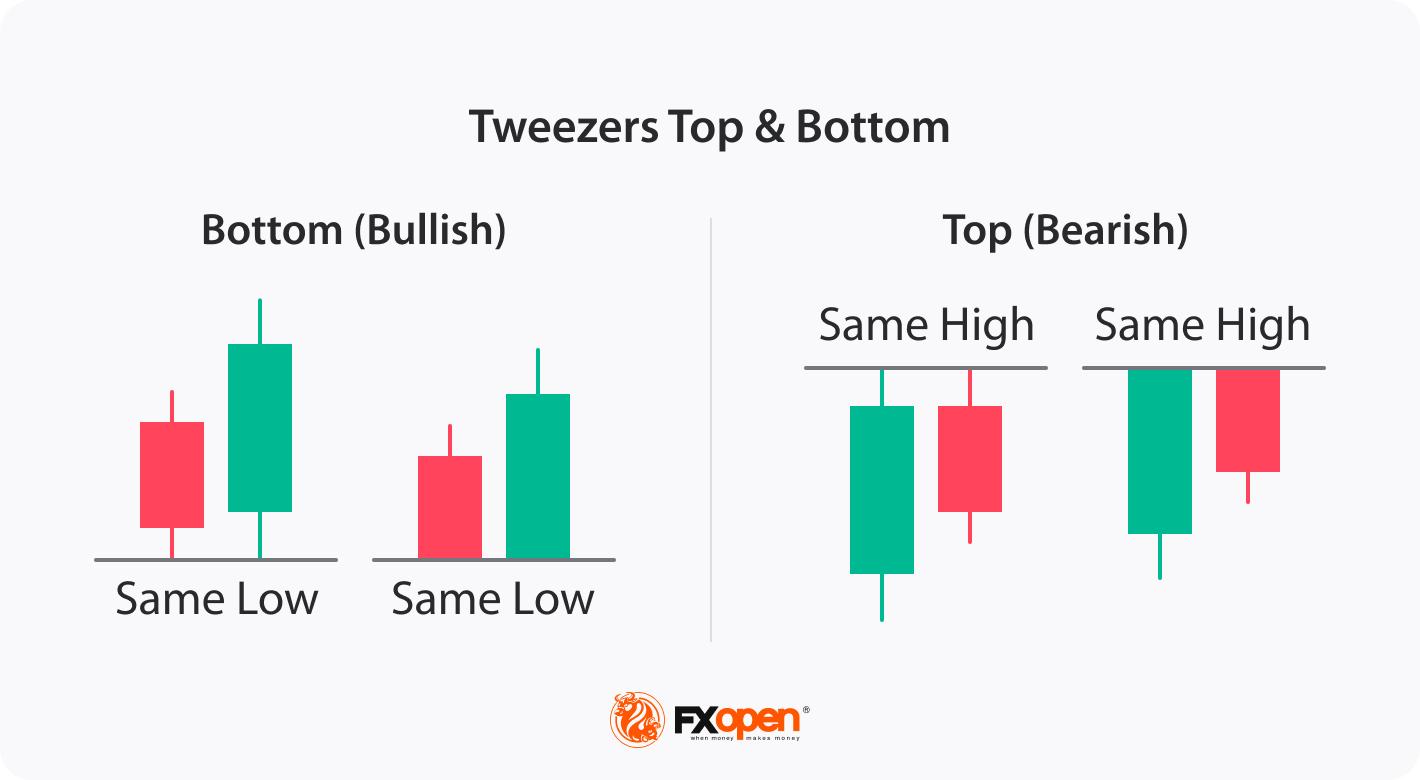
Tweezers are candlestick patterns that signify potential reversals in market trends. These patterns occur when two consecutive candlesticks share similar highs or lows, forming a "tweezer" shape on the price chart. Tweezers can be either bullish or bearish, each conveying distinct market sentiment.
Candlestick patterns, such as Tweezers, provide traders with visual cues about market sentiment. They offer insights into the balance between buying and selling pressure over a specific time frame. Understanding candlestick patterns may enhance a trader's ability to make informed decisions.
Tweezer Top
A Tweezer Top is a candlestick pattern that can hold valuable insights for traders. Traders often interpret it as a cautionary signal. It might be a prudent time to consider taking profits from long positions or even contemplating short positions. The pattern is identified by the following distinctive features:
- Twin Peaks: A Tweezer Top formation consists of a bullish and a bearish candlestick, where the highs of both candles are remarkably close or identical. This formation creates the visual impression of twin peaks or pincers, hence the name "Tweezer."
- Bearish Reversal: Tweezer Tops are predominantly considered bearish reversal patterns. They typically appear at the end of an uptrend and signify a potential shift in market sentiment from bullish to bearish. You can trade a Tweezer Top in two ways, meaning you can either open a sell trade or close buy trades.
- Short Upper Shadows: Both candlesticks forming Tweezer Tops usually exhibit short upper shadows. This implies that the price attempts to move higher but encounters resistance, indicating a potential trend reversal.
How to Trade Tweezer Tops
You can find a Tweezer Top in forex, stock, commodity, and crypto* markets. When it comes to trading Tweezer Tops, traders may follow these rules:
- Identification: The first step is to correctly identify Tweezer Tops on price charts. Focus on spotting the twin peaks with nearly identical highs.
- Entry Strategies: Depending on your trading style, you may consider initiating short positions or closing long positions when Tweezer Tops are confirmed. The proximity to resistance levels can influence your entry decisions.
- Stop Loss and Take Profit: The pattern doesn’t provide precise stop-loss and take-profit targets. Traders usually set them based on their own risk-reward ratios and the current market conditions.
Tweezer Bottom
A Tweezer Bottom is a reversal candlestick pattern, forming at the end of a downtrend. It possesses distinct characteristics that make it easily recognisable:
- Dual Troughs: Tweezer Bottoms form with a bearish and a bullish candlestick, both featuring nearly identical or equal lows. This creates the visual impression of a pair of tweezers.
- Bullish Reversal: Tweezer Bottoms are primarily viewed as bullish reversal patterns. They typically appear at the end of a downtrend and signal a potential shift in market sentiment from bearish to bullish. Traders typically trade with Tweezer Bottoms in two ways, meaning they consider entering long positions or closing short positions.
- Short Lower Shadows: Both candlesticks forming Tweezer Bottoms usually have short lower shadows. This suggests that the price attempted to move lower but encountered support, indicating a potential trend reversal.
How to Trade Tweezer Bottoms
When trading Tweezer Bottoms, traders may follow these steps:
- Identification: Start by correctly identifying Tweezer Bottoms on price charts. Focus on recognising the twin troughs with nearly identical lows.
- Entry Strategies: Depending on your trading style, consider initiating long positions or closing short positions when Tweezer Bottoms are confirmed. Pay attention to proximity to support levels, as they can add validity to a trend reversal.
- Stop-Loss and Take-Profit: The pattern lacks specific stop-loss and take-profit targets. Typically, traders establish these levels by considering their individual risk-reward ratios and the prevailing market conditions.

Confirming Tweezer Signals
Confirming Tweezer patterns is essential to increase the reliability of your trading decisions. Here are several methods you may use to confirm Tweezer patterns:
Candlestick Confirmation:
- Pay attention to the subsequent candlestick(s) after the Tweezer pattern. If the next candlestick confirms the reversal direction, it adds credibility to the Tweezer pattern. For example, if you have a Tweezer Top and the following candle(s) is bearish, it reinforces the bearish reversal signal.
Trend Analysis:
- Consider the prevailing trend. Tweezer patterns carry more weight when they appear at key support or resistance levels. If a Tweezer Bottom forms at a strong support level during a downtrend, it suggests a potential reversal to an uptrend.
Confirmation from Oscillators:
- You may use technical oscillators like the Relative Strength Index (RSI) or the Stochastic Oscillator to confirm Tweezer patterns. If these oscillators show overbought or oversold conditions in conjunction with a Tweezer pattern, it strengthens the signal. For example, if the RSI leaves the overbought area after the Tweezer Top is formed, it may confirm a trend reversal.
Divergence in Momentum Indicators:
- Check for divergence in momentum indicators like the Moving Average Convergence Divergence (MACD) or the Commodity Channel Index (CCI). Divergence occurring with a Tweezer pattern may provide a strong confirmation.
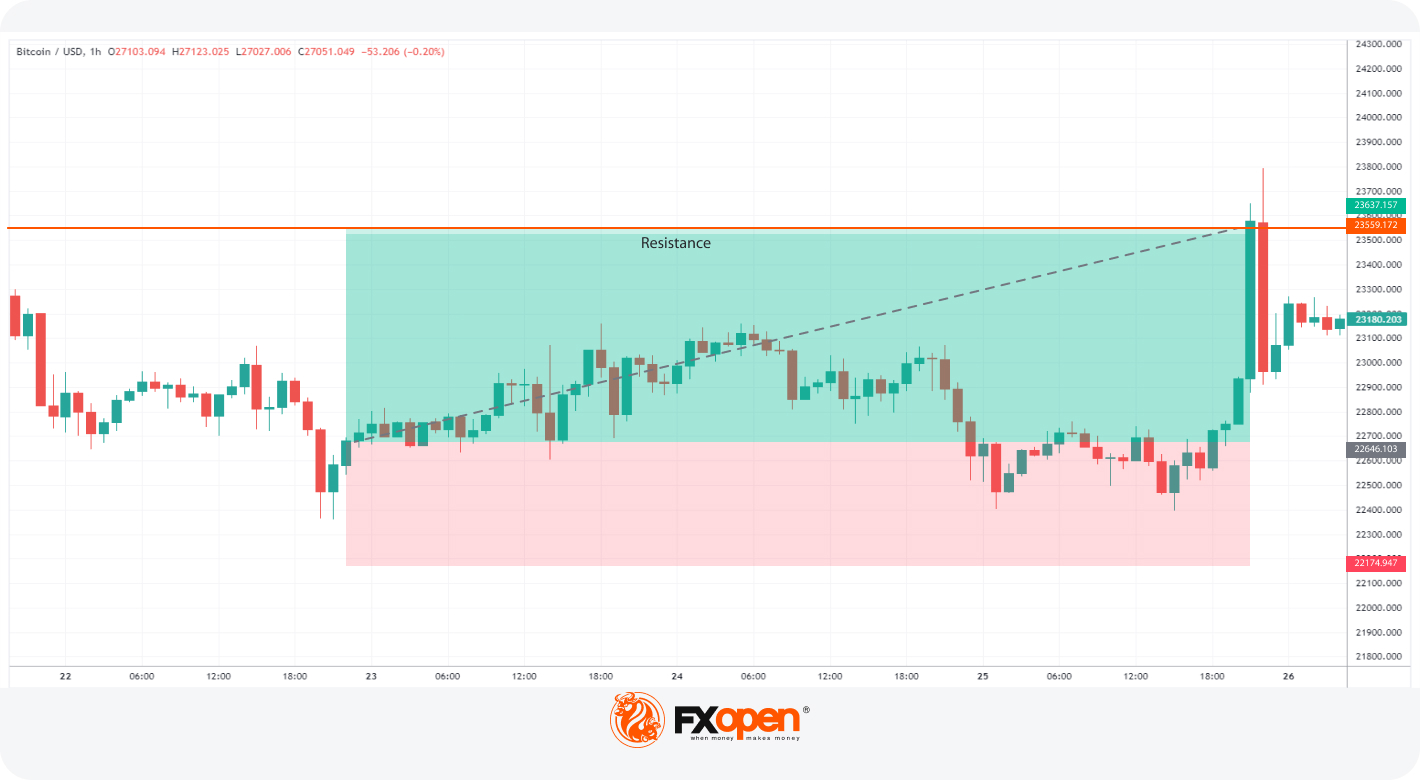
On the chart above, the price formed a Tweezer Bottom formation. A stop-loss order is just below the Tweezer Bottom pattern, and a take-profit target is at the subsequent resistance level.
Limitations and Considerations
While Tweezers can be valuable tools, it's essential to acknowledge their limitations and consider various market conditions where they may not be as effective. Additionally, combining Tweezers with other analysis methods may enhance the overall reliability of trading decisions.
Limitations
- Tweezers as One Piece of the Puzzle: It's crucial to recognise that Tweezers are just one component of technical analysis. Relying solely on Tweezers can be limiting, as they may not always provide complete or accurate signals. Traders should avoid making decisions based solely on Tweezers and consider them within a broader context.
- False Signals: Tweezers, like any other candlestick pattern, can produce false signals. Not every Tweezer formation leads to a significant price reversal. Traders should exercise caution and use additional confirmation techniques.
- Lack of Precise Rules: Unlike chart patterns, candlesticks don’t provide precise entry and exit points. Therefore, it may be challenging to build a trading strategy.
When Tweezers May Not Be as Effective
- Low Volatility Markets: In low volatility markets, Tweezers may have less significance. The absence of strong price movements can make it challenging to rely on Tweezers alone for trading decisions.
- Trend Continuation: Tweezers are primarily reversal patterns, so they may not be as effective during strong trending periods. Traders should be cautious when using Tweezers in situations where the trend is likely to continue.
Takeaway
While Tweezers can be a valuable part of technical analysis, traders should be aware of their limitations, consider market conditions, and use them in conjunction with other analysis methods for more informed and reliable trading decisions. If you want to trade Tweezer patterns in multiple markets, consider opening an FXOpen account and enjoy numerous technical analysis tools on the TickTrader platform.
*At FXOpen UK and FXOpen AU, Cryptocurrency CFDs are only available for trading by those clients categorised as Professional clients under FCA Rules and Professional clients under ASIC Rules, respectively. They are not available for trading by Retail clients.
This article represents the opinion of the Companies operating under the FXOpen brand only. It is not to be construed as an offer, solicitation, or recommendation with respect to products and services provided by the Companies operating under the FXOpen brand, nor is it to be considered financial advice.
Stay ahead of the market!
Subscribe now to our mailing list and receive the latest market news and insights delivered directly to your inbox.


Latest articles

Weekly Market Insights with Gary Thomson: The Week of Central Banks and Earnings
In this video, we’ll explore the key economic events and market trends, shaping the financial landscape. Get ready for insights into financial markets to help you navigate the week ahead. Let’s dive in!
In this episode of Market

Intel at a Crossroads: Earnings Beat Meets Technical Resistance
Intel has just delivered its strongest quarter in over fifteen years, and the market reaction says it all. Q2 2026 revenue surged 25% year-over-year to $16.1 billion, crushing the consensus estimate of $14.42 billion, while adjusted EPS of

Tesla: Complex Range Structure Breaks Down Following Quarterly Earnings
Tesla released its Q2 2026 results after the market closed on 22 July. Revenue increased 26% year-on-year to $28.24 billion, while vehicle deliveries reached a record 480,126 units. However, operating margin fell sharply to 1.4%, down from