


FXOpen
In the dynamic world of forex and CFD trading, the ability to recognise crucial chart patterns is essential for making informed decisions. Among the patterns frequently sought after by traders is the Tasuki Gap setup. This article delves into understanding the Tasuki Gap, its identification on charts, associated trading tactics, and its distinctions from other candlestick formations.
Tasuki Gap Pattern: An Overview
The Tasuki Gap is a candlestick formation that is used in technical analysis to indicate a potential continuation of a market trend. Comprising the Upside and Downside Tasuki Gaps, this setup allows traders to trade in uptrends and downtrends. The pattern is observed on any timeframe and in different markets, including forex, stocks, commodities, indices, and cryptocurrencies*.
Upside Tasuki Gap
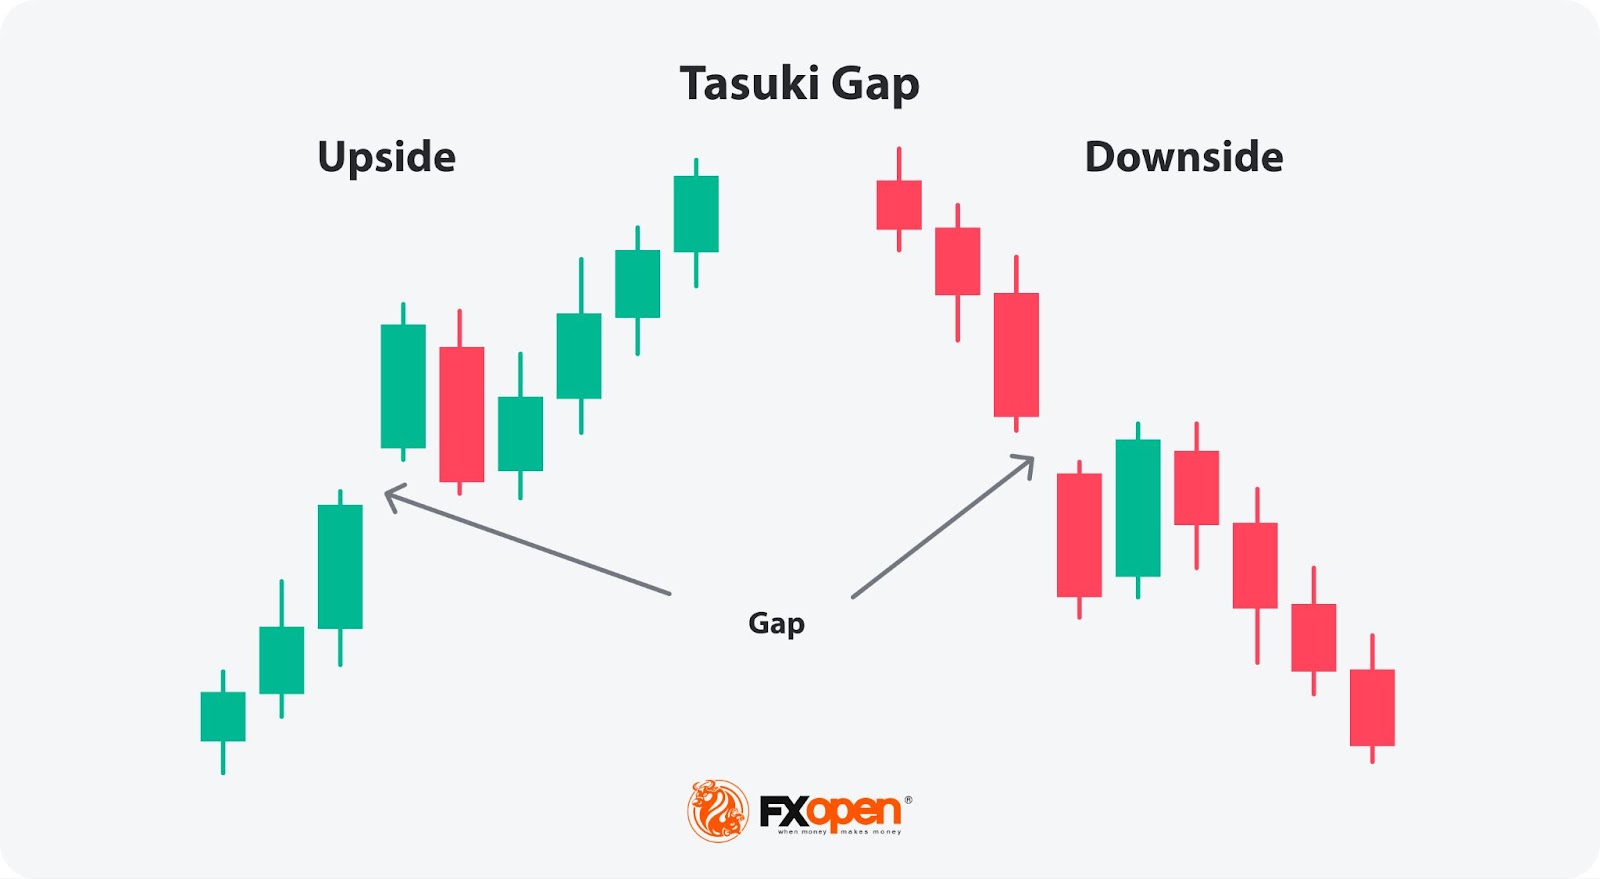
The Upside Tasuki Gap candlestick pattern is a bullish continuation setup observed within an uptrend. It consists of three consecutive candlesticks:
- First: Long bullish candlestick, signalling strong bullish momentum.
- Second: Opens with a gap up, indicating further bullish sentiment.
- Third: A bearish candle partially closes the gap between the first two candles, suggesting a temporary pause in the uptrend. However, as the gap isn’t fully covered, it signals a continuation of the solid upward movement.
Downside Tasuki Gap
In contrast, the Downside Tasuki Gap candlestick is a bearish continuation pattern observed within a downtrend. It also consists of three consecutive candlesticks:
- First: Long bearish, reflecting bearish dominance in the market.
- Second: Opens with a downside gap, indicating intensified selling pressure.
- Third: Bullish, closes within the gap but does not fully cover it, suggesting a brief pause in the downtrend. As the gap isn’t covered, it’s a sign the downtrend will continue.
Analysing Tasuki Gaps
To take advantage of the Upside Tasuki Gap formation, market participants might consider the following strategy:
- Entry: Traders place a buy-stop order above the high of the second candle or open a long position once the upward movement is confirmed by the close of the bullish candlestick following the pattern.
- Stop loss: Traders place a stop-loss level below the low of the first candle or below the closest swing point/support level, depending on market volatility and the trader’s risk aversion.
- Take profit: Traders set the profit target at either the next resistance level or based on the risk/reward ratio, commonly 1:2 or 1:3.
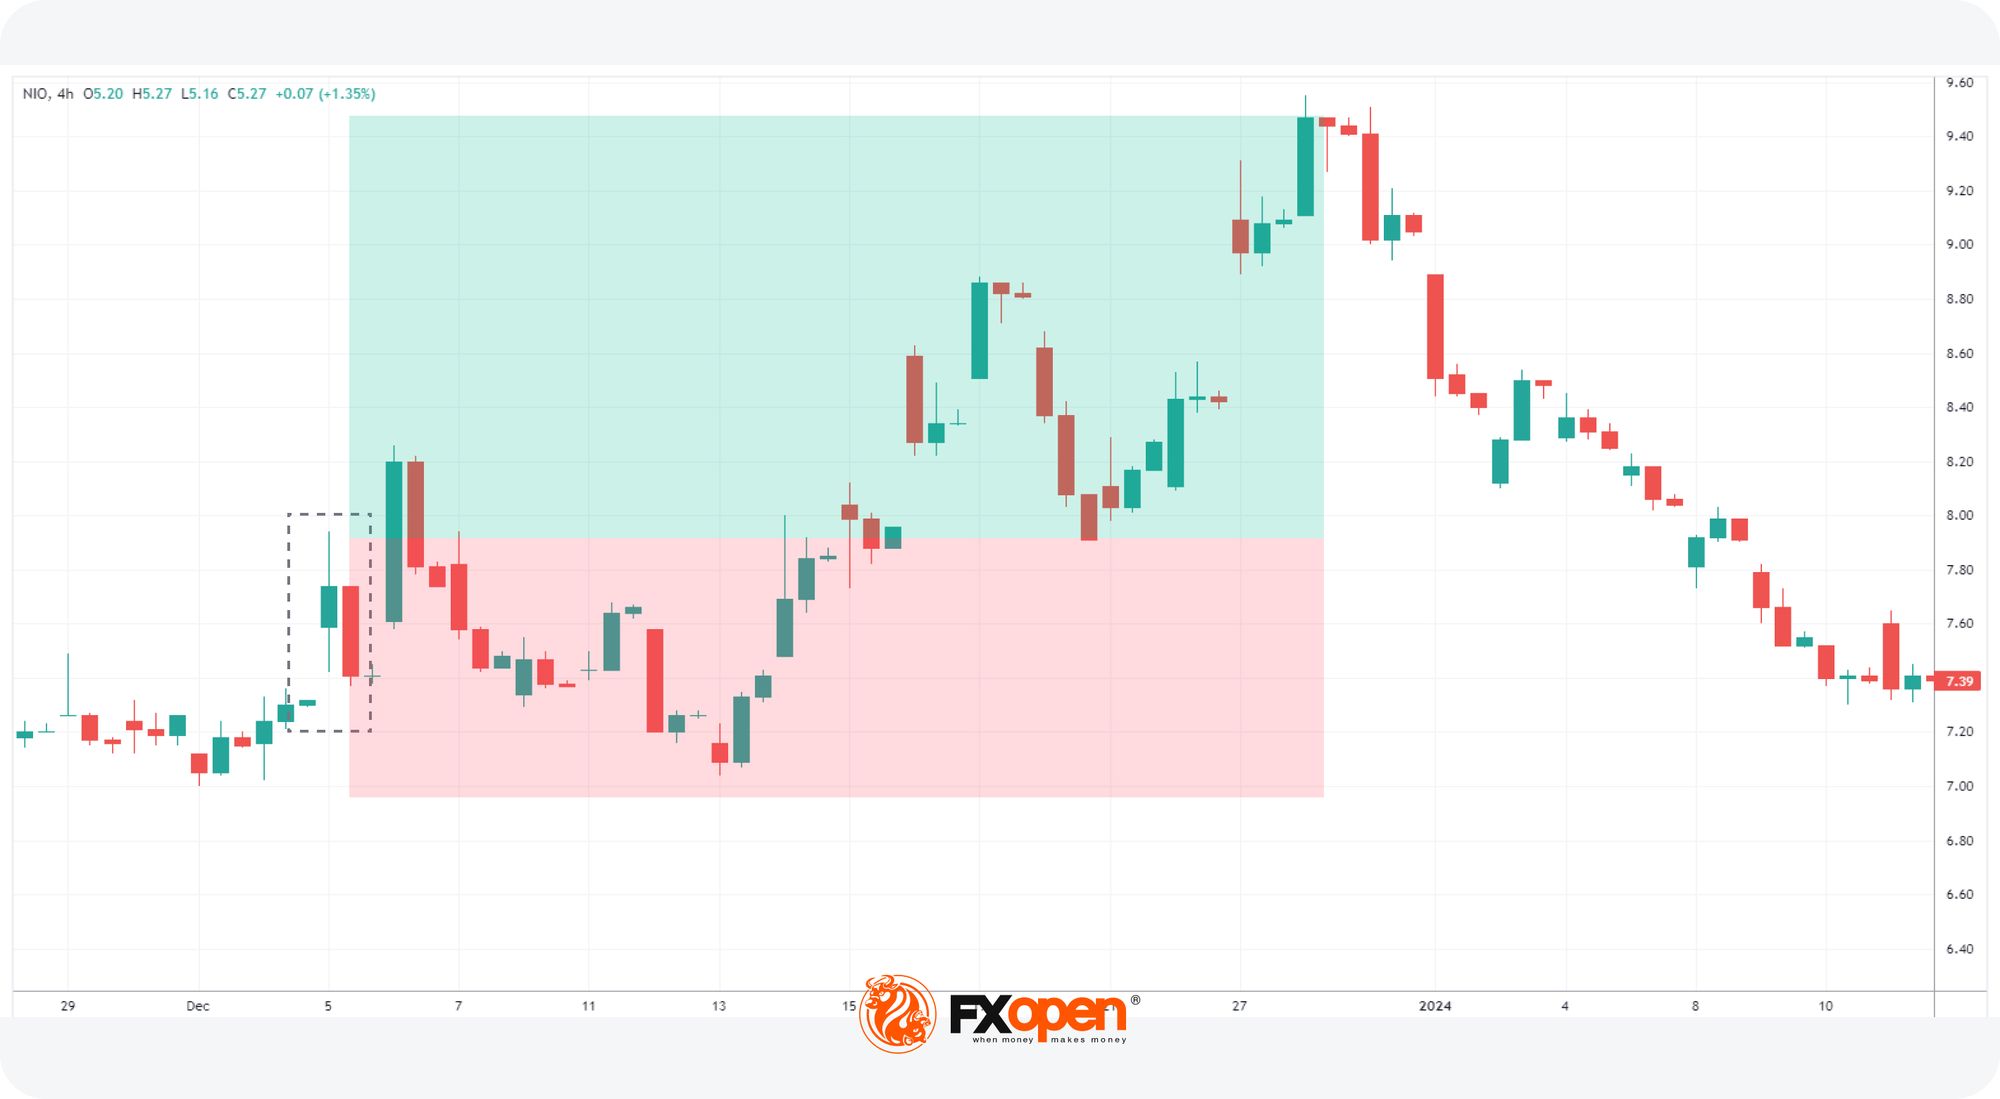
On the chart above, a trader finds an Upside Tasuki Gap. They place a long position at the high of the second candle with a stop loss below the nearest swing low. The take profit is at the next resistance level.
When encountering the Downside Tasuki Gap, traders might use this strategy:
- Entry: Traders open a short position on the close of the candle following the bullish candlestick or place a sell-stop order below the low of the second candle.
- Stop loss: Traders place a stop-loss order above the high of the first candle or above the closest swing point/resistance level, depending on the trader’s risk appetite and market volatility.
- Take profit: Traders set the profit target at either the next support level or considering the risk/reward ratio, commonly 1:2 or 1:3.
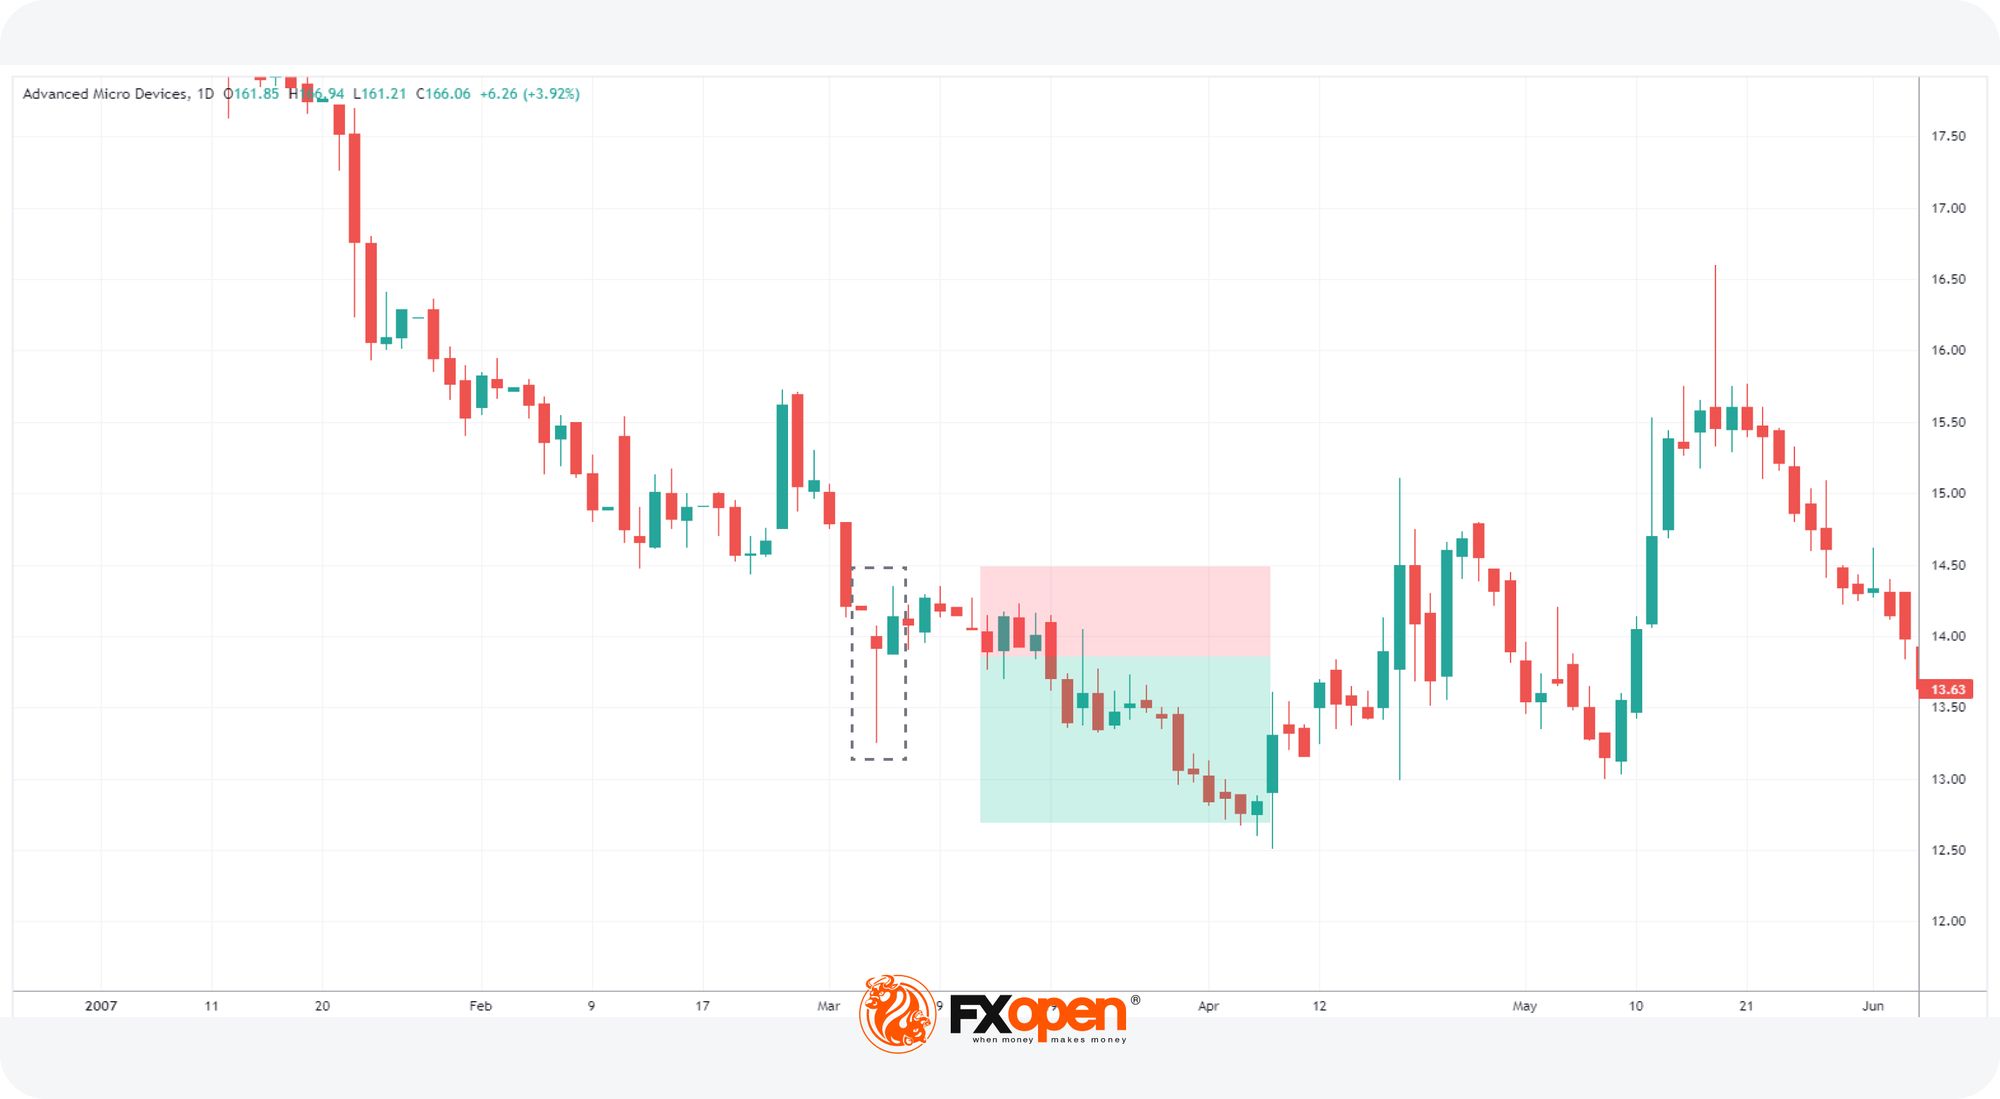
A trader finds a Downside Tasuki Gap candlestick and places a short entry at the bearish candle closing below the close of the second candlestick. Their take profit is at the next support level, while stop loss is calculated with a risk-reward ratio.
Psychology Behind Tasuki Gaps: Reading Market Sentiment
The Tasuki Gap is more than just a visual representation of price movement; it's a window into the market's collective psychology. By understanding the emotional undercurrents behind it, traders may gain valuable insights into market sentiment.
Upside Tasuki Gap: Bullish Optimism Challenged
The first large bullish candle in the Upside Tasuki Gap candlestick pattern during an uptrend reflects strong buying pressure and optimism. The subsequent bullish upside Tasuki gap reinforces this sentiment, suggesting an increase in the number of bullish trades. However, the third candle, which fails to close the gap, indicates a pause in this optimism. This pause could be due to:
- Profit-taking: Some traders, having enjoyed a solid bullish price movement, might choose to take profits, causing a temporary pullback.
- Reversal expectation: Seeing the strong bullish momentum, some traders could expect a market reversal, especially near resistance levels.
- Exhaustion of buyers: Bulls might be temporarily exhausted, leading to a brief pause in the uptrend.
Downside Tasuki Gap: Bearish Strength Is Paused
The initial bearish candle during a bearish trend in the Downside Tasuki Gap candlestick pattern reflects selling pressure. The gap down signifies intensified bearish sentiment. The third bullish candle suggests:
- Profit-taking: Bears might choose to close their trades to preserve return after a solid bearish trend, causing a temporary pullback.
- Reversal expectation: Some traders might see the sharp decline as an opportunity to buy at a lower price, causing a temporary price rise.
- Exhaustion of sellers: The aggressive selling might have temporarily exhausted itself, leading to a brief pause in the downtrend.
Application in Trading Strategies
Incorporating these patterns into trading strategies requires an understanding of their signals and additional confirmation tools for effective decision-making.
- Seeking Additional Confirmation: Traders may seek additional confirmation before entering or exiting positions. This confirmation can come from technical indicators, such as moving averages, trendlines, or volume analysis. For example, moving averages may help confirm the market's current trend.
- Strategic Placement and Timeframe Alignment: Traders may identify strong trends in higher timeframes, such as daily or weekly charts, and look for Tasuki Gaps that align with the direction of these trends. Additionally, considering the broader market environment and key support/resistance levels may help clarify the effectiveness of trading decisions based on these patterns.
- Risk Management: Trailing stop-loss orders may be employed to protect potential profits as the trend progresses.
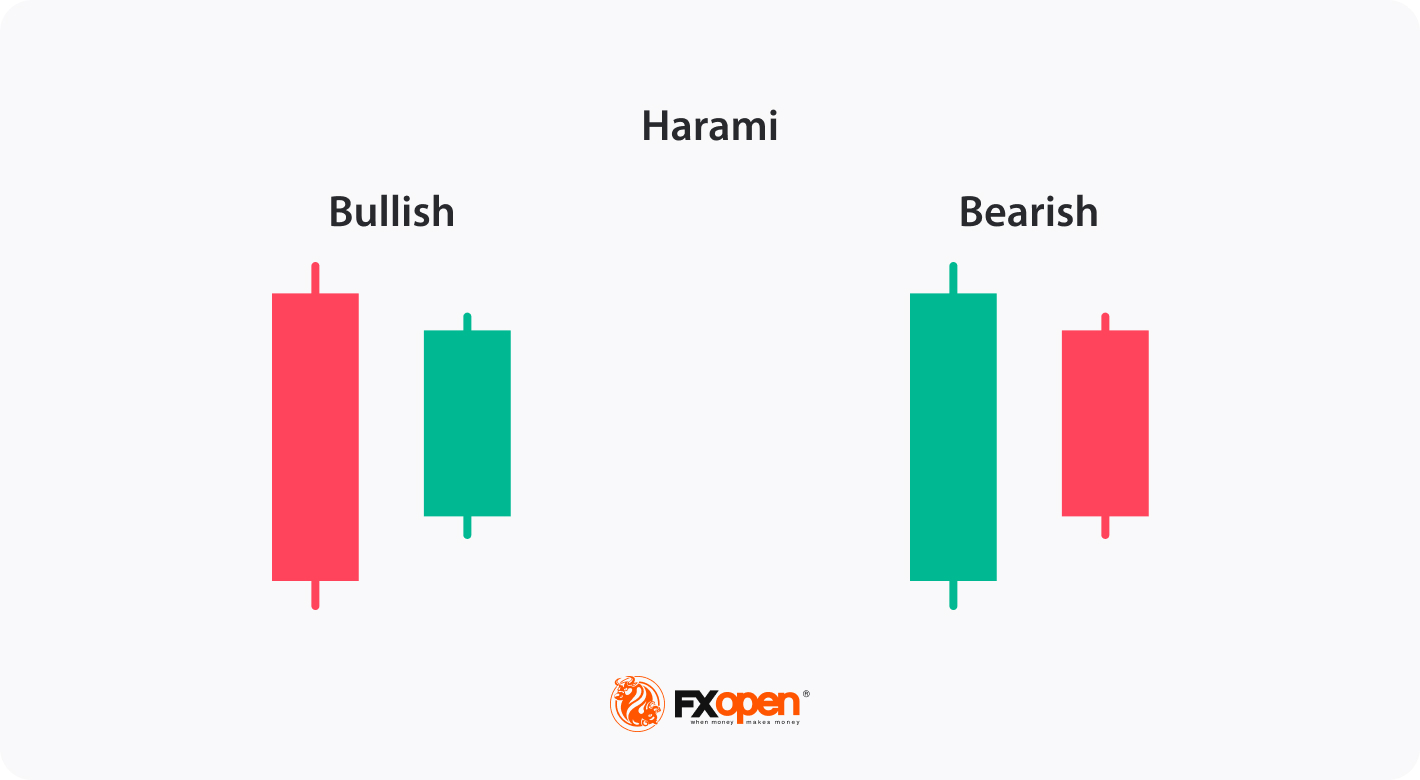
Key Differences Between Tasuki, Harami, and Engulfing Patterns
Tasuki Gaps can be confused with Harami and Engulfing formations. The Harami consists of two candlesticks and forms after a solid price movement. Unlike Tasuki Gaps, which suggest trend continuation, Harami formations often appear at key reversal points, prompting traders to anticipate a change in the market direction.
Engulfing patterns, similar to the Harami, consist of two candlesticks and serve as potent signals for potential trend reversals. Engulfing patterns involve the second candle completely engulfing the first candlestick. This engulfment signifies a strong shift in market sentiment, with the potential for a trend reversal. Engulfing patterns typically occur at the end of trends, while Tasuki Gaps occur within a solid trend.
The Bottom Line
Integrating the bullish Upside Tasuki Gap and the bearish Downside Tasuki Gap candlestick patterns into trading strategies requires a comprehensive understanding of their characteristics and implications. The TickTrader trading platform by FXOpen has various trading tools traders can implement to practise their trading strategies. As you develop your trading approach, open an FXOpen account to trade over 600 assets with tight spreads and low commissions.
FAQs
What Is the Tasuki Gap Pattern?
The Tasuki Gap is a significant candlestick pattern used in technical analysis to indicate a continuation of a market trend. It comprises the Upside and Downside Tasuki Gaps, offering insights into market sentiment and allowing traders to define strong up- and downtrends.
What Is the Bullish Tasuki Pattern?
The bullish Tasuki pattern, also known as the Upside Tasuki Gap, is a candlestick setup, forming within an uptrend and consisting of three consecutive candlesticks: a large bullish followed by a gap up formed by the second bullish candle and a third one that partially closes the gap between the first two candles. This setup suggests a temporary pause in the uptrend but indicates the potential continuation of bullish momentum.
Why Do Gaps Occur in Forex?
Gaps in the forex market occur due to the disparity between supply and demand. They often happen during periods of high volatility caused by news releases or significant market events when there is a sudden shift in supply and demand. Gaps can also occur over weekends when the forex market is closed, resulting in a gap between the closing price on Friday and the opening price on Sunday evening.
*At FXOpen UK and FXOpen AU, Cryptocurrency CFDs are only available for trading by those clients categorised as Professional clients under FCA Rules and Professional clients under ASIC Rules, respectively. They are not available for trading by Retail clients.
This article represents the opinion of the Companies operating under the FXOpen brand only. It is not to be construed as an offer, solicitation, or recommendation with respect to products and services provided by the Companies operating under the FXOpen brand, nor is it to be considered financial advice.
Stay ahead of the market!
Subscribe now to our mailing list and receive the latest market news and insights delivered directly to your inbox.


Latest articles

FX Markets Are Changing: What’s Driving Currencies Now?
FX markets have become increasingly reactive in March, with geopolitical developments—particularly the US–Iran conflict—driving price action across currencies, commodities, and interest rate expectations.
In this update, we examine the key forces shaping the FX market right now,

GBP/USD Rises Following Bank of England Decision
Yesterday, the Bank of England’s decision had a significant impact on the pound, which strengthened against other currencies. Although the Official Bank Rate remained unchanged at 3.75%, the market was surprised by the “hawkish” signals, which sharply contrasted

S&P 500 Analysis: Index Falls to Year-to-Date Low
As the S&P 500 chart (US SPX 500 mini on FXOpen) shows, the index dropped below the 6,570 level yesterday for the first time in 2026. As a result, the equity market may be on track to