


FXOpen

Candlestick patterns can often help traders pinpoint the start of an upcoming price reversal. One of the more popular reversal signals is the bullish harami, a two-candle formation that may indicate fading selling pressure and the beginning of the bullish movement. This article breaks down what the bullish harami looks like, how it works, and how it fits into a broader trading toolkit.
What Is a Bullish Harami Candlestick Pattern?

The bullish harami is a two-candle pattern that typically appears during a downtrend and signals a potential bullish reversal. It consists of a large bearish candle followed by a smaller bullish candle that’s completely contained within the body of the first. Visually, it looks like the second candle is “inside” the first—hence the name harami, which means “pregnant” in Japanese.
The first candle reflects strong selling pressure, while the next shows fading bearish momentum. Buyers step in just enough to keep the price from falling further, and the result is a small-bodied candle that doesn’t break below the previous low and closes above its open. It’s not an aggressive bullish move, but enough to signal hesitation from sellers.
According to theory, this formation only carries weight if it appears during a clear downtrend and ideally near a known support level or after extended selling. If paired with other forms of confirmation, such as the RSI moving out of an oversold area, it can be a strong reversal pattern.
Bullish Harami vs Bearish Harami
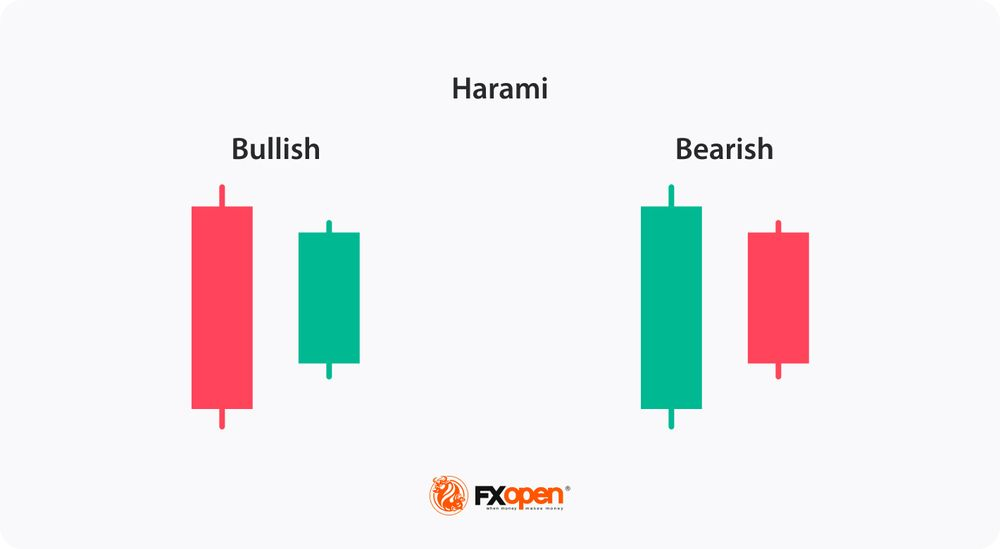
The bearish harami candlestick pattern is the mirror image. It shows up in an uptrend, with a large bullish candle followed by a smaller bearish one inside the prior body. It points to slowing bullish momentum. Both patterns are about potential turning points, just in opposite directions.
How Can You Trade the Bullish Harami?
The bullish harami candle pattern can indicate a slowdown in selling, but the market’s behaviour around the pattern can be a key clue whether it’s just a pause or a more significant move.
Market Context
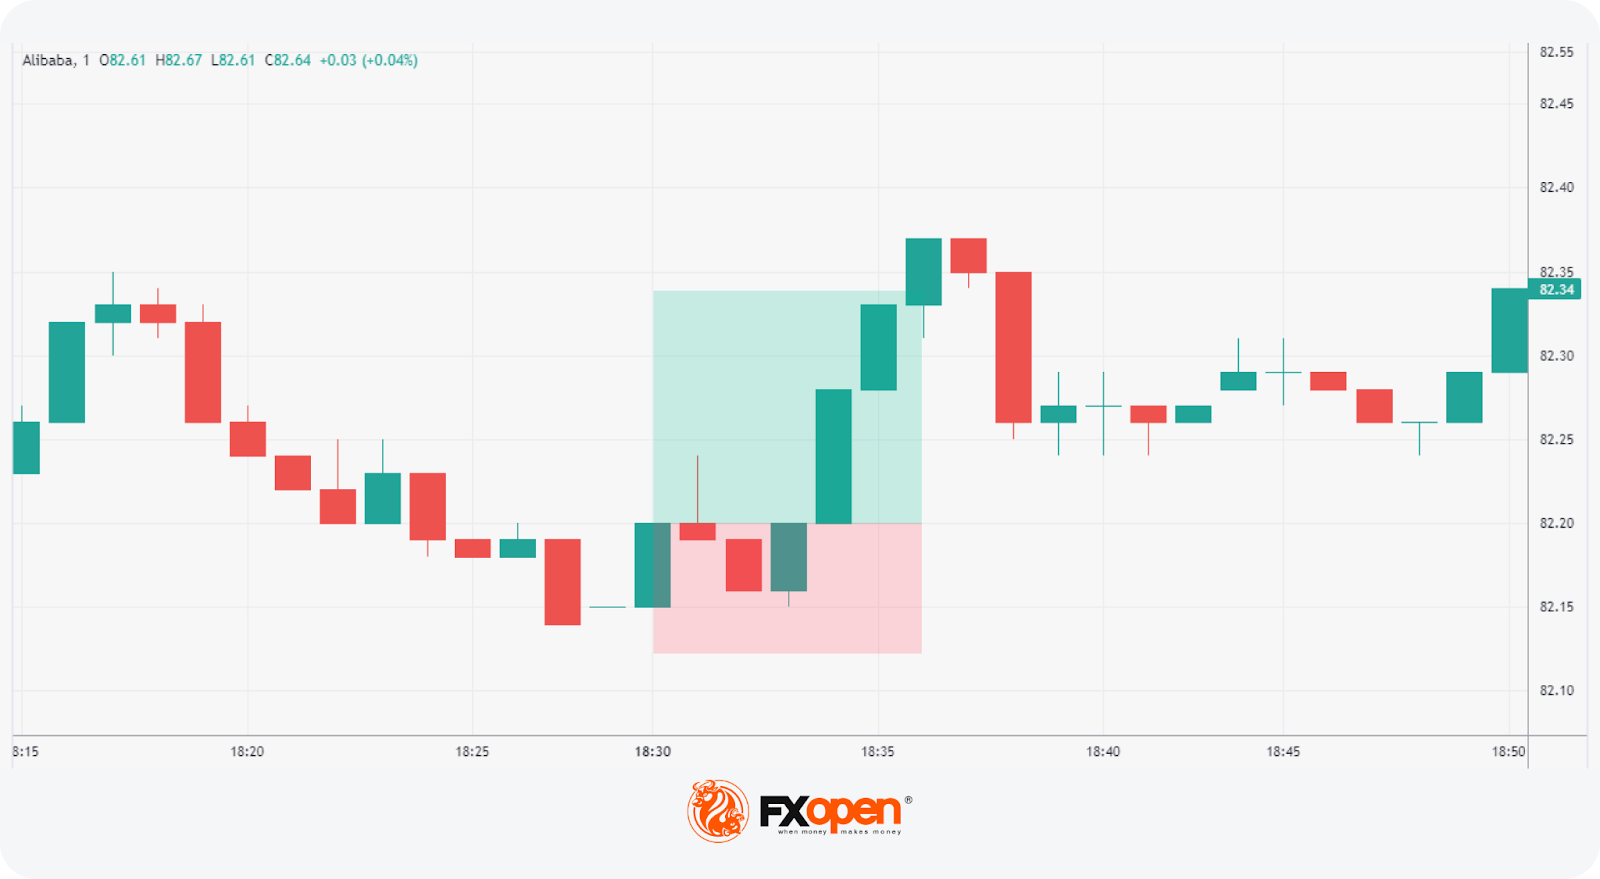
Before anything else, traders look at where the harami appears. If the price has been in a clear downtrend, especially one that has been in place for a long period, a bullish harami’s meaning is more significant. If it forms in a sideways or choppy market, it’s usually ignored.
The Third Candle
Since the harami is a two-candle pattern, many traders will look for confirmation with subsequent candles. The third candle, just after the harami, can make all the difference. If it closes strongly above the high of the pattern, or even just the second inside candle, that’s a sign that buyers are stepping in and a bullish reversal may be underway. It’s not a guarantee, but it adds confluence.
Supporting Levels
If the bullish harami appears at a level where a reversal might be expected, such as a known support level, a swing low, a Fibonacci retracement, or trendline, that can be an additional contextual clue. Since buyers are already likely looking to bid the market at this level, a bullish harami can act as a visual sign that bulls are getting involved.
Entering and Exiting a Market
While some traders may simply enter on the close of the second candle, others may wait for a third to confirm the pattern. In essence, entering earlier can increase the potential reward relative to risk, but may also mean higher risk of loss if the pattern provides a false signal.
In terms of setting a stop loss, some traders set it below the low of the first candle. If it breaks, they see the pattern as having failed. Some place a stop beyond a key level instead. A take-profit order might be placed at an area where a bearish reversal is anticipated, such as a resistance level.
Combining the Bullish Harami Pattern With Other Tools
The bullish harami candlestick pattern is often used alongside other indicators and tools. Alignment between multiple signals offers added conviction before traders act on a potential reversal.
Relative Strength Index (RSI)
The relative strength index is one of the most common tools used alongside the harami. If the RSI is in oversold territory (typically below 30) when the pattern appears, it can hint that the selling pressure is stretched.
However, in a strong downtrend, an RSI below 30 and a bullish harami may be overshadowed by intense selling pressure. Some traders also track how RSI reacts after the harami—if it begins to move upwards, that can help support the case for a reversal.
Moving Average Shifts
Traders also look at how price interacts with moving averages. If a bullish harami forms while the price is well below a key moving average, it may indicate that the bearish move is overdone. Some will look for the slope of the moving average to flatten or turn slightly upwards after the pattern.
The MACD, which is built on the convergence and divergence of moving averages, can also show this change in direction, particularly if the MACD line crosses the signal line from below.
Volume Analysis
Volume can add important context. A harami that forms on rising bullish volume on the second candle, can suggest stronger buying interest. It doesn’t confirm anything outright, but it shows there’s actual participation behind the move. Likewise, some may dismiss a bullish harami that occurs on low volume.
Some traders also use the on-balance volume (OBV) to track whether buying or selling pressure is building in the background. If the OBV line starts turning upwards around the same time the harami appears, it can signal that volume is quietly moving in favour of buyers, even if the price hasn't moved much yet.
Explore a world of 1,200+ trading tools in FXOpen’s free TickTrader trading platform.
Bullish Harami vs Other Reversal Patterns
The bullish harami is just one of many bullish reversal patterns. Recognising the difference between it and other similar patterns is key to avoiding confusion.
Bullish Harami vs Bullish Engulfing
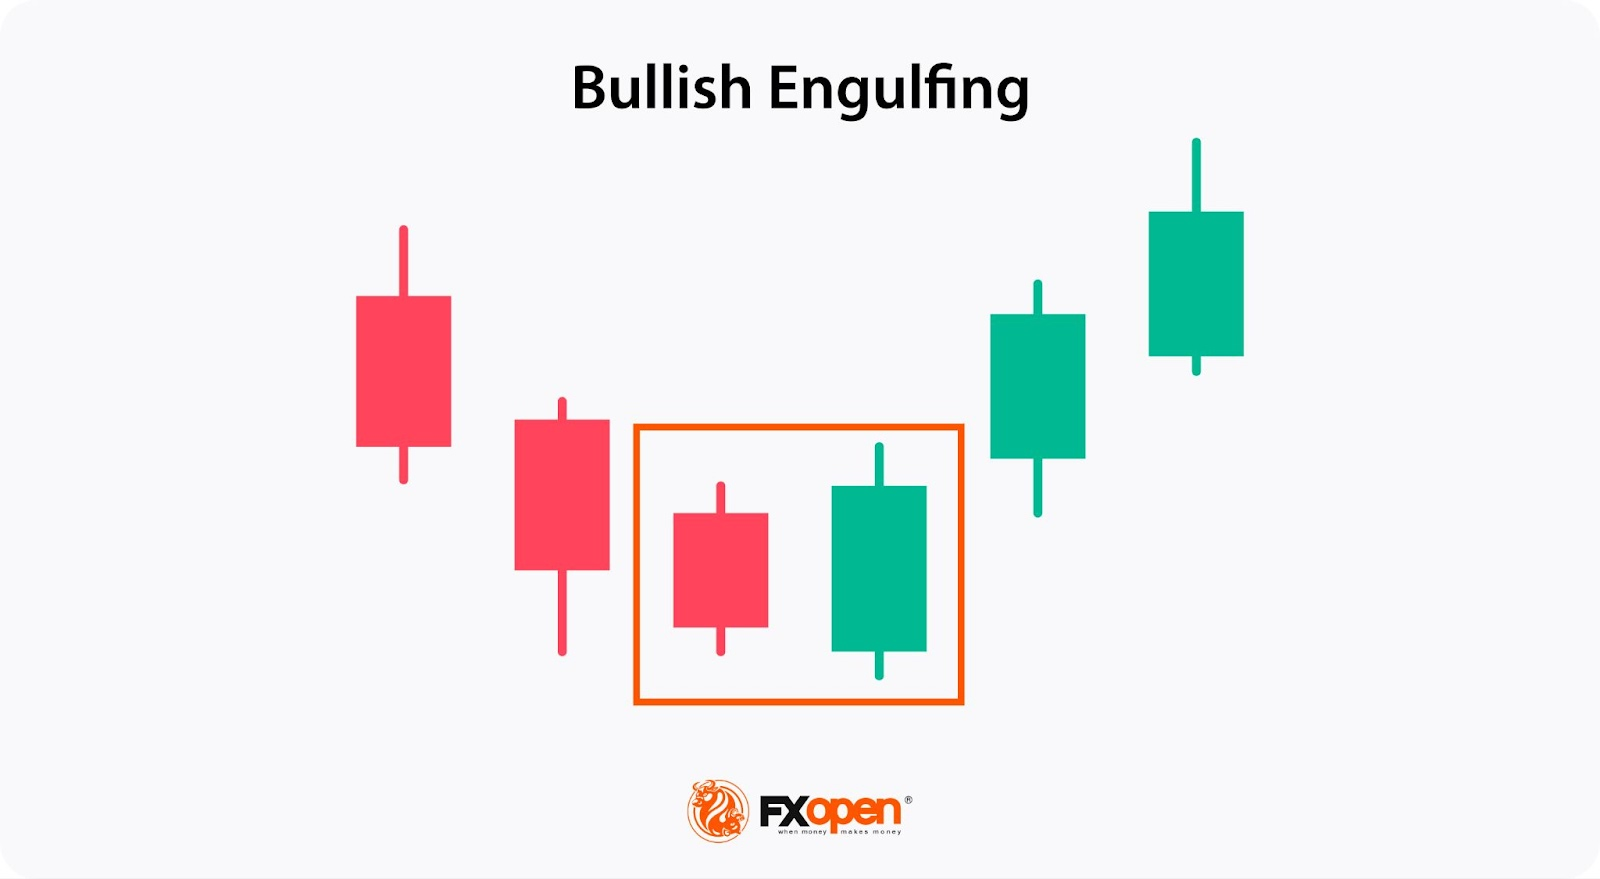
Both look very similar, but structurally they’re opposite. A bullish engulfing pattern has a small bearish candle followed by a larger bullish one that completely engulfs it. It shows much stronger buying intent.
While the harami suggests hesitation from sellers and buyers beginning to step in, the engulfing pattern signals a more decisive shift from bearish to bullish. As a result, traders generally view the engulfing as a stronger signal.
Bullish Harami vs Piercing Line
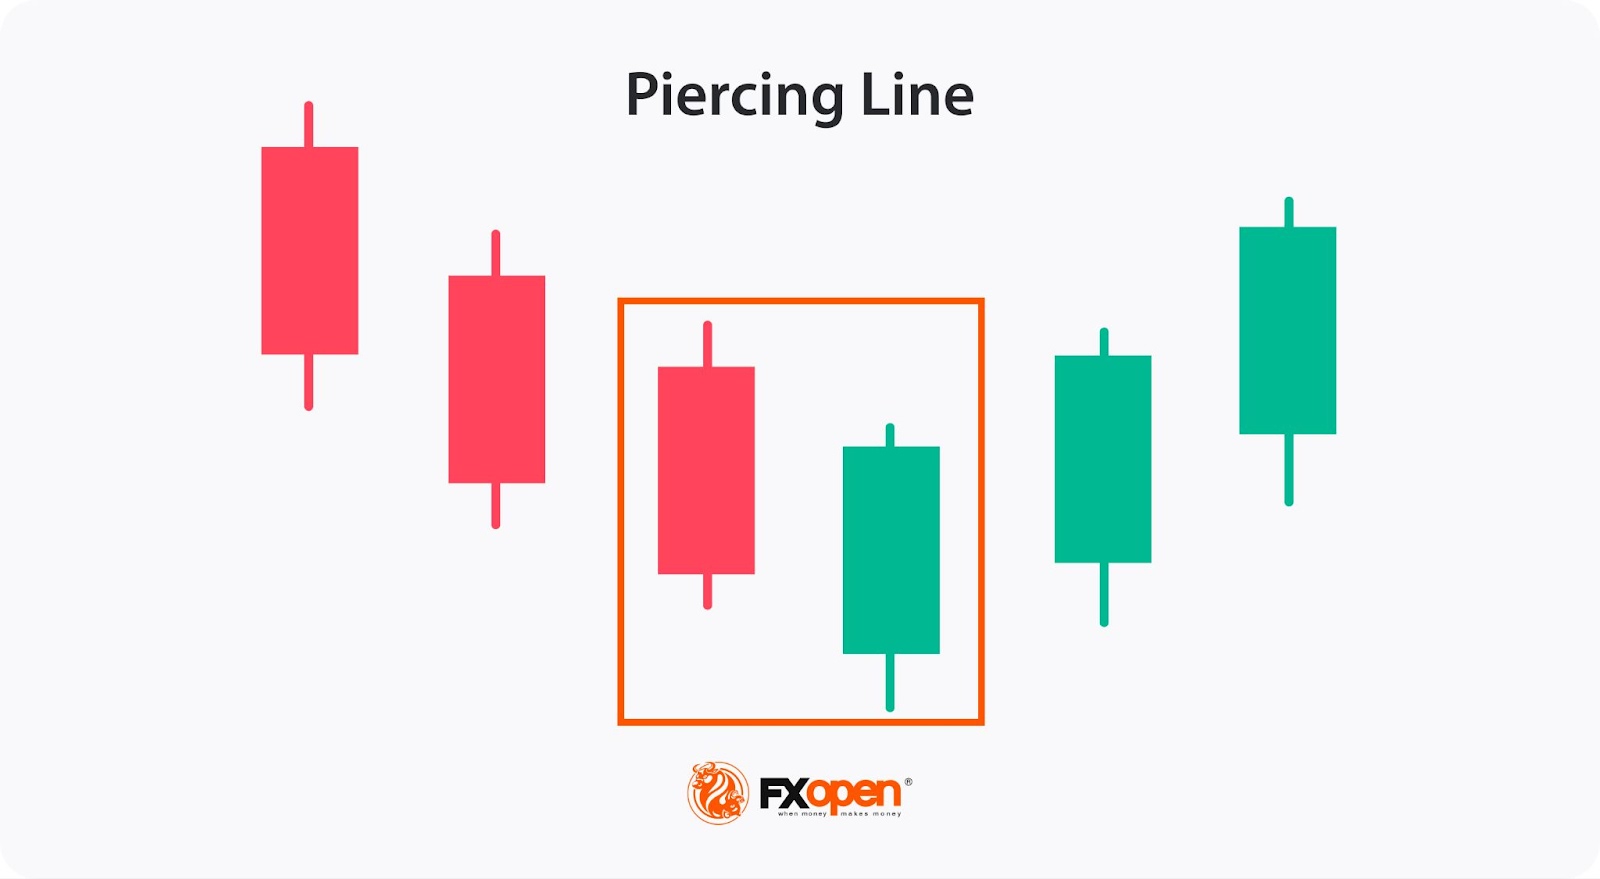
The piercing line also shows a potential reversal in a downtrend. It starts with a bearish candle followed by a bullish one that opens below the low but closes above the midpoint of the first candle. It’s more aggressive than a harami but needs a clear gap down first, so it’s less common.
Advantages and Limitations of the Bullish Harami
The bullish harami can be a useful pattern in the right context, but it has its strengths and weaknesses.
Advantages
- Early signal: The pattern can indicate a possible turning point before more obvious reversal patterns appear.
- Straightforward: The two-candle structure offers a setup that can be combined with other forms of analysis.
- Works across various markets and timeframes: It works on virtually every asset class, including stocks, currencies, and commodities, and timeframe, though may be less reliable on shorter timeframes.
Limitations
- Weak on its own: The harami requires confirmation from other tools and analysis before it’s considered tradeable.
- Struggles in sideways markets: Without a clear trend, the pattern may be less significant.
- Less bullish than other reversal patterns: The second candle may only show hesitation, rather than the strong bullish surge characteristic of other reversal patterns.
The Bottom Line
The bullish harami is a straightforward but valuable pattern that can offer an entry point at the start of a possible reversal. While not the strongest reversal signal, contextual clues and added confluence may improve its reliability.
To explore bullish harami setups in more than 700 live markets, consider opening an FXOpen account. Put your analysis into practice with tight spreads, low commissions, and four advanced trading platforms.
FAQ
What Does Bullish Harami Indicate?
A bullish harami indicates a potential reversal in a downtrend. It suggests sellers are losing steam and that buyers may be starting to step in. While not a strong reversal signal on its own, it often adds confluence to the idea that the market is reversing in a given area.
What Is the Stop Loss on a Bullish Harami?
Traders often use the low of the first candle in the pattern as a reference for the stop-loss point. If the price breaks below that level, it’s generally considered invalid. However, some traders may prefer a wide stop beyond a key support level.
What Happens After a Harami Candle?
If buyers follow through, prices may begin to move higher. However, without confirmation from other technical signals, such as a bullish candle following the pattern, a momentum indicator showing a reversal, or volume increasing, the price can just continue falling or stay range-bound.
This article represents the opinion of the Companies operating under the FXOpen brand only. It is not to be construed as an offer, solicitation, or recommendation with respect to products and services provided by the Companies operating under the FXOpen brand, nor is it to be considered financial advice.
Stay ahead of the market!
Subscribe now to our mailing list and receive the latest market news and insights delivered directly to your inbox.


Latest articles


Market Insights with Gary Thomson: Oil, US Retail Sales & NFP in Focus
In this video, we’ll explore the key economic events and market trends, shaping the financial landscape. Get ready for insights into financial markets to help you navigate the week ahead. Let’s dive in!
In this episode of Market

Geopolitics Fuels Volatility: AUD/USD and USD/CAD Near Key Levels
Commodity-linked currencies continue to weaken amid rising geopolitical tensions, which are boosting demand for safe-haven assets and increasing volatility across both FX and commodity markets. The US dollar is gaining support from demand for liquid and defensive assets, while currencies