


What Is a Darvas Box Theory and How Does It Work in Trading?
FXOpen
The Darvas Box Theory, pioneered by Nicolas Darvas in the 1950s, has transcended its stock market origins to become a valuable tool for forex traders. This method leverages specific price movements and patterns, known as the Darvas Box, to track market trends and make strategic trading decisions. In this article, we’ll break down Darvas’s theory, its rules, and how to apply it to the forex market.
Background of Darvas Box Theory
The Darvas Box Theory originated from the practices of Nicolas Darvas, a dancer turned investor, in the late 1950s. While touring, Darvas sought a method to grow his investment portfolio, leading to the development of his unique strategy. This approach, later known as the Darvas Box Theory, was primarily designed for the stock market but has since been adapted for various asset types, including forex.
The strategy’s effectiveness hinges on the identification of specific price movements and patterns—collectively referred to as the Darvas Box pattern. Nicolas Darvas’s strategy was meticulously detailed in his 1960 book, How I Made $2,000,000 in the Stock Market.
His method revolutionised how traders approached the market, focusing on both the psychological and technical aspects of trading and capturing strong market momentum. While more complex strategies have since emerged, Darvas Box Theory is still regarded as a timeless tool for traders aiming to decipher trends and behaviours.
Understanding the Darvas Box
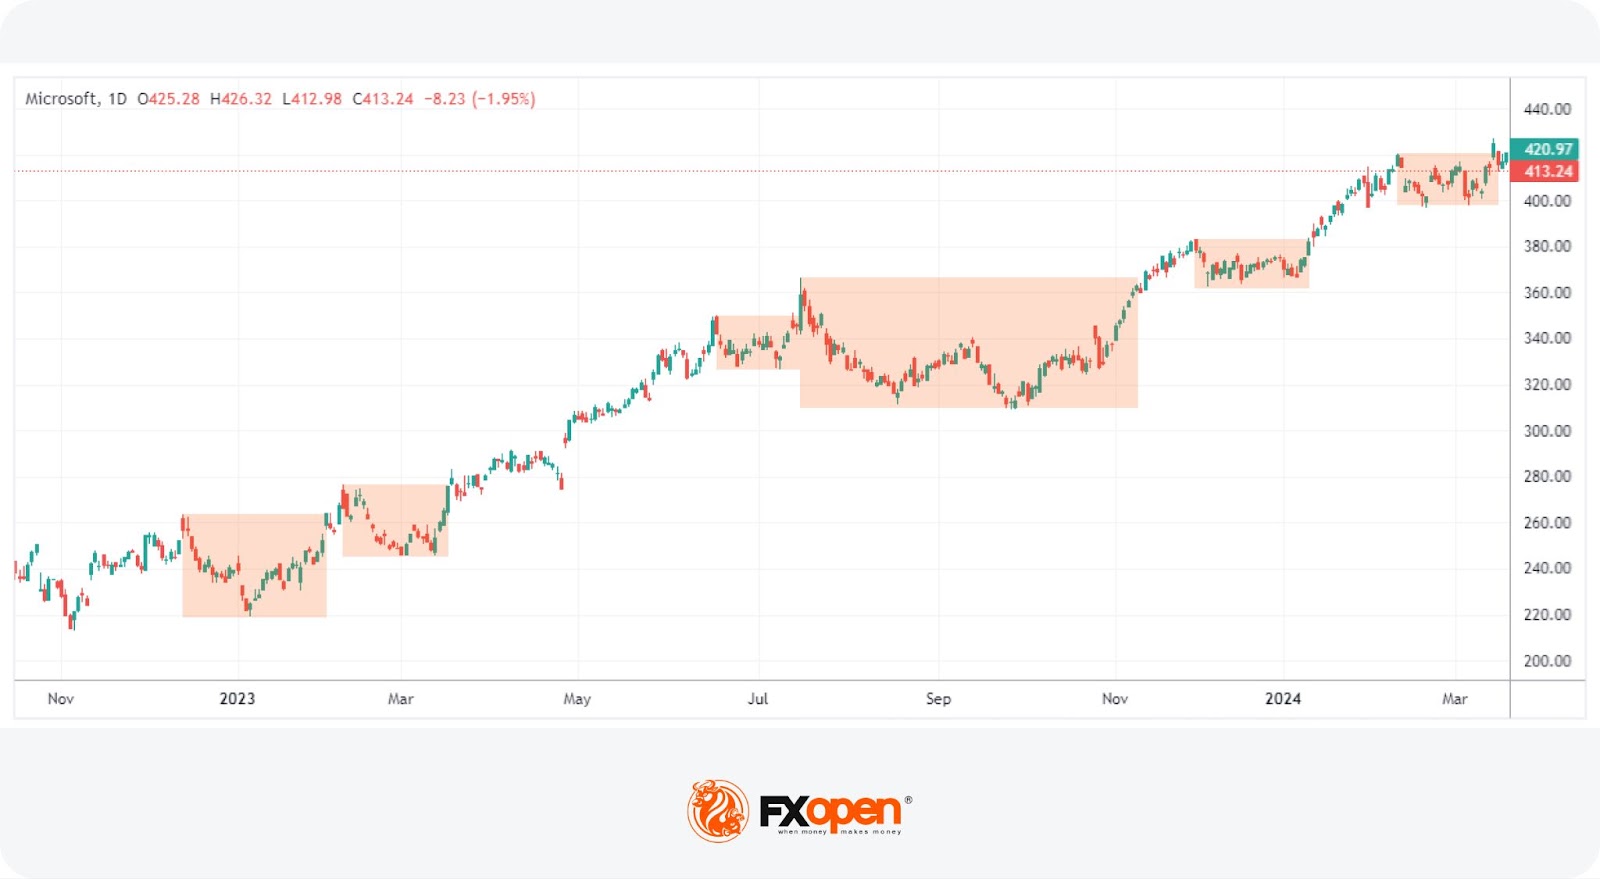
The Darvas Box strategy is built around the concept of "boxes," which are unique graphical representations of stock movements. These boxes serve as a methodical approach to track and capitalise on trends within financial markets.
In essence, a Darvas Box is formed when the price of an asset sets a new high. The line is drawn through the high so that the top of the box represents a level of resistance, while the bottom of the box acts as a support level that the price has touched but not significantly fallen below over a given period.
Darvas would mark stocks making a new 52-week high to identify those with momentum, but this can be scaled to whichever timeframe the trader is interested in; if they’re trading the 1-minute timeframe, this might be a new high over the past 60 minutes (rounding up), or the past two days if trading the 1-hour timeframe (rounding down).
When employing the Darvas Box strategy, traders watch for the price to "breakout" or move beyond the confines of the existing box. This breakout, which should occur at increased volume, according to Darvas, indicates a potential continuation of the trend.
However, this approach didn’t specify when to exit the market. In his book, Darvas explained that he was flexible with his exit points, but he always trailed a stop loss as the price progressed.
Thanks to the simplicity and trend-following nature of Darvas’s boxes, the price failing to form a new box and closing below the bottom of the most recent box—potentially signalling the uptrend is reversing—may be considered a suitable place to exit. However, on occasion, Darvas would tighten or loosen his trailing stop loss, depending on his current returns and market volatility.
To effectively utilise the Darvas Box strategy, traders consider the timing and context of these breakouts. They typically look for several boxes forming in succession, as these patterns may indicate a strong, ongoing trend. The strategy focuses on movements that suggest a real shift in sentiment rather than short-term fluctuations.
Application of Darvas Box in Forex Trading
The Darvas Box trading strategy, originally designed for the stock market, finds a unique application in forex. It provides traders with a structured method to analyse currency pair movements. Forex markets often create distinct trending patterns similar to those observed by Nicolas Darvas in stocks.
While Darvas considered only an upward trend, CFD trading allows for applying this method in both upward and downward trends. If the price rises above the upper boundary of the box, a new box is then formed at a higher level, suggesting an upward trend, while the upper boundary of the previous box may be used as a stop-loss order if the distance between the boxes is large. Conversely, if the price falls below the lower boundary, it might signal a downward trend, and the lower boundary of the previous box might be used as a stop-loss level.
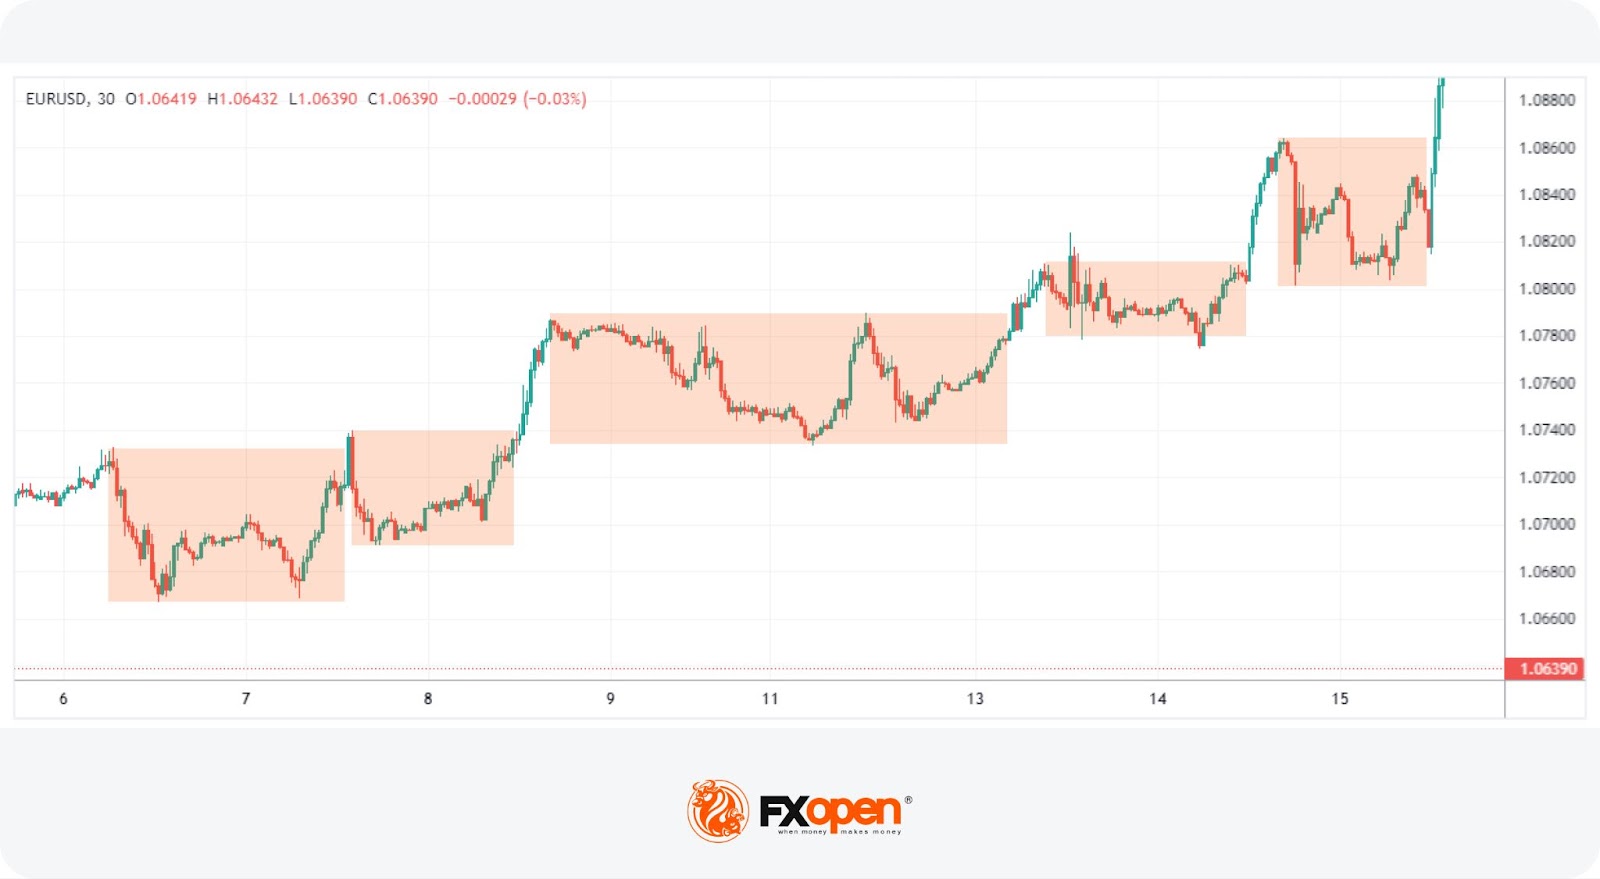
In applying the Darvas Box trading strategy to forex, traders focus on identifying currency pairs that exhibit clear trends and then use the box principles to capture these movements. A key aspect of this strategy in forex involves the recognition of consolidated price ranges followed by a strong breakout. This can signal the continuation of a trend, which is critical in a market where trends can extend over longer periods compared to stocks.
You can see how the rules below can be applied to the forex market using live charts in FXOpen’s free TickTrader platform.
Darvas Box Rules for Forex
- Identifying the Trend: Traders begin by identifying currency pairs with clear uptrends or downtrends. As mentioned, this can involve looking for pairs that are consistently making new highs or lows over a given timeframe. Traders can also use momentum indicators and moving averages to identify trending pairs.
Darvas used fundamental analysis to select his stocks, examining those in growth industries with lots of excitement behind them and strong earnings acceleration. In the forex market, this might look like examining interest rate differentials between two currencies or economic outlooks to gain an idea of a pair’s direction. - Box Formation: Traders establish the criteria for a box. A new box is formed when the price reaches new highs or lows and then consolidates. Darvas looked for a peak followed by three down days to mark the high. For forex traders, this could be three lower or higher candles on their chosen timeframe, demonstrating a clear peak or trough. For an uptrend, the upper edge of the box is set at the new high and the lower edge at the recent consolidation low. For a downtrend, these are reversed.
- Breakout Confirmation: A breakout is confirmed if the price moves beyond the box's upper or lower boundary with increased trading volume. In forex, volume can be substituted with other indicators of market strength, like a specific candlestick pattern, due to the decentralised nature of the market. Darvas avoided positions when the high was broken by just a few ticks.
- Entry and Exit Points: Traders typically enter a trade following a breakout, which suggests that the trend will continue. Exit points may be determined when the price fails to form a new box and instead breaks through the previous box's upper boundary in an uptrend or lower boundary in a downtrend. However, the stop-loss level will depend on the distance between the boxes: the shorter the distance, the further the stop loss may be placed. Stop losses may be trailed above or below the entry’s box to capture the trend.
Example of Darvas Box Theory in Action
In the Darvas trading strategy, traders enjoy simplicity and flexibility, making it adaptable to various markets and supplementary to other trading tools.
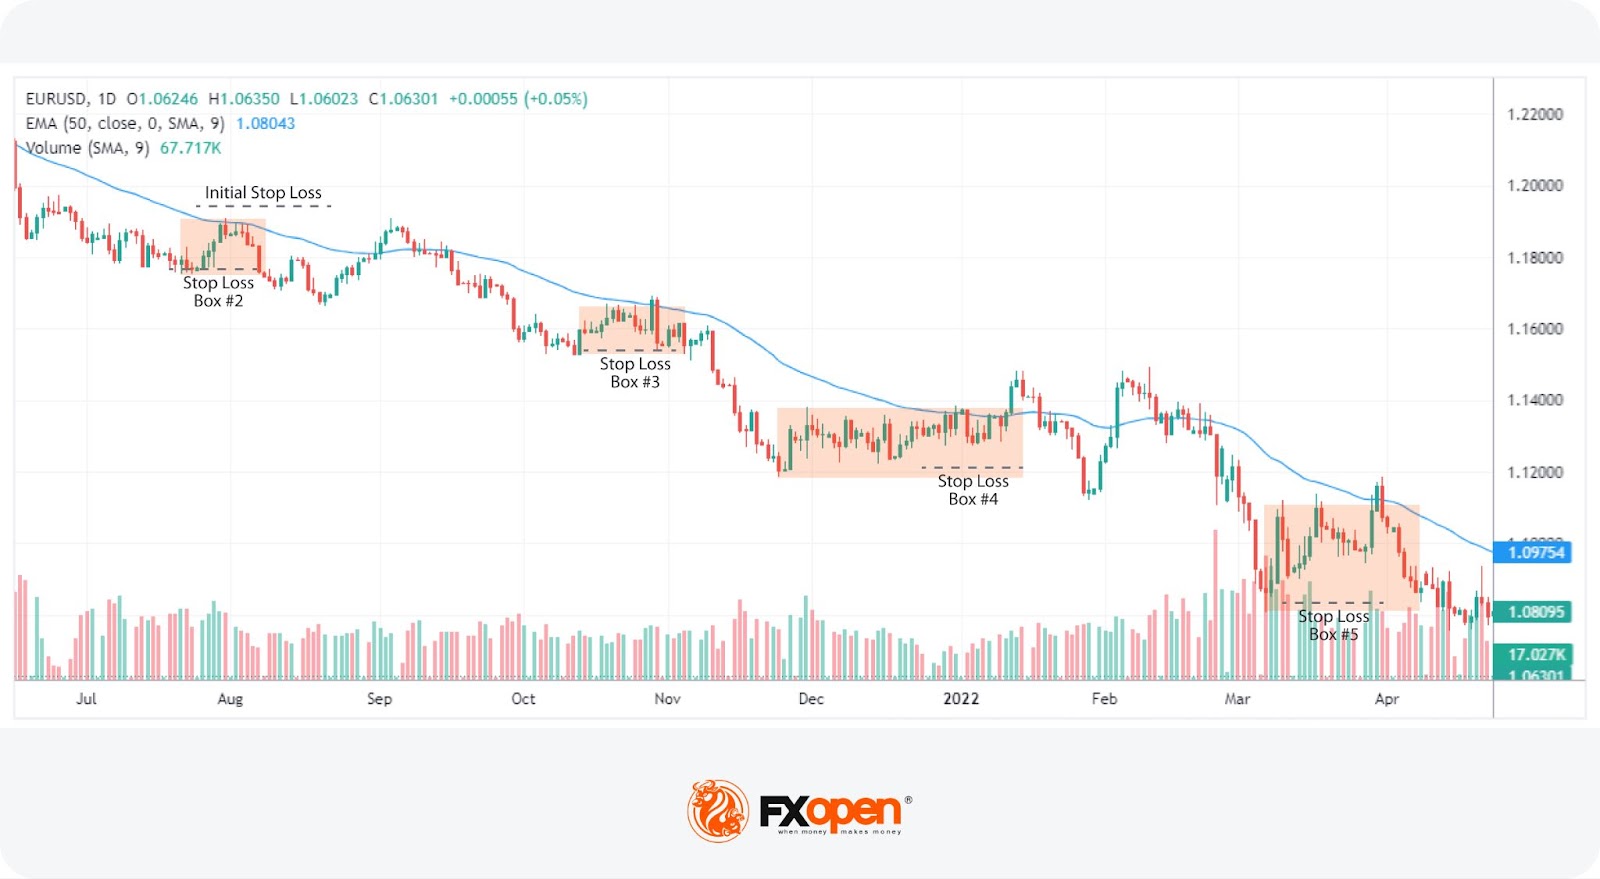
An example of this strategy in action is seen when applying it to the EURUSD currency pair above, using a 50-period exponential moving average (EMA) in blue to ascertain the market's direction. Moving averages can be a useful Darvas box indicator, given that using the slope of the EMA may be an easy way to identify a trend.
The strategy is effective in capturing breakouts. However, to maximise its effectiveness, these boxes must represent a substantial consolidation period—more than just a few candles.
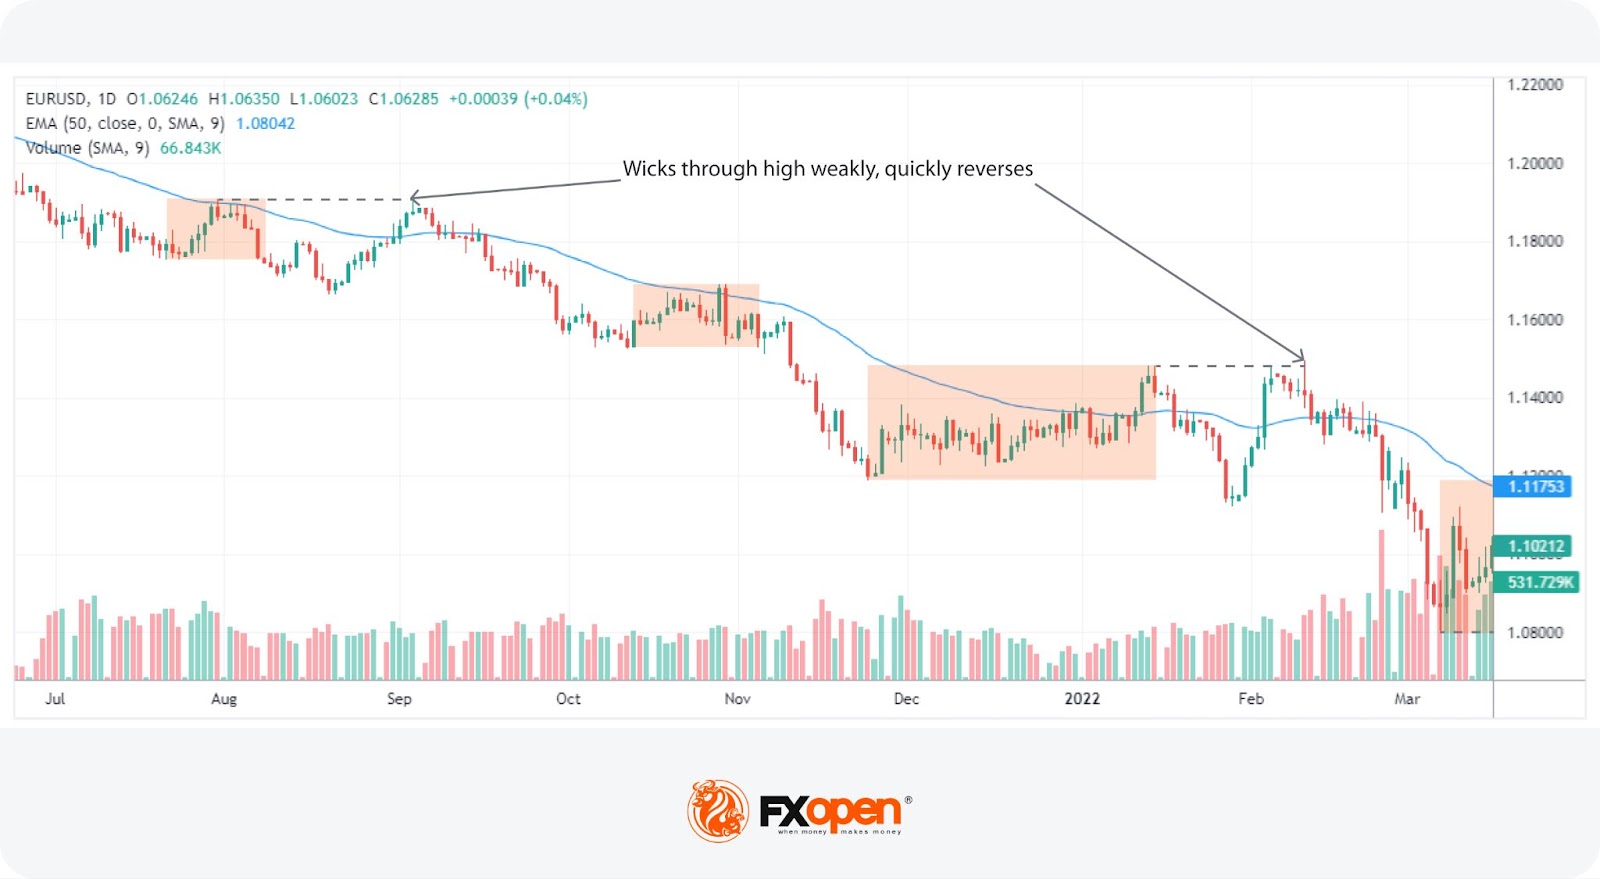
During the observed period, two of the boxes were breached above their high before the downtrend continued. This occurrence underlines the need for some flexibility within the Darvas trading strategy.
In forex markets, where liquidity grabs and bull/bear traps are common, setting a stop loss slightly above the box's high/low might help manage risks. If a strong upward candle triggers the stop loss, it might indicate a potential reversal and prompt the trader to stop following the trend. However, on these occasions, the break upward was weak and quickly reversed, implying that it was still valid to follow the trend.
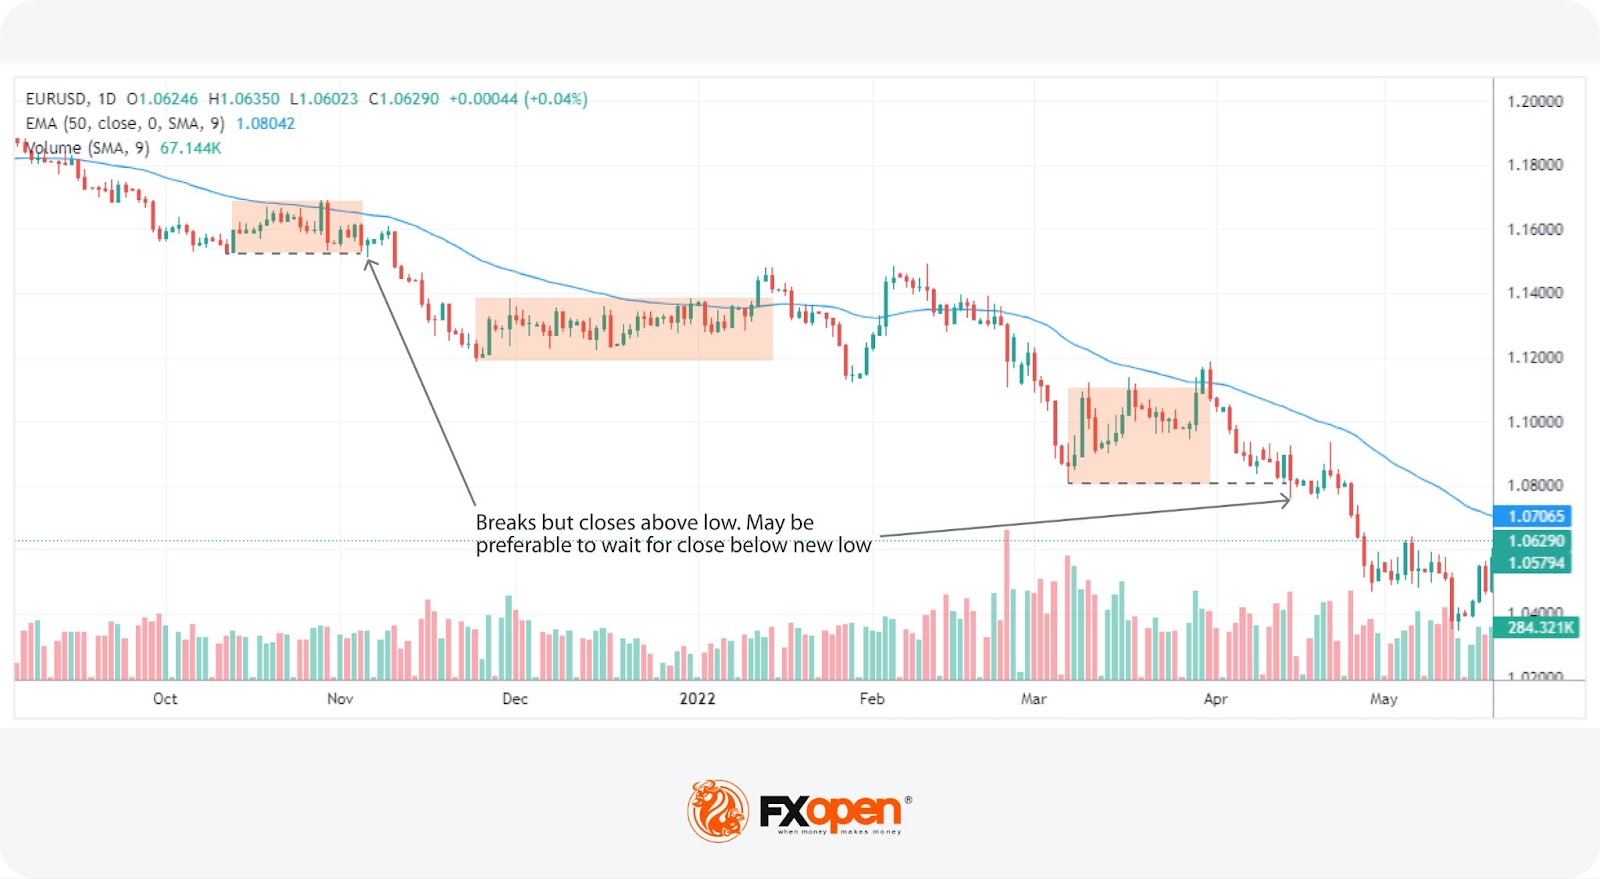
Moreover, there were instances where a wick marginally broke the box’s low without a decisive downward continuation. In such cases, traders might look for a candle to close below this new low before considering it a valid breakout and entering the trade. This cautious approach helps filter out false signals, reinforcing the strategy's utility in capturing genuine price movements.
The Bottom Line
The Darvas Box Theory offers a robust framework for navigating the complexities of forex trading. By utilising this strategy, traders can systematically analyse price trends and make more informed decisions. To further enhance your trading journey, consider opening an FXOpen account, where advanced tools and comprehensive support may help you apply these insights effectively in your trading endeavours.
FAQs
What Is the Darvas Box Indicator?
There is actually no Darvas Box indicator. The Darvas Box is a part of the Darvas Box theory that identifies areas of price consolidation on a chart. The boxes highlight levels where an asset has fluctuated within a defined price range, helping traders visualise potential breakout points.
What Is the Darvas Box Breakout?
A Darvas Box breakout occurs when the price of an asset exceeds the upper or lower boundaries of the established range. This breakout is typically seen as a signal that the existing trend is likely to continue, prompting traders to make strategic decisions.
How to Use Darvas Box in Day Trading?
In day trading, the Darvas Box can be used to spot short-term price movements and breakouts. Traders monitor these boxes for closures above or below the boundaries, using them to inform quick entry and exit decisions in the fast-paced trading environment.
This article represents the opinion of the Companies operating under the FXOpen brand only. It is not to be construed as an offer, solicitation, or recommendation with respect to products and services provided by the Companies operating under the FXOpen brand, nor is it to be considered financial advice.
Stay ahead of the market!
Subscribe now to our mailing list and receive the latest market news and insights delivered directly to your inbox.


Latest articles

AI Valuations Are Back in the Spotlight
Artificial intelligence remains the dominant investment theme of 2026, but investors are increasingly questioning whether AI stock valuations are keeping pace with reality.
💰 Big Tech continues to invest at an unprecedented scale, with hyperscaler AI spending projected to exceed $800

AUD/CAD: Months of Indecision — Is a Breakout Finally Coming?
The Australian dollar has clawed back most of its end-of-June losses, when it touched three-month lows against the greenback amid escalating Middle East tensions. Since then, sentiment has improved: the RBA's Assistant Governor Sarah Hunter signalled the board stands ready

USD/JPY: Battling at the Top of the Triangle
On 3 July, Japan's Finance Minister, Satsuki Katayama, stated that the Ministry of Finance remains in close contact with US authorities regarding developments in USD/JPY as the yen traded near its weakest level in almost 40 years. Similar verbal