


What Is a Whipsaw, and How Can One Trade It?
FXOpen
A whipsaw occurs when a market exhibits sharp price movements in one direction, followed by a sudden reversal. This pattern can mislead traders and often leads to significant losses if not managed properly. This article explores the causes, identification, and approaches to navigating whipsaws.
Understanding a Whipsaw in Trading
A whipsaw pattern occurs when a market exhibits sharp price movements in one direction, followed by a sudden reversal. This pattern can be particularly challenging for traders, as it often leads to significant losses if not properly managed. In essence, a whipsaw is a series of rapid, unexpected price changes that can quickly lead to a loss.
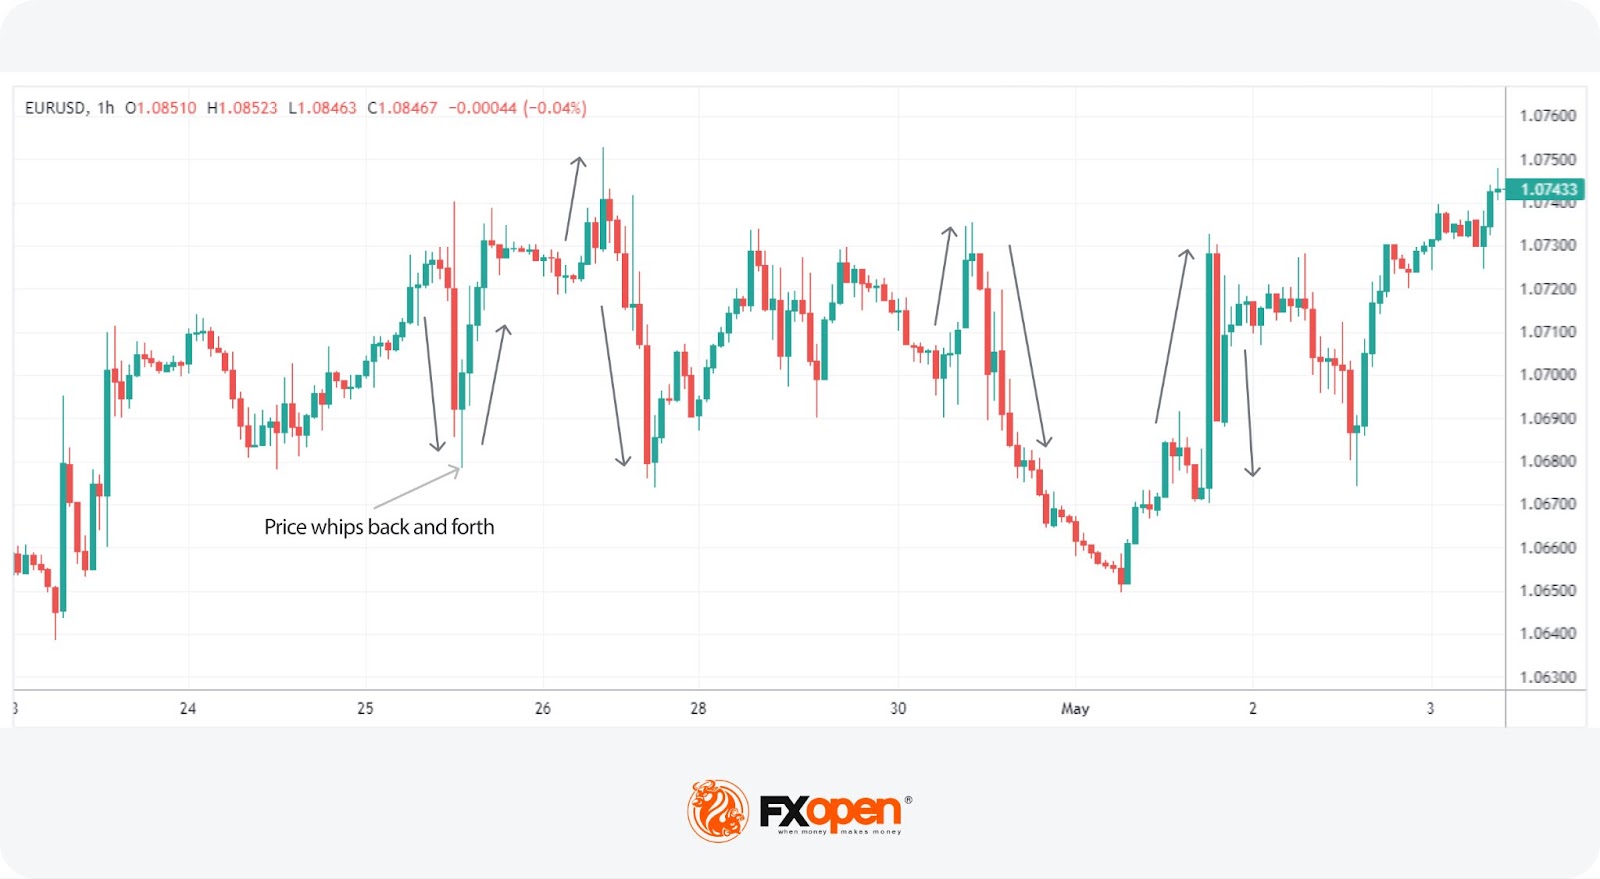
Whipsaws are common in volatile markets and can be triggered by a variety of factors, including sudden economic news, unexpected geopolitical events, or shifts in market sentiment. In a whipsaw example, the EUR/USD pair broke through a new high, attracting buyers who believed the uptrend would continue. However, the price then reversed sharply, causing those traders to incur losses. After, the price turned around and set a new high but turned down again.
Understanding whipsaws is crucial for traders because these patterns can occur across various timeframes, from intraday charts to weekly or monthly ones. Still, those who trade on low timeframes are more susceptible to losses due to smaller capital and tighter stop-loss levels. Recognising the potential for a whipsaw helps traders remain cautious and avoid over-committing to a position based solely on initial price movements.
Understanding Whipsaw Trading
Recognising a whipsaw involves identifying its distinct characteristics and understanding the market conditions that typically accompany it.
Characteristics of a Whipsaw
A whipsaw is recognised by its sharp and rapid price movements in opposing directions, usually within a short timeframe. The key characteristics include:
- Sudden Price Reversals: Prices often spike up or down, quickly followed by a reversal in the opposite direction.
- High Volatility: Whipsaws occur in highly volatile markets where prices are sensitive to news and events.
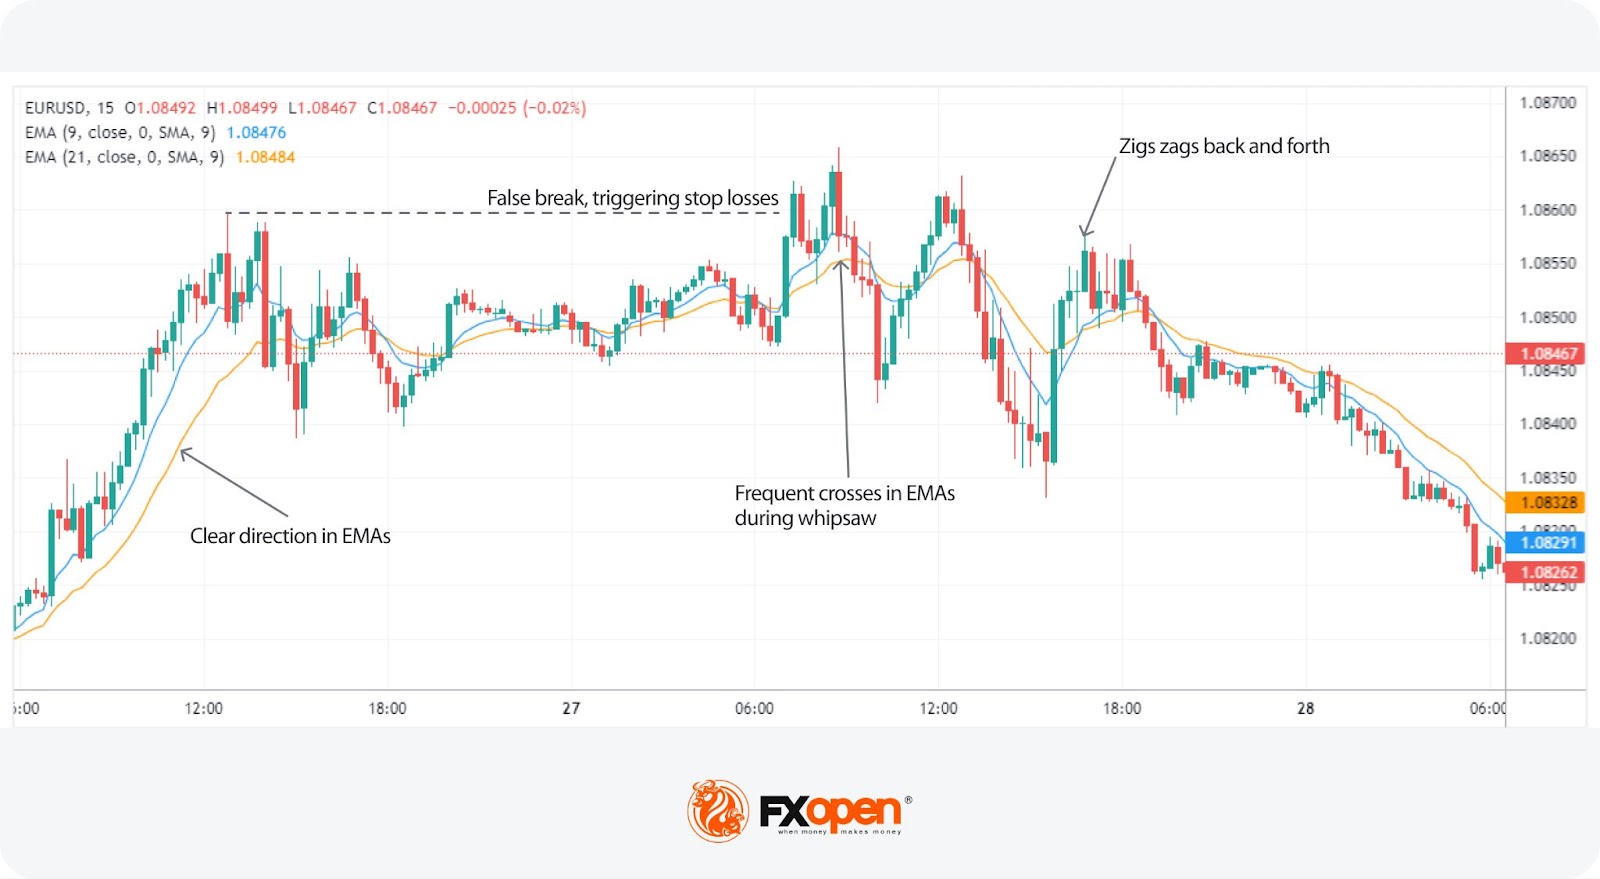
- False Breakouts: A common feature is a false breakout, where prices breach a support or resistance level briefly before reversing.
- Stop-Loss Triggers: These patterns frequently hit traders' stop-loss levels due to abrupt reversals, causing unexpected exits from trades.
Identifying a Whipsaw
To spot a whipsaw, traders typically look for the following indicators and conditions:
- Chart Patterns: Whipsaws are visually apparent on charts as sharp zigzag patterns. Traders often see a price move beyond a support or resistance level, followed by a swift reversal.
- Momentum Indicators: For example, traders use RSI to gauge momentum. Whipsaws may be identified when the RSI shows overbought or oversold conditions followed by rapid corrections.
- Candlestick Patterns: Specific candlestick formations, such as doji or spinning tops, can indicate indecision in the market, which is a precursor to a whipsaw.
- Moving Averages: When short-term moving averages cross above or below long-term moving averages briefly before reversing, it may signal a whipsaw.
To access these tools and identify patterns in real time, head over to FXOpen’s free TickTrader platform to get started with live charts.
Examples and Timeframes
Whipsaws can occur across different timeframes, from one-minute to daily or weekly charts. For instance, in intraday trading, a whipsawed stock might break out during the first hour of trading due to news, only to reverse sharply by midday. On hourly charts, earnings announcements can trigger whipsaws as initial investor reactions swing prices sharply before settling.
Causes of Whipsaws
A whipsaw, meaning a sharp and rapid price reversal, can occur due to several market events. Understanding these causes can help traders navigate and anticipate these volatile movements.
Market Volatility
High market volatility is a primary cause of whipsaws. When prices react intensely to news, economic data, or geopolitical events, the market becomes highly volatile. This rapid reaction can cause significant price swings in both directions, creating the whipsaw effect.
Sudden News or Events
Unexpected news or events, such as earnings reports, economic indicators, or geopolitical developments, can trigger whipsaws. For instance, a positive earnings report might initially drive prices up, only for a negative market sentiment or broader economic concern to quickly reverse this movement.
Liquidity and Market Depth
Low liquidity and shallow market depth often contribute to whipsaws. In markets with fewer participants or limited order sizes, large trades can disproportionately impact prices, causing sharp movements and subsequent reversals as the market absorbs these orders.
Algorithmic Trading
High-frequency trading and algorithmic trading can amplify whipsaws. These automated systems execute large volumes of trades at high speeds, often reacting to the same market signals simultaneously. This can lead to exaggerated price movements followed by rapid reversals.
Trader Behaviour
Emotional reactions from traders, such as panic selling or greedy buying, can cause whipsaws. When traders react impulsively to market movements, they contribute to the rapid up-and-down price swings characteristic of whipsaws. This behaviour is often driven by fear of missing out (FOMO) or fear of loss.
How to Approach Whipsaws
Navigating whipsaws requires a combination of strategic planning and disciplined execution. Traders can potentially mitigate risks and manage their positions by following several key principles.
Higher Timeframe Bias
Maintaining a higher timeframe (HFT) bias is crucial. By analysing longer-term charts, traders can identify the broader market trend, which can help maintain confidence during short-term whipsaws. This perspective may prevent knee-jerk reactions to minor fluctuations and align decisions with the overall market direction.
Confluence of Factors
When in a trade, seeking multiple factors of confluence is essential. This includes aligning technical indicators, chart patterns, and volume analysis with the HTF bias. A strong confluence of signals may provide greater confidence, reducing the likelihood of emotional reactions during volatile whipsaw events.
Risk Management Strategies
During a whipsaw, traders use three primary risk management options:
Do Nothing
Traders might choose to do nothing if they can justify that the whipsaw is a minor swing relative to their trade idea. If the price is already far from their stop loss, holding the position might be justified. This approach requires a solid rationale to avoid emotional decisions.
Trim Position Size
Reducing the position size, typically by half, decreases exposure to potential losses while remaining in the trade. This strategy allows the trade more time to work out without the full risk of a volatile market.
Move the Stop Loss
Moving the stop-loss level to a potentially safer, more distant level can potentially avoid being stopped out by volatility. However, this should be accompanied by reducing the position size to maintain consistent risk. For example, if a trader initially risks 1% with a 10-pip stop loss, moving the stop to 20 pips should be matched by closing half the position to continue risking only 1%.
Exiting or Staying Flat
In some cases, traders prefer to exit the position or stay flat until more confidence in the market direction is achieved. If a whipsaw is occurring, exiting around breakeven or at a slight loss might prevent the mental stress of watching a position swing back and forth. This approach can potentially preserve capital and emotional stability, enabling a clearer mindset for future trades.
Common Mistakes to Avoid
Navigating whipsaws can be challenging, and traders often make several avoidable mistakes. Understanding these pitfalls might help in managing trades more effectively.
Overtrading in Volatile Markets
Overtrading during high volatility is a common error. Traders often react impulsively to sharp price movements, entering and exiting positions too frequently. This can lead to increased transaction costs and reduced overall returns.
Ignoring Fundamental Analysis
Relying solely on technical analysis without considering fundamental factors can be detrimental. Economic data, news events, and geopolitical developments can drive whipsaws. Ignoring these elements can result in unexpected and adverse price movements.
Misinterpreting Market Signals
Traders sometimes misinterpret market signals, confusing a whipsaw with a genuine trend reversal. This misinterpretation can lead to premature exits from effective trades or entry into losing positions. Careful analysis and confirmation across multiple indicators can help potentially mitigate this risk.
Neglecting Risk Management
Failing to adjust risk management strategies during a whipsaw is a critical mistake. Traders might leave stop losses too tight, leading to unnecessary exits, or fail to reduce position sizes, increasing potential losses. Effective risk management, including appropriate stop-loss placement and position sizing, is crucial.
Emotional Trading
Emotional reactions to market volatility can cloud judgement. Panic selling or greedy buying often exacerbates losses. Maintaining discipline and sticking to a well-thought-out trading plan can help in avoiding decisions driven by fear or greed.
The Bottom Line
Whipsaws are challenging yet common patterns in volatile markets, characterised by sharp price movements and sudden reversals. Understanding their causes, identifying their characteristics, and employing strategic approaches can help traders navigate these turbulent conditions. Open an FXOpen account to access advanced trading tools and resources that might enhance your trading strategies and help you navigate market volatility with confidence.
FAQs
What Is a Whipsaw in Trading?
In trading, a whipsaw refers to a scenario where the price of a security moves in one direction but then quickly reverses direction, resulting in rapid and often unexpected gains and losses. This phenomenon can be highly frustrating and costly for traders, particularly those who employ trend-following strategies, as it makes it difficult to analyse market trends.
What Does Whipsawed Mean in Stocks?
Being whipsawed in stocks means a trader experiences a sharp price movement in one direction followed by an immediate reversal. This often results in triggering stop-loss orders and causing traders to exit positions at a loss, only for the price to revert to its original trend shortly after.
How to Avoid Whipsaws in Trading?
To avoid whipsaws, traders typically maintain a higher timeframe bias, seek the confluence of multiple indicators, and employ robust risk management strategies. Reducing position size, carefully placing stop-loss orders, and avoiding impulsive trading decisions are essential techniques to mitigate the effects of whipsaws.
This article represents the opinion of the Companies operating under the FXOpen brand only. It is not to be construed as an offer, solicitation, or recommendation with respect to products and services provided by the Companies operating under the FXOpen brand, nor is it to be considered financial advice.
Stay ahead of the market!
Subscribe now to our mailing list and receive the latest market news and insights delivered directly to your inbox.


Latest articles

GBP/CHF: Trendline or RSI — Which One Is Lying?
Sterling enters this week on firmer footing, with political uncertainty fading fast after Andy Burnham's confirmation as Labour leader eased investor concerns over the succession to Keir Starmer. Markets reacted further to reports pointing to Shabana Mahmood as the frontrunner

Silver Attempts to Break Out of Its Range
Silver continues to balance between its dual role as an industrial metal and so-called refuge asset, and this combination largely explains the lack of a clear trend in recent weeks. Shifting expectations for central bank interest rates can influence the

Nasdaq 100: Is This the Correction Traders Have Been Waiting For?
The Nasdaq 100 (US Tech 100 Mini on FXOpen) remains caught between two opposing forces: cooling inflation on one side, and persistent geopolitical instability on the other. On 14 July, June's CPI print came in softer than expected, easing near-term