


Dual Candlestick Patterns
FXOpen
A double candlestick pattern is a combination of two candlesticks that form together and are used in technical analysis to predict the direction in which the price of an asset is likely to move in the future. They are an essential tool for technical analysts in identifying potential reversals or the continuation of a trend. Read the guide to learn what an engulfing candle pattern is and how to use tweezers in Forex trading.
Trading with a Double Candlestick Pattern
There are many different 2 candlestick patterns, each with its own set of rules and characteristics, such as the engulfing candles or tweezer top and bottom. It is vital to confirm the trend before making a trade, as these setups are more common when they occur after a downtrend or an uptrend, suggesting a potential reversal.
Also, experienced traders consider the overall market context when interpreting double candlesticks, as factors such as the volume, volatility, and general sentiment of the market may affect the reliability of the setup.
What Is an Engulfing Сandlestick?
The engulfing pattern is a two-candle pattern that shows a strong market reversal sign. The idea is that the first candlestick is immediately followed by a larger one in the opposite direction. The engulfing candle pattern types are Bullish Engulfing and Bearish Engulfing.
- A Bullish Engulfing occurs when a bearish candle is followed by a more significant bullish candle at the end of a downtrend where the latter engulfs the former, indicating a potential upward trend reversal. The pattern shows that bulls are outperforming bears. The length of the body determines the probability of a trend reversal — the shorter the bearish candle and the longer the bullish one, the higher the probability.
- A Bearish Engulfing occurs when a bullish candle is followed by a larger bearish one at the end of an uptrend, alerting investors to a potential downward reversal. The pattern shows that bears are outperforming bulls. The length of the candles again determines the probability of a trend reversal — the shorter the bullish candlestick and the longer the bearish one, the higher the probability.
You may use the TickTrader platform to explore technical analysis tools and charts.
What Are Tweezer Top and Bottom?
Tweezer Top and Bottoms are reversal setups formed by candlesticks with matching highs or lows. They are typically seen at the end of an extended uptrend or downtrend.
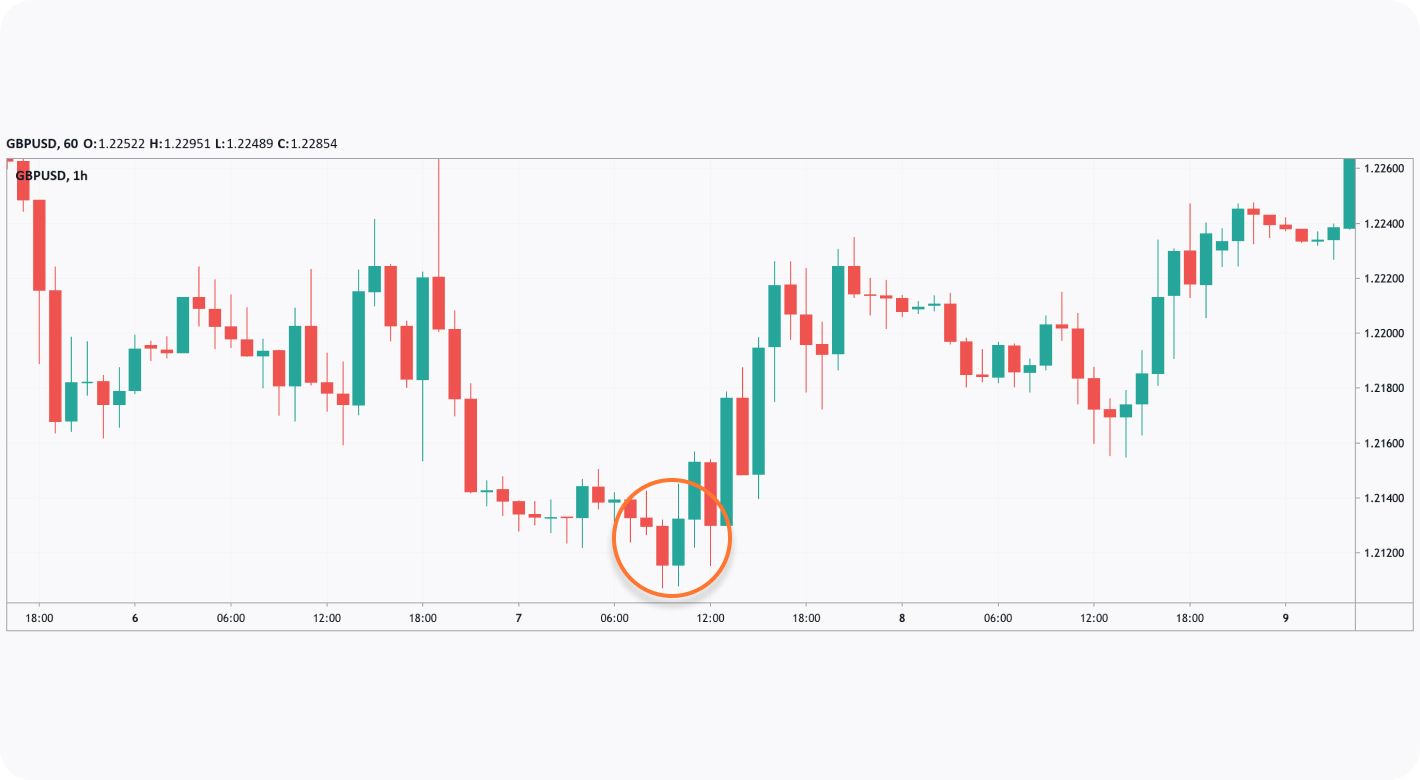
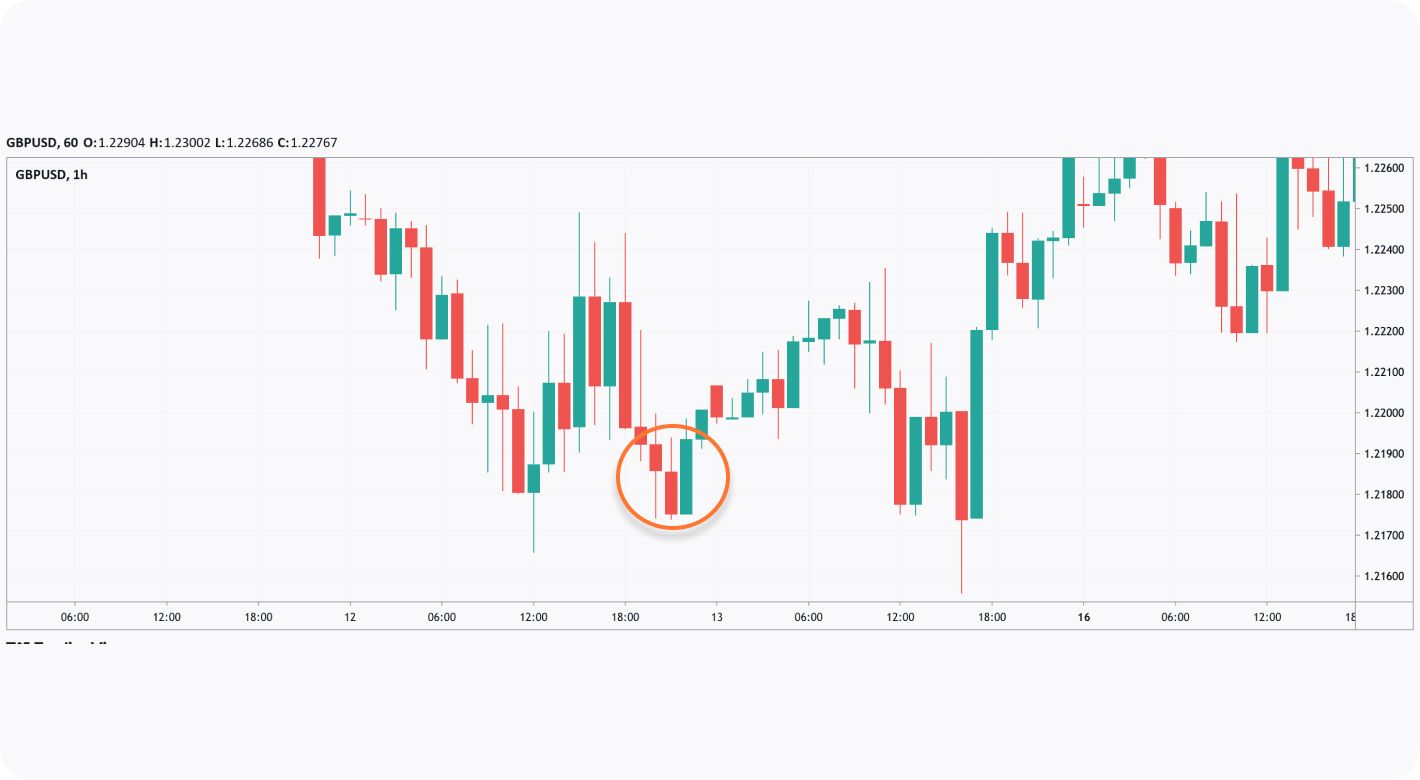
- A Tweezer Bottom provides a bullish signal appearing at the end of a downtrend. It is made up of two candlesticks with very similar lows. The first is bearish with a medium-length shadow beneath it. The second is bullish and can have any size, but if it’s bigger than the first one, the signal is stronger. The pattern reflects market uncertainties as the downtrend doesn’t continue. It’s confirmed if the consecutive candles are also bullish.
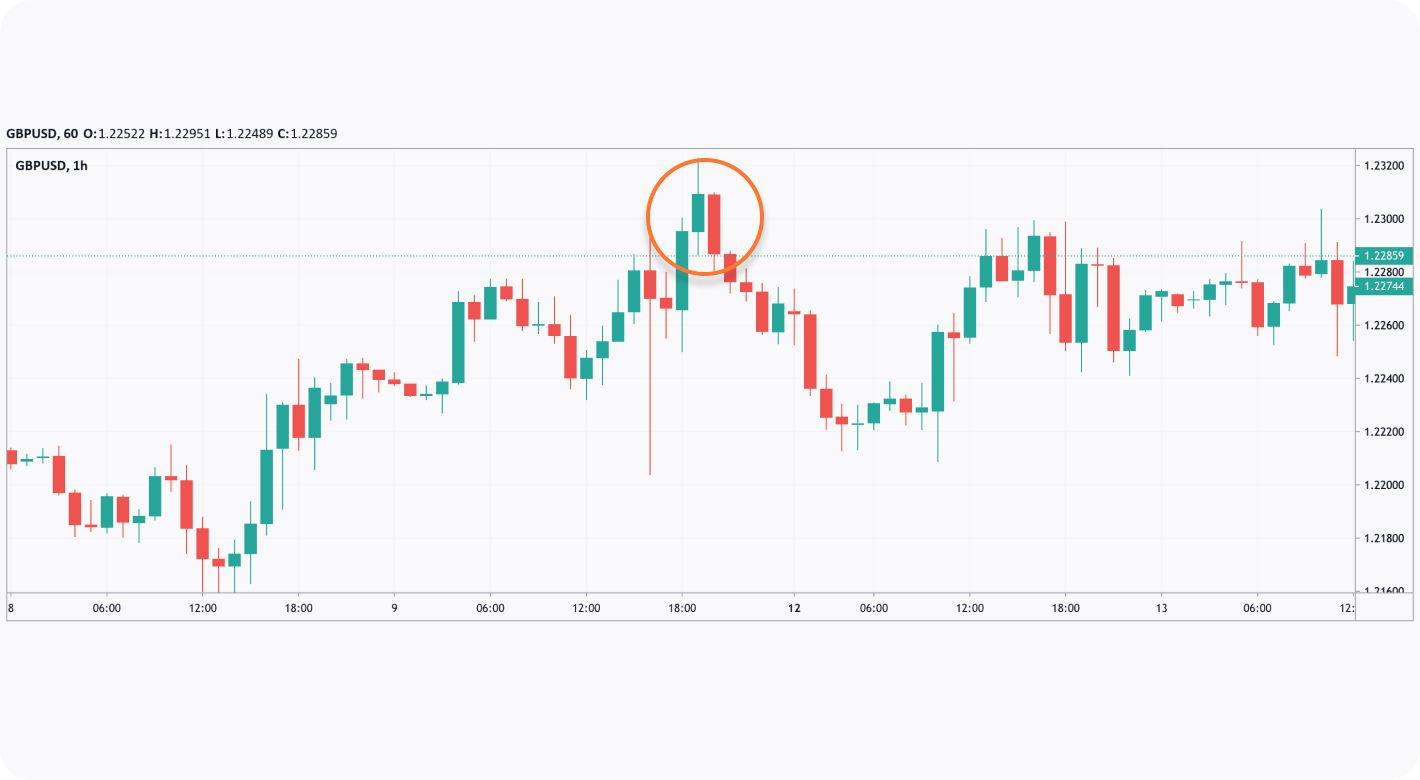
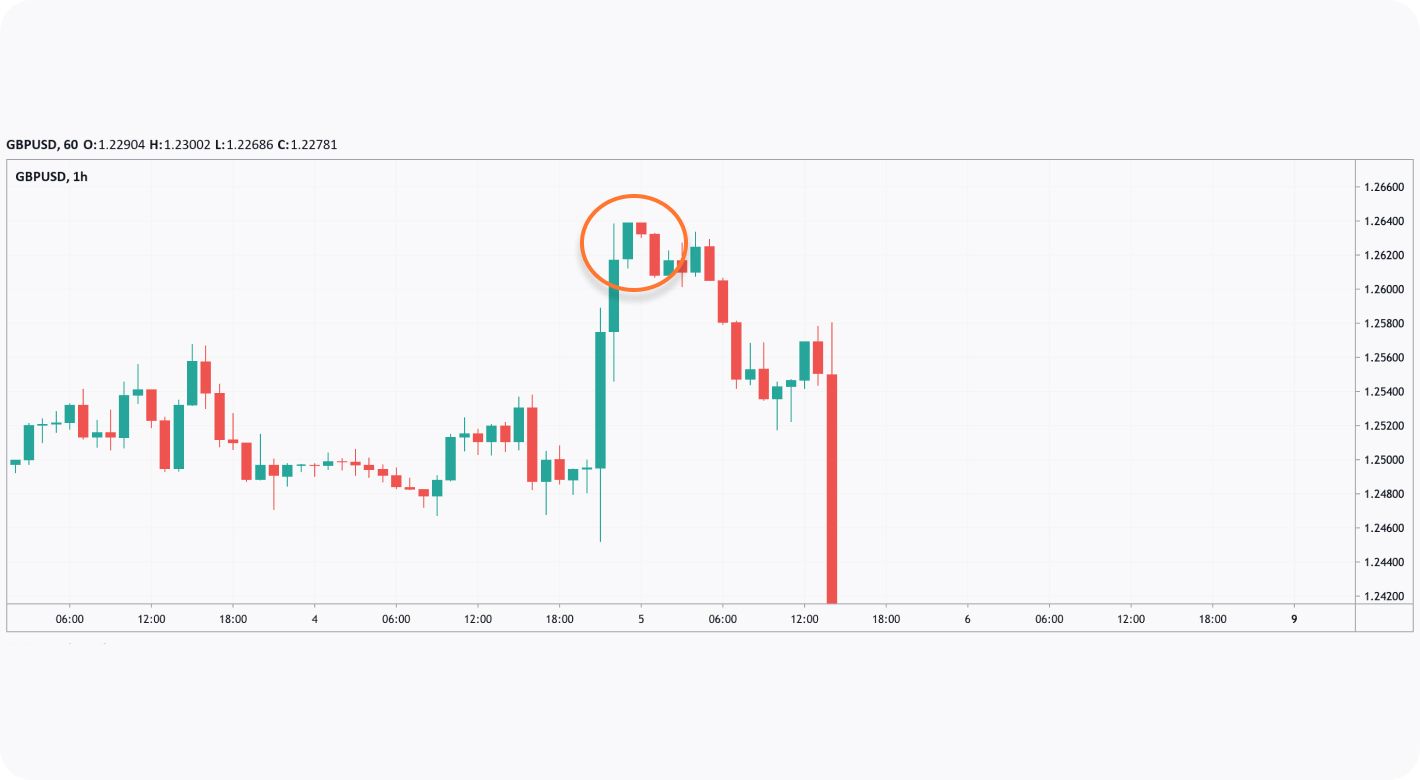
- A Tweezer Top is a bearish reversal setup that appears at the peak of an uptrend. The first bullish candle shows a rejection of higher prices, while the second bearish candle tends but fails to surge higher. This indicates that resistance is strong, and the market may fall or consolidate. The second candle may have any size, but if it’s more significant than the first one, the signal is stronger.
Final Thoughts
As two candle patterns occur on a price chart often and may provide strong signals, traders consider incorporating them as a part of their analysis when making trading decisions. Aside from using patterns as a separate tool, traders combine them with technical indicators to get more reliable alerts on price movements.
You may open a live trading account at FXOpen to examine charts and trade in the Foreign Exchange market.
This article represents the opinion of the Companies operating under the FXOpen brand only. It is not to be construed as an offer, solicitation, or recommendation with respect to products and services provided by the Companies operating under the FXOpen brand, nor is it to be considered financial advice.
Stay ahead of the market!
Subscribe now to our mailing list and receive the latest market news and insights delivered directly to your inbox.

Latest articles

AI Valuations Are Back in the Spotlight
Artificial intelligence remains the dominant investment theme of 2026, but investors are increasingly questioning whether AI stock valuations are keeping pace with reality.
💰 Big Tech continues to invest at an unprecedented scale, with hyperscaler AI spending projected to exceed $800

AUD/CAD: Months of Indecision — Is a Breakout Finally Coming?
The Australian dollar has clawed back most of its end-of-June losses, when it touched three-month lows against the greenback amid escalating Middle East tensions. Since then, sentiment has improved: the RBA's Assistant Governor Sarah Hunter signalled the board stands ready

USD/JPY: Battling at the Top of the Triangle
On 3 July, Japan's Finance Minister, Satsuki Katayama, stated that the Ministry of Finance remains in close contact with US authorities regarding developments in USD/JPY as the yen traded near its weakest level in almost 40 years. Similar verbal