


FXOpen
Moving averages (MAs) are commonly used in technical analysis; in fact, they are among the first indicators traders will consult when forming a trading strategy.
There are several types of averages, including simple moving averages (SMAs), weighted moving averages (WMAs), and exponential moving averages (EMAs). In this FXOpen guide, we look at the MA vs EMA vs WMA and explore how to use an MA indicator in your trading analysis.
What Is an MA in Trading?
Traders use moving averages to observe price movement over a given period. Each moving average indicator is represented by a line that moves along a chart as the average value changes, smoothing out price fluctuations. The indicators identify trends and trend reversals to inform traders when they might buy and sell. The main difference between the averages is the weight given to changes in the pricing data.
MAs are widely used for building other technical indicators; for instance, the moving average convergence/divergence (MACD) momentum indicator and Bollinger Bands.
Trading platforms like TickTrader provide chart indicators for different types of moving average meaning you don’t need to calculate them manually, you just need to adjust the indicator to the number of periods you want to analyse.
What Is a Simple Moving Average?
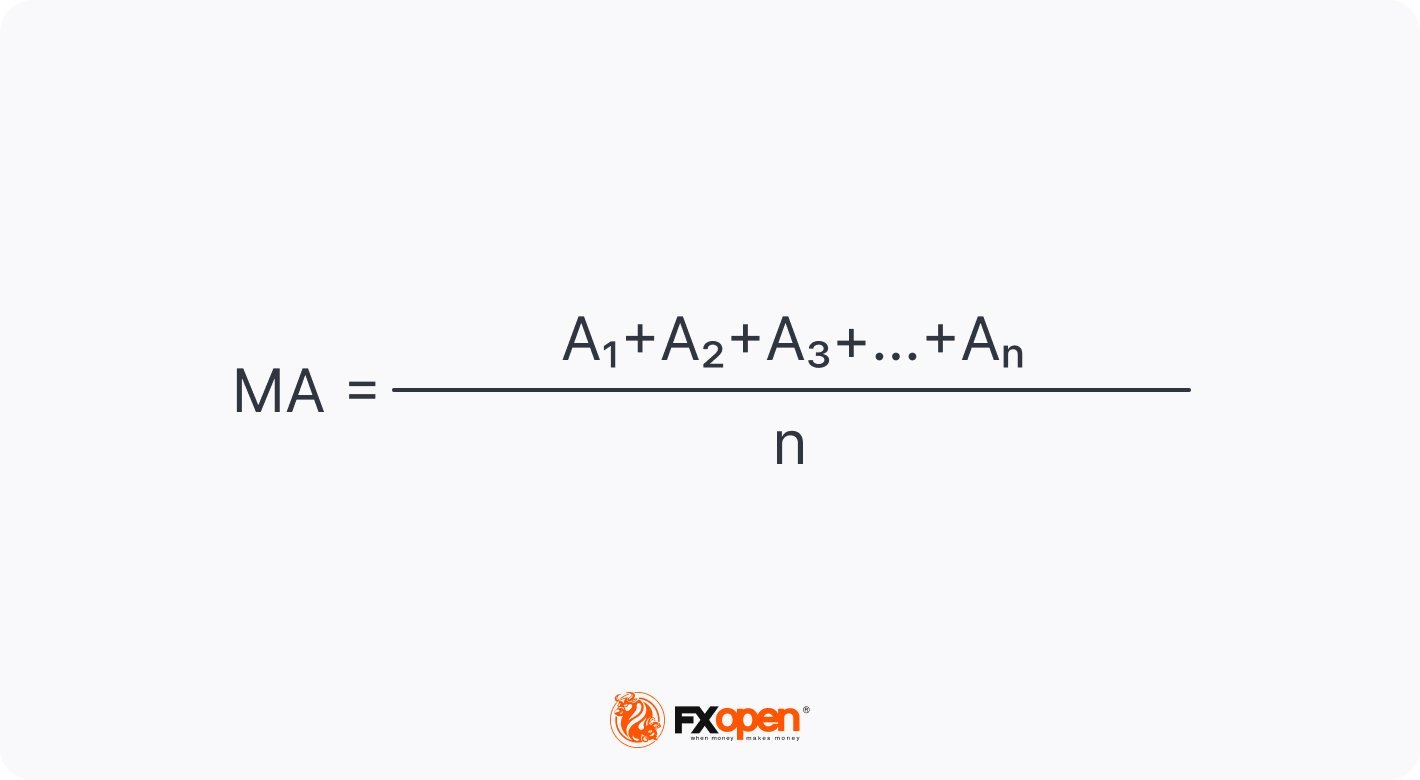
The simple moving average was the first type of MA traders used in technical analysis, and this is because it is straightforward to calculate. The average is the sum of the data points for the specified period divided by “n”, representing the number of periods. It applies equal weighting to each data point.
The calculation typically uses closing prices, but it can also analyse other data, such as opening prices or median prices. The average moves over time as the oldest value from the series is removed when a new period is added.
Traders often look at 9, 21, 50, 100, and 200 periods. For example, a 20-day MA is the average closing value for an asset over the last 20 days. On the next day, the most recent closing price is added, and the oldest value is dropped from the calculation.
MAs are smoother when measuring longer periods, although they introduce a greater lag between the moving average and the price being analysed.
What Is a Weighted Moving Average?
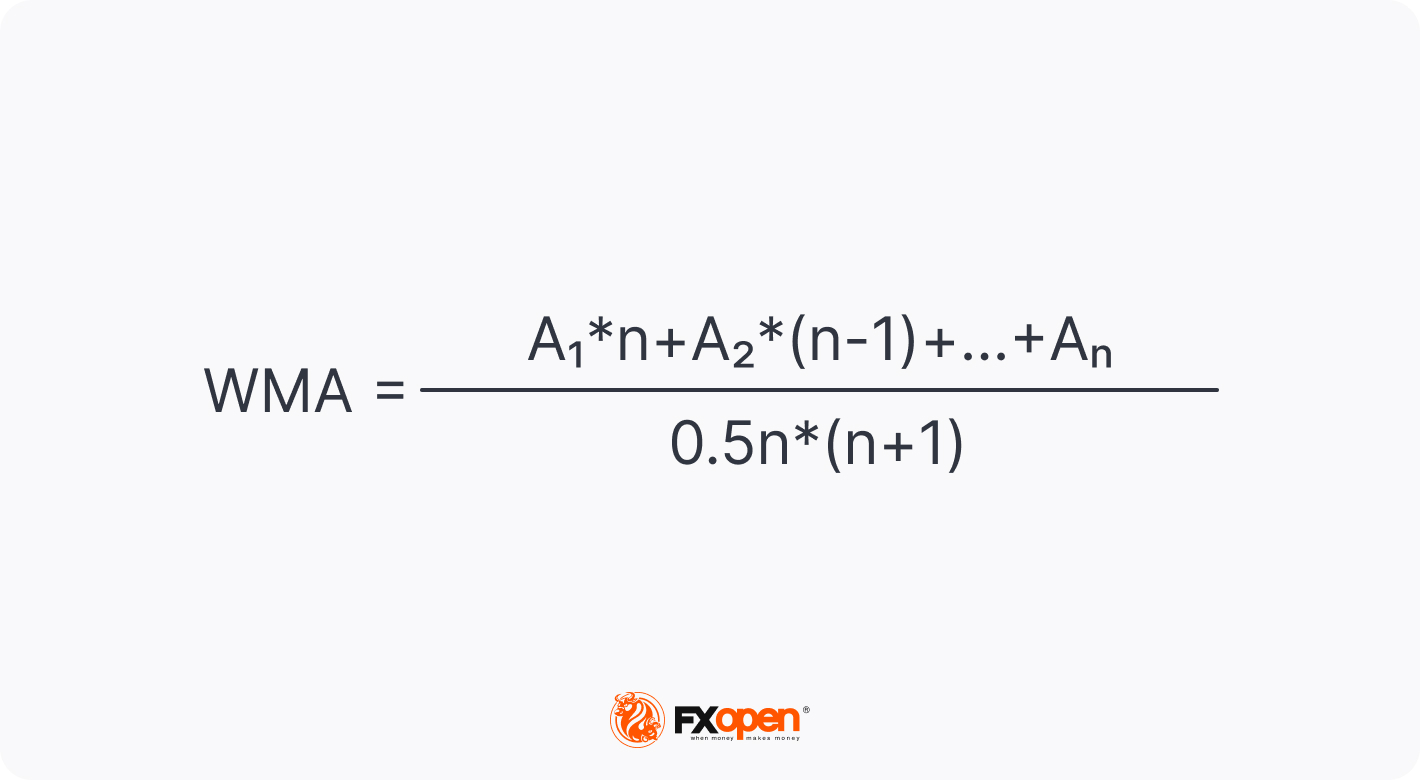
What is a weighted moving average definition? A weighted MA is a type of moving average that gives more weight to the most recent data in the series. The newest data has a stronger impact on the direction of the line, so the WMA follows prices more closely than an MA.
The moving average calculation multiplies each input by a weighting factor. The weighting factor is defined by the period being analysed, represented by “n” in the formula. The reason most WMAs give a higher weighting to the most recent data points is due to the fact that they are more relevant to the current price action, but the formula can also be customised to give more weight to historical data if the trader is examining long-term price trends or wants to de-emphasise recent volatility.
There are four steps to calculate a weighted moving average:
- Identify the numbers from which to calculate the average
- Determine the weighting factor for each number based on the number of periods
- Multiply each number by the weighting factor and add up the values
- Add the periods together and divide the total value by the sum
To take a weighted moving average example over three days, if a stock closed at $61, $58 and $63, the calculation would be based on a weighting of 6 for the $63 close on the most recent day, 2 for the $58 close on the second most recent day and 1 for the furthest close at $61. The 3-period weighted moving average calculation based on the formula would be: [(3 x 63) + (2 x 58) + (1 x 61)] = 366 / (1 + 2 + 3) = 61.
How is the WMA different from the MA? As it places more emphasis on more recent data, the weighted MA tends to be more sensitive to price changes. It has a shorter delay and offers the ability to identify trends faster.
What Is an Exponential Moving Average?
Like the weighted moving average, the exponential moving average formula places more emphasis on recent data.
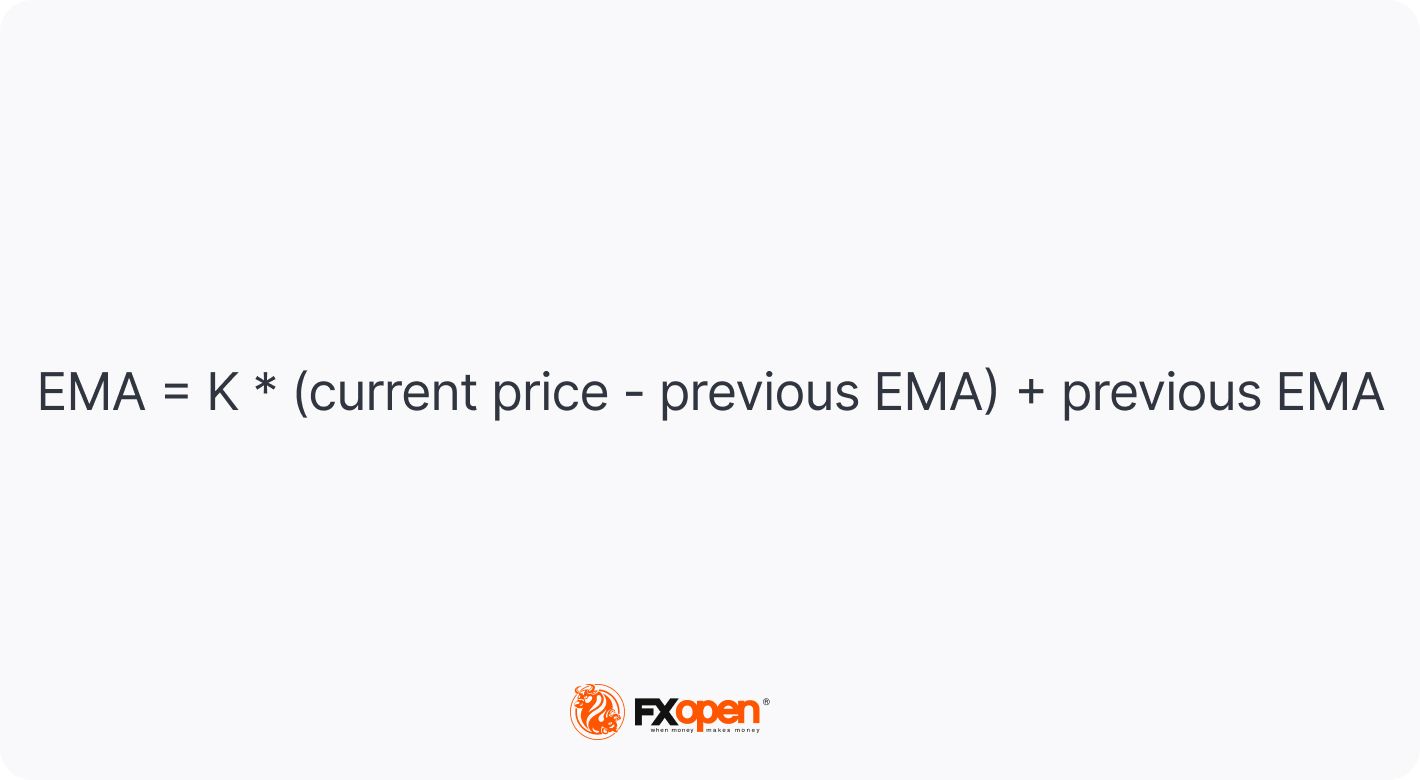
What is the EMA? The difference between an exponential moving average and weighted moving average is that while the WMA reduces the weighting of prices further in the past in a linear fashion, the EMA reduces it exponentially. In what way does this affect how to calculate an exponential moving average?
There are three steps to calculating an exponential weighted moving average:
- Calculate the moving average for the previous period’s EMA
- Calculate the weighting multiplier (K) by taking 2 divided by the number of periods plus 1
- Calculate the EMA by subtracting the previous period’s EMA from the closing price, multiplying it by K, and then adding the previous EMA.
As with WMAs, traders analyse EMA indicators to identify price trends. When a trend changes direction, the EMA reacts faster as it gives more importance to recent data points and exponentially less to the data from the beginning of the period.
How to Trade Using MAs
As MAs are based on past data, they are lagging indicators that are not designed to predict trends, but they demonstrate the direction in which an asset has moved based on past data, so they can confirm existing trends. The MA lines on a price chart smooth out data that may be visually noisy to help make trading decisions easier.
Traders analyse MA, WMA, and EMA chart indicators to identify three pricing signals: trend direction, support and resistance, and crossovers.
Trend Direction
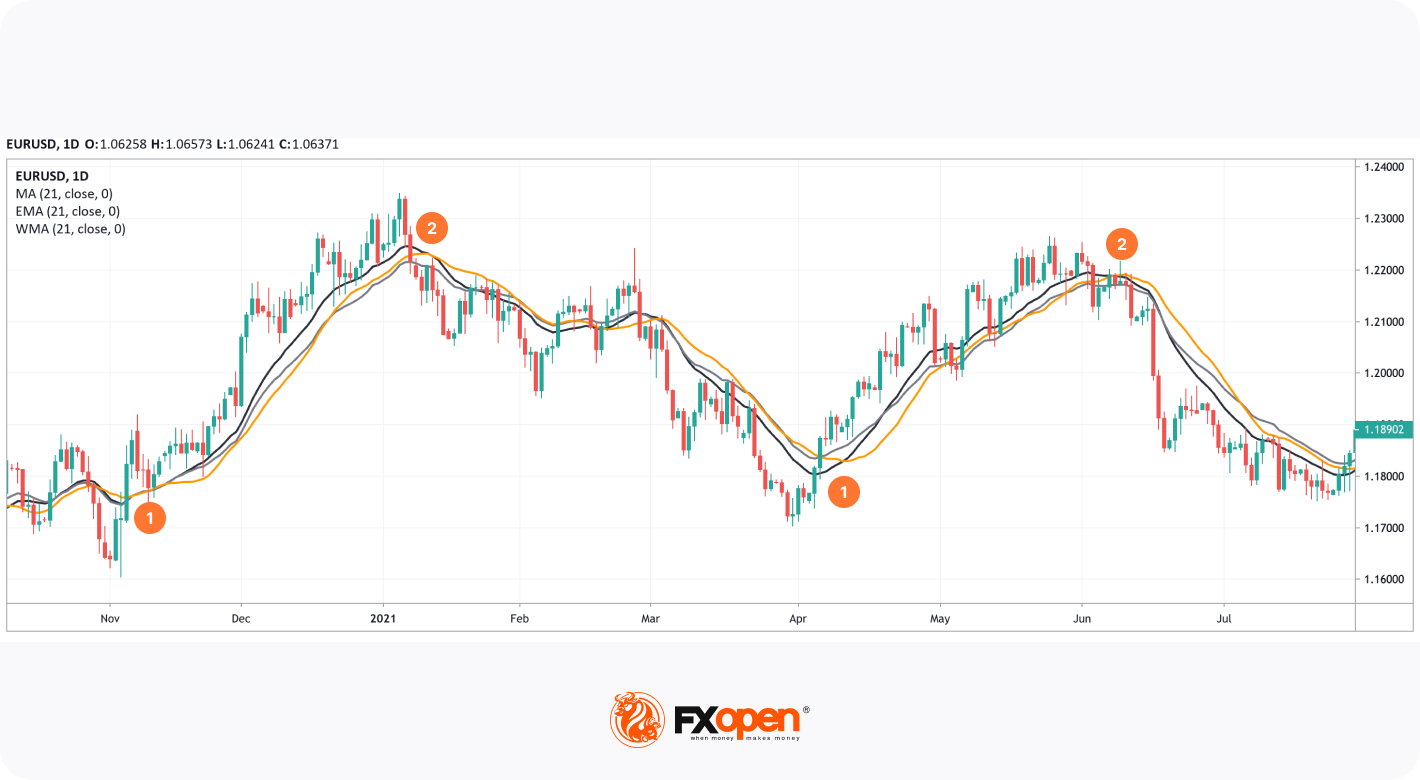
An MA indicator can identify the direction of a trend. If the MA line points higher, the asset is in an upward trend, whereas a falling MA would indicate a downward trend. Traders tend to look at 21-period MAs to gauge short-term trends, 50-period MAs to analyse intermediate-term trends, and 200-period MAs to determine long-term trends.
If an asset is trading above a rising MA, it indicates an upward trend (1). If the price is moving below the MA, the trend is bearish (2). A price crossing over the moving average in either direction can provide the first sign that a trend is reversing course. When a price crosses above the MA, a trader might open a long position or cover a short position, and when a price crosses below the MA, they might go short or sell out of a long position.
Support and Resistance
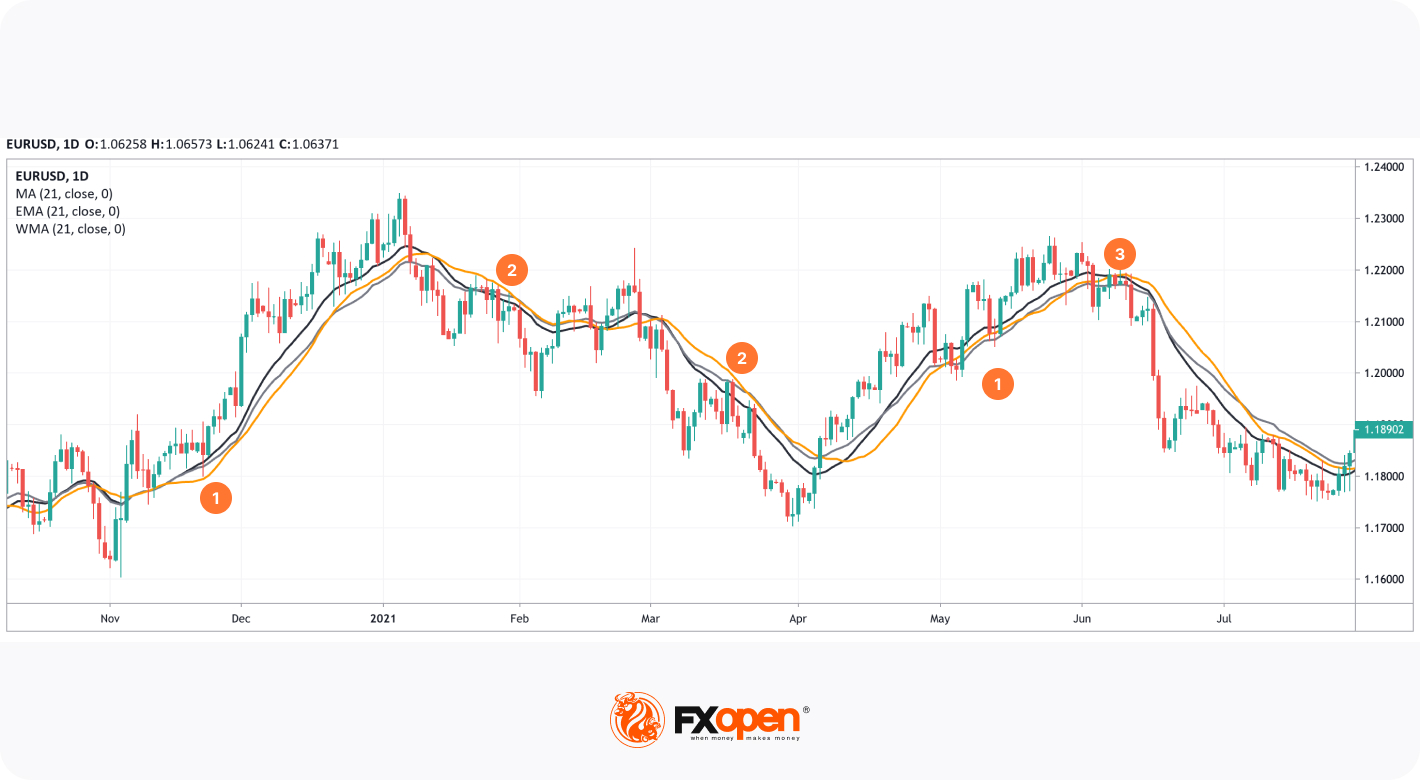
Traders use MAs to identify support and resistance areas. A rising MA tends to indicate a dynamic support level, acting as a floor that the price bounces up from and giving a buy signal (1). A declining MA is used as resistance, allowing traders to open a sell trade at a rebound (2).
Keep in mind that prices can break through support or resistance. The previous support level becomes resistance on a break below the MA (3), and the previous resistance becomes support on a break above.
Crossovers
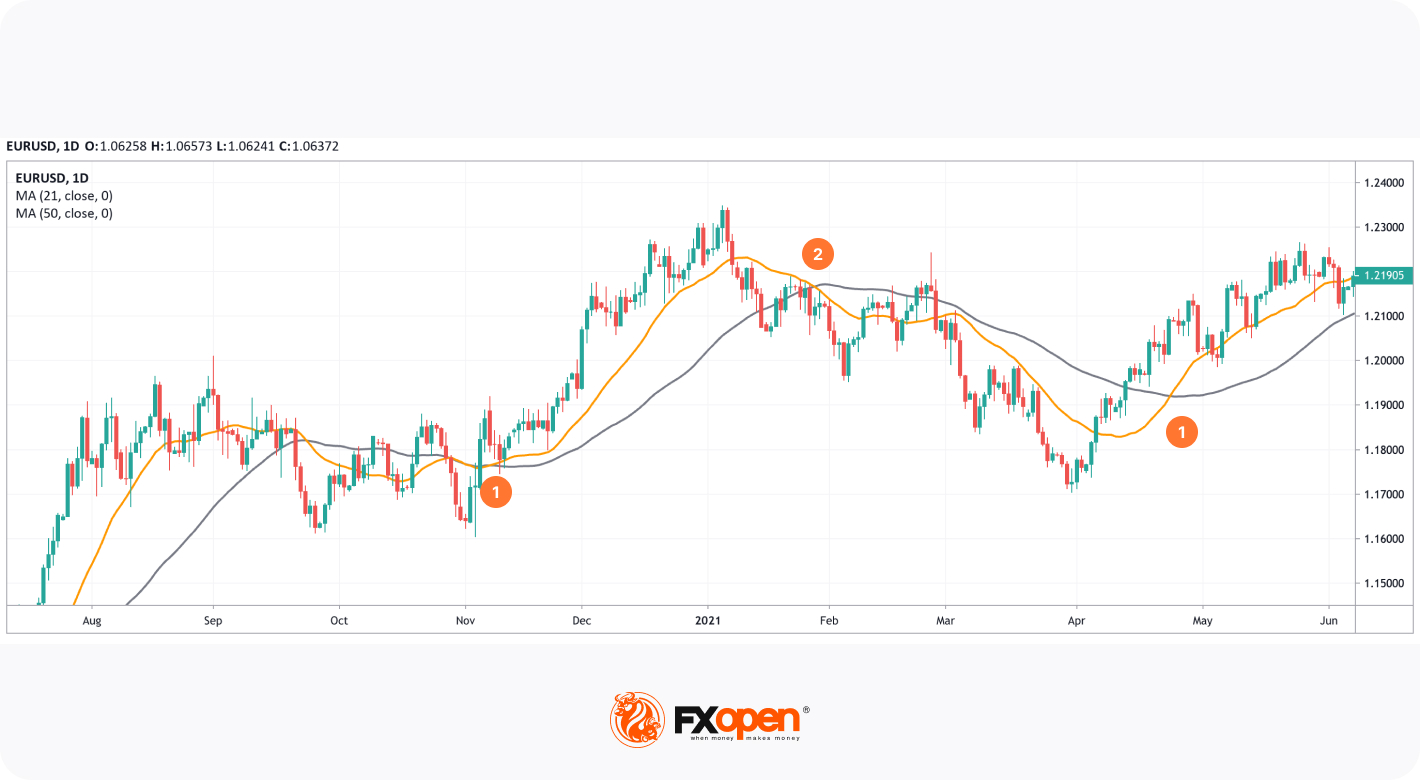
Moving averages also create buy and sell signals when they cross each other. The golden cross is a bullish signal that occurs when a short-term moving average (e.g. 21-day MA) crosses above a long-term moving average (e.g. 50-day MA), which a trader would take as a signal to take a long position (1). Conversely, the death cross is a bearish signal that occurs when a short-term MA crosses below a long-term MA, and it would prompt a trader to go short (2).
Which Moving Average Is More Effective?
Moving average vs weighted moving average vs exponential smoothing: which is the most effective trading tool?
The effectiveness of one type of MA over another will depend on the trading strategy used. One MA is not inherently better than the others; they simply calculate the average price for a period in different ways.
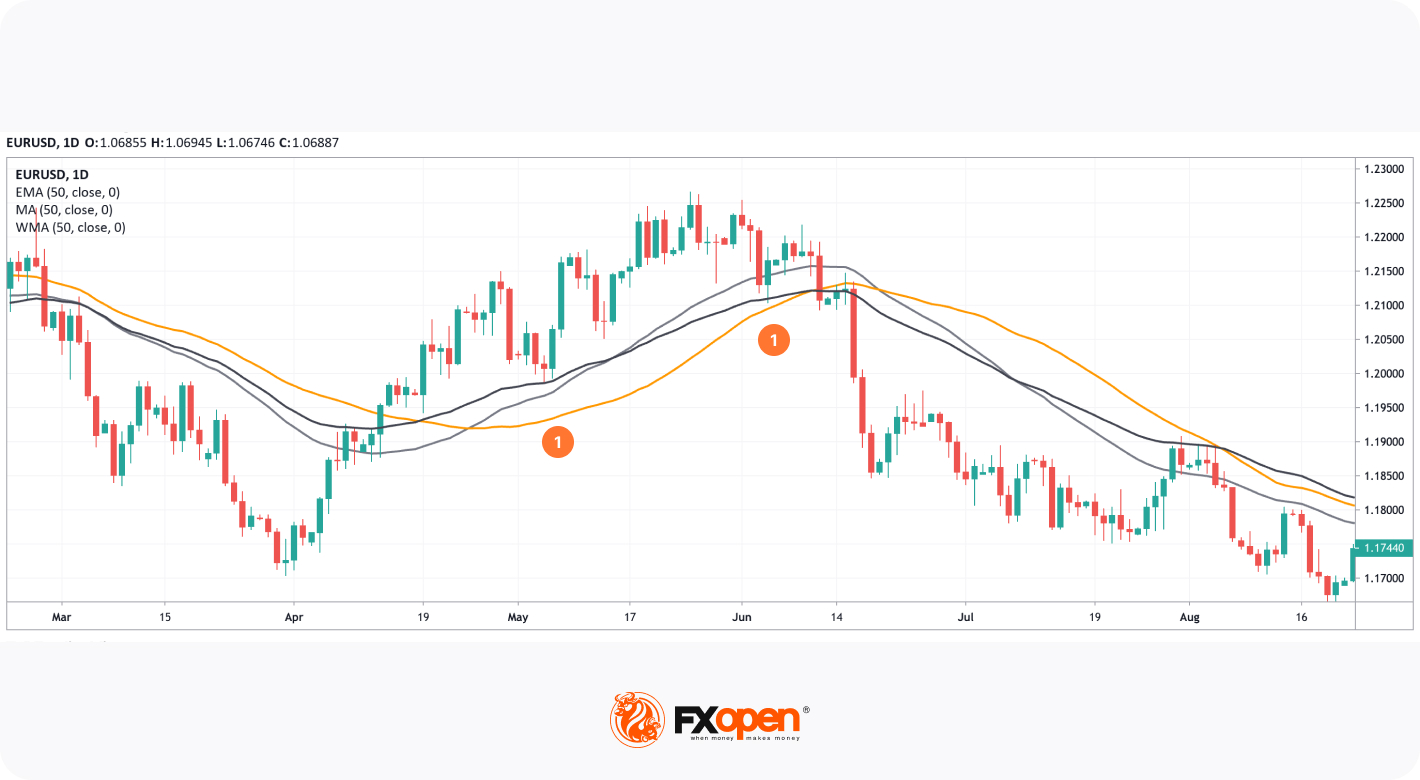
Some traders view an EMA (black) as a clearer indicator of a trend and more responsive than a WMA (grey) or MA (orange) because of the greater weight given to more recent prices, which helps them identify precise support and resistance areas. But some view an SMA as more effective as it provides basic smoothing.
The different MAs appear at different levels because they are calculated differently. Short-term traders might not have a strong preference for using the EMA vs WMA as the values are likely to be closer together. As an EMA and a WMA give less emphasis to older data points, traders choose them over an MA if they are concerned that a lag in the data could reduce the responsiveness to sharp price changes.
If you want to incorporate MAs into your technical analysis, experiment with different combinations to determine which one generates the best results for your trading approach. You might opt to use different MAs for different assets.
Takeaway
There are several types of moving average trading indicators. Simple MAs weight all asset prices equally, while WMAs and EMAs give a higher weighting to the most recent data.
As with all technical analysis indicators, there is no single type of MA that can provide a complete picture of a market. MAs should be incorporated into a trading strategy along with other indicators to help decide when to open and close trades.
If you want to learn more about how to use MAs, open an FXOpen account to practise using the indicators on live price charts.
This article represents the opinion of the Companies operating under the FXOpen brand only. It is not to be construed as an offer, solicitation, or recommendation with respect to products and services provided by the Companies operating under the FXOpen brand, nor is it to be considered financial advice.
Latest from Trader’s Tools
Latest articles

Weekly Market Wrap With Gary Thomson: S&P500, US Dollar, Gold Price, PEP Stocks
Get he latest scoop on the week's hottest headlines, all in one convenient video. Join Gary Thomson, the COO of FXOpen UK, as he breaks down the most significant news reports and shares his expert insights. Read the latest news

The Price of Silver Has Reached Its Highest Level in Over Three Years
As indicated by the XAG/USD chart today, the intraday price of silver reached $29.84 per ounce yesterday, while the previous yearly high on 12 April was $29.79. The last time this price was seen was in February

What Is the Wolfe Wave, and How Can You Trade It?
The Wolfe Waves is a powerful chart pattern recognised for analysing potential price reversals. Named after Bill Wolfe, who developed this formation through extensive trading practice, Wolfe Waves provide traders with a structured approach to anticipate market movements. In this