


What Is the Wolfe Wave, and How Can You Trade It?
FXOpen

The Wolfe Waves is a powerful chart pattern recognised for analysing potential price reversals. Named after Bill Wolfe, who developed this formation through extensive trading practice, Wolfe Waves provide traders with a structured approach to anticipate market movements. In this article, we’ll explore the Wolfe pattern, how to identify it, and how to apply it to the price chart.
Understanding the Wolfe Wave Pattern
The Wolfe Wave is a chart pattern recognised by its rhythmic oscillation, organised into five distinct movements that reflect equilibrium pricing and potential directional movements in the market. This formation is named after Bill Wolfe, who highlighted its significance in the financial markets through his teaching and trading practices. It can be applied to all types of assets, including stocks, forex, commodities, and cryptocurrencies*.
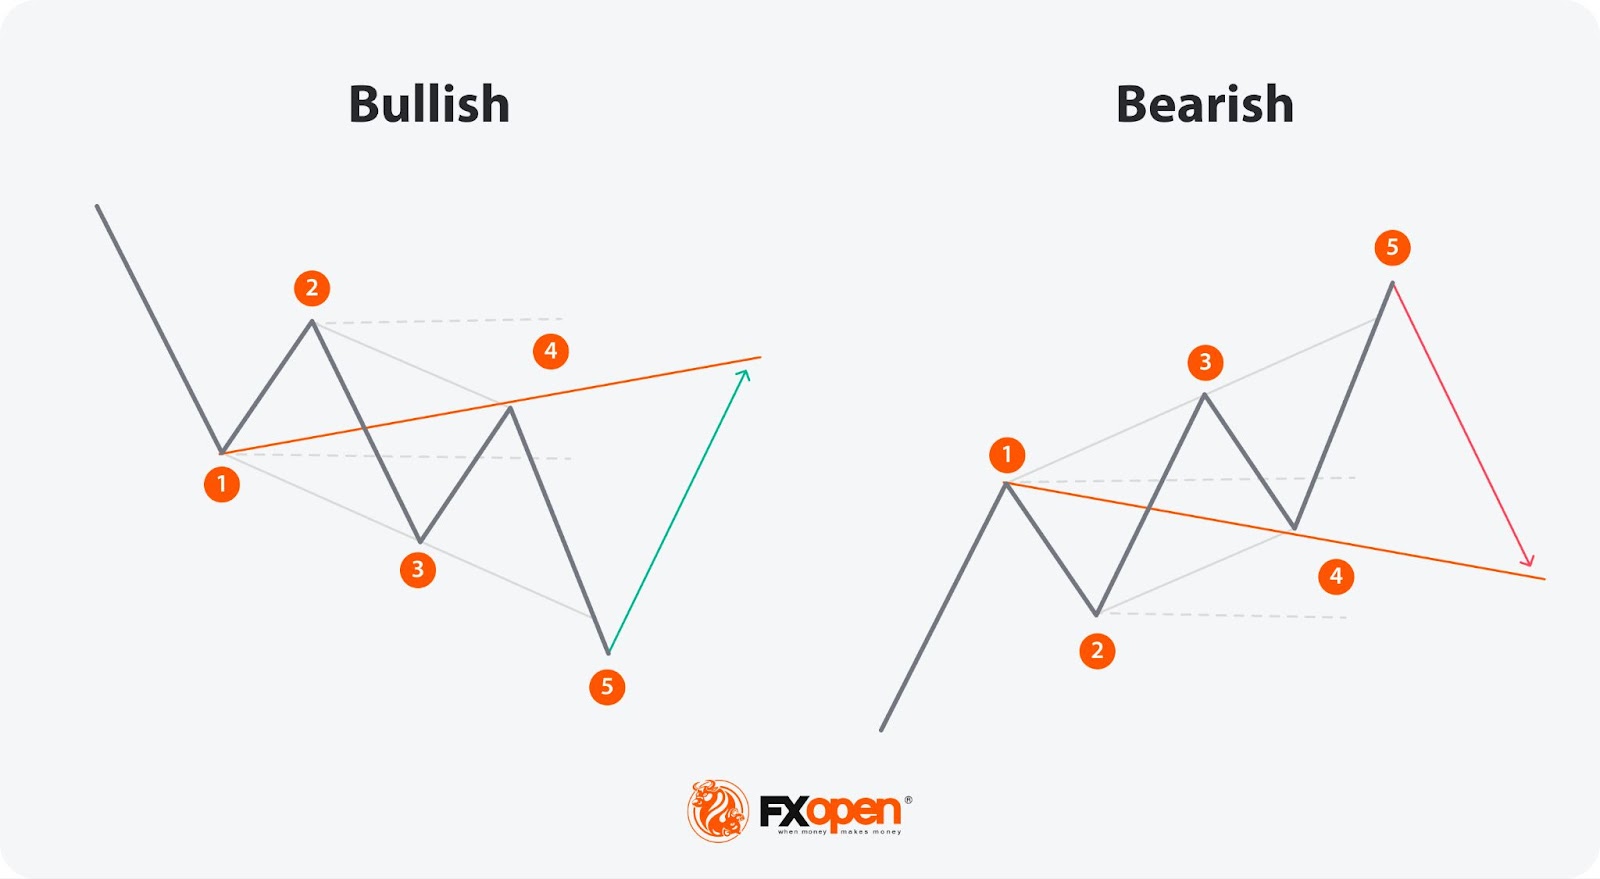
The Wolfe pattern is characterised by five consecutive waves. The sequence includes three movements advancing in the primary market direction alternated with two corrective phases. This arrangement helps delineate the buildup of buying or selling pressure, culminating in a significant reversal:
- Point 1: This is the base of the pattern.
- Point 2: Point 2 is a retracement within the established trend.
- Point 3: Point 3 should be beyond Point 1, confirming the initial trend.
- Point 4: This Point stays within the channel formed by Wave 1-2. Point 4 doesn’t move beyond Point 2.
- Point 5: Point 5 is a crucial swing high or low, set after the retracement of Wave 3-4. It moves just beyond the trend line drawn through Points 1 and 3. The final wave extends from Point 5, often forming the longest wave of the formation and reversing the current trend.
The strategic significance of the Wolfe pattern lies in its ability to analyse where the price is likely to go, allowing traders to prepare and position their trades accordingly.
Identifying the Wolfe Wave Pattern on a Chart
Identifying this cycle in market charts requires a keen eye for detail and a methodical approach. This pattern is predicated on the rhythm of highs and lows within a clear directional trend, either upward or downward.
Presence of a Clear Trend
The pattern typically forms in markets that exhibit a well-defined trend. Traders look for a consistent series of higher highs and higher lows in an uptrend or lower highs and lower lows in a downtrend. This prevailing trend is crucial for the formation of Wolfe Waves, as the formation hinges on the existing market rhythm.
Symmetry
Symmetry is a key characteristic. The formation should display a generally balanced structure in terms of both time and magnitude. Specifically, Waves 1 and 2 should be comparable to 3 and 4, respectively. This symmetry helps in accurately analysing the termination point of Wave 5.
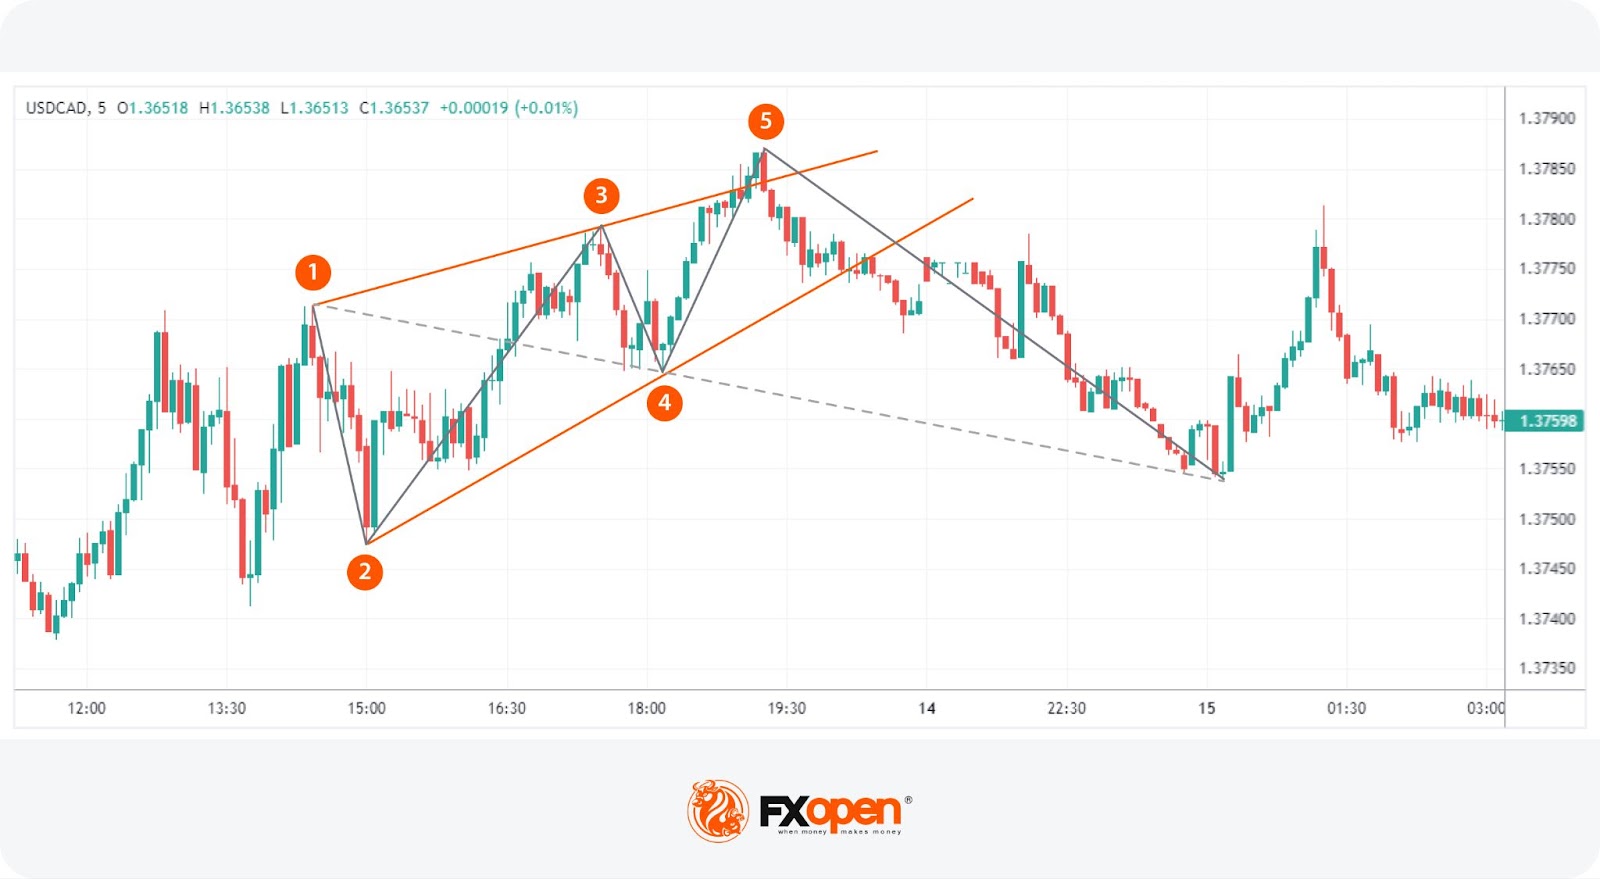
Channel Formation
A critical aspect of identifying the Wolfe Cycle is the formation of a channel connecting the peaks and troughs of Waves 1 through 4. Initially, a parallel channel can be drawn using Points 1 and 2. However, if Points 3 and 4 fall within this channel, they can form a new channel, potentially forming a wedge-like appearance. A crucial identification marker is Wave 5 breaking through this channel, signalling the potential completion of the sequence and the anticipated reversal.
Fibonacci Relationships
Fibonacci retracement and extension levels often align with the turning points of the pattern, offering additional validation. While not mandatory, these relationships can enhance the accuracy of identification.
Specifically, traders look for:
- Point 3 being between the 127.2% and 161.8% extension of Wave 1-2.
- Point 5 placed between the 127.2% and 161.8% extension of Wave 3-4.
Volume and Momentum Indicators
Although not primary criteria, volume and momentum indicators can provide supplementary evidence when identifying Wolfe sequences. A sharp move back inside the channel as the reversal unfolds, backed by high volume, can help confirm the formation, while a divergence in a momentum indicator like RSI or MACD can add confluence to the trade.
How to Trade the Wolfe Wave
Here’s how traders typically apply this tool to their strategies. You can try your hand at identifying your own chart patterns in FXOpen’s free TickTrader platform.
Typical Entry Point
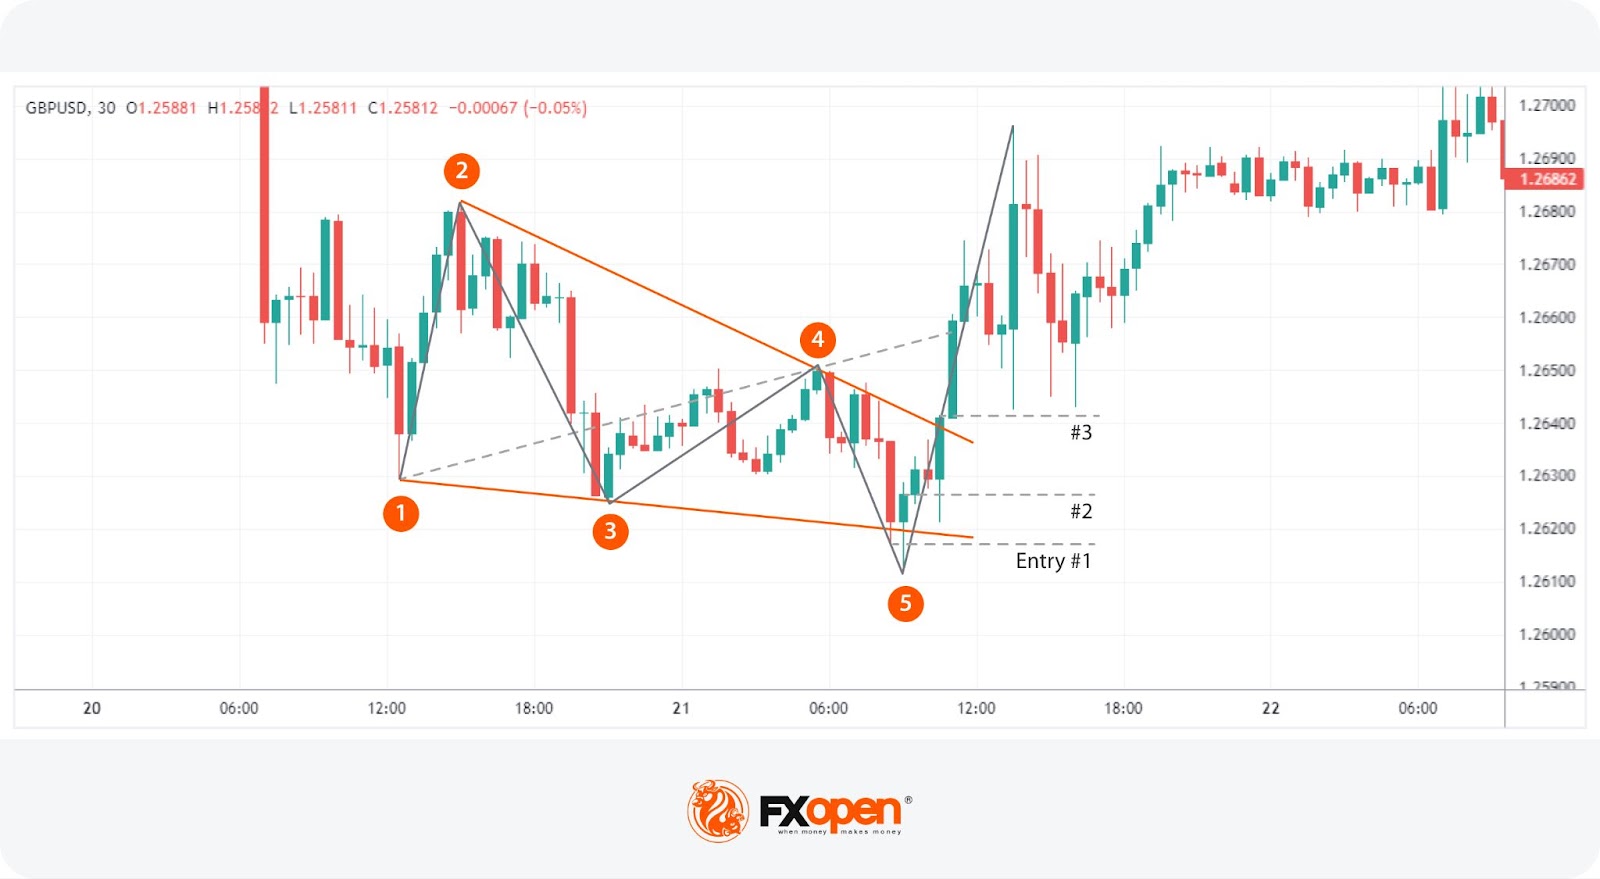
Traders often look for an entry (#1) beyond the trendline connecting Point 1 and Point 3. This entry point is favoured because it provides an optimal risk-to-reward ratio as Wave 5 begins its movement. Entering the trade when the price closes beyond this trendline allows traders to potentially capture the significant move anticipated by the formation, though they also face the risk of trading against a breakout.
In these scenarios, where there may be no nearby swing point to set a stop loss beyond, traders might use volatility-based stop-loss levels. The Average True Range (ATR) indicator is useful here. For example, a trader might set the stop loss at the entry price plus 2.5 times the ATR. This approach accounts for market volatility and helps to potentially protect against unexpected price swings.
Waiting for Confirmation
Some traders wait for additional confirmation before opening a position. They might wait for the price to close back inside the channel (#2), indicating that the reversal is likely underway. Alternatively, they might look for specific candlestick patterns, such as an engulfing candle or a hammer/shooting star, which can provide further validation of the reversal. In these cases, stop losses might be set just beyond the high or low created by Point 5.
Conservative Entry Strategy
For a more conservative approach (#3), traders might wait for the price to close outside the opposing trendline, drawn between Points 2 and 4. While this method offers the highest confirmation of the sequence, it can result in a later entry, potentially missing a significant portion of the move. This strategy is generally best suited for traders who prioritise certainty over capturing the entire price movement.
Profit Targets
The profit target is drawn along the trendline formed between Points 1 and 4, which typically sits beyond Point 4 but not Point 2. This target is generally short-term but provides a well-defined strategic approach. However, it’s also possible to place a target at Point 2 as it’s an area where the price previously found support/resistance and could prompt a reversal.
Wolfe Waves vs Elliott Waves

Wolfe and Elliott Waves are both popular technical analysis tools, but they serve different purposes. Wolfe focuses exclusively on identifying potential price reversals through a five-wave pattern, making it useful for short-term trading strategies. It relies on symmetry and precise geometric moves to analyse market movements.
In contrast, the Elliott Waves analyses broader market cycles and trends, comprising a series of impulsive and corrective movements. Elliott sequences are more complex, with varying wave counts and intricate rules, making them suitable for long-term market analysis.
While the Wolfe Waves is valued for their straightforward application and precise entry/exit points, the Elliott Waves offers a comprehensive view of market psychology and overall trend direction. Traders often use the former for immediate trading opportunities and the latter for understanding long-term market dynamics.
The Bottom Line
The Wolfe Waves formation offers traders a practical method to analyse and anticipate market reversals. By mastering the identification and application of this pattern, traders can potentially improve their trading outcomes. Those looking to implement Wolfe Waves and other advanced trading patterns can consider opening an FXOpen account to access comprehensive tools and resources.
FAQs
What Is a Wolfe Wave?
A Wolfe Wave is a chart formation consisting of five waves used to analyse potential price reversals. This pattern helps traders identify key points of equilibrium and directional changes, making it a valuable tool in technical analysis.
How to Use the Wolfe Wave Indicator?
Traders typically use the Wolfe Wave by identifying the five-wave structure and looking for entry points beyond the trendline between Points 1 and 3. Stop losses might be set based on volatility, and profit targets are drawn along the trendline formed between Points 1 and 4.
What Is the Difference Between the Wolfe Wave and the Elliott Wave?
Wolfe focuses on short-term price reversals with a five-wave pattern, while Elliott traders analyse broader market cycles with impulsive and corrective waves. Wolfe Waves are used for precise entry and exit points, whereas Elliott Waves provides a comprehensive view of market trends and psychology.
*At FXOpen UK and FXOpen AU, Cryptocurrency CFDs are only available for trading by those clients categorised as Professional clients under FCA Rules and Professional clients under ASIC Rules, respectively. They are not available for trading by Retail clients.
This article represents the opinion of the Companies operating under the FXOpen brand only. It is not to be construed as an offer, solicitation, or recommendation with respect to products and services provided by the Companies operating under the FXOpen brand, nor is it to be considered financial advice.
Stay ahead of the market!
Subscribe now to our mailing list and receive the latest market news and insights delivered directly to your inbox.


Latest articles

Ripple: Letter to Congress Stirs the Crypto Market
At the beginning of June, more than 200 crypto companies and industry groups — including Coinbase, Andreessen Horowitz and Ripple Labs — sent a letter to Senate Majority and Minority Leaders John Thune and Chuck Schumer, urging them to bring the Digital

GBP/JPY: Ascending Triangle Under Pressure
The GBP/JPY pair has come under pressure after the Bank of Japan raised its policy rate to 1.0% on 16 June. The Bank of England is following the opposite path: at its 30 April meeting, the Monetary Policy
Pound Under Pressure: Markets Await Bank of England And SNB Decisions
The British pound remains under pressure following weaker-than-expected inflation data, which has reinforced expectations of further monetary easing by the Bank of England. Investors are staying cautious ahead of today’s policy meetings of both the UK central bank and