


Advanced Charting Techniques for Forex Trading
FXOpen

In forex trading, understanding chart and candlestick patterns can help analyse the market direction and guide entries. These setups, formed by specific price action movements, offer traders vital clues about market trends and potential reversals. This article delves into several advanced formations, each signalling unique market sentiments and potential shifts in trend direction.
Understanding Chart and Candlestick Patterns in Trading
Understanding chart patterns and how to trade them is a key skill for forex traders. Chart patterns, which are formations created by the price movements on a chart, serve as visual indicators of market trends and potential reversals. Well-known examples include:
- The inverse head and shoulders and head and shoulders chart patterns
- The double top and double bottom chart patterns
- The flag pattern in a chart
- The wedge pattern in a chart
These patterns help in determining future market movements based on historical price actions.
Candlestick patterns take this analysis further. They consist of specific formations of one or more bars, providing deeper insights into market sentiment and potential price movements. Each formation, through its unique formation, tells a story of the battle between buyers and sellers.
Integrating these patterns with other trading tools may enhance their effectiveness. For instance, when these formations appear at key levels identified by a Fibonacci retracement levels chart, it adds an extra layer of confirmation. Fibonacci trading charts, with their focus on specific percentage levels where price reversals might occur, can complement the insights gained from candlestick formations.
If you’d like to try your hand at identifying the patterns below yourself, head over to FXOpen’s free TickTrader platform to explore a wide range of forex trading charts.
Bullish/Bearish Breakaway
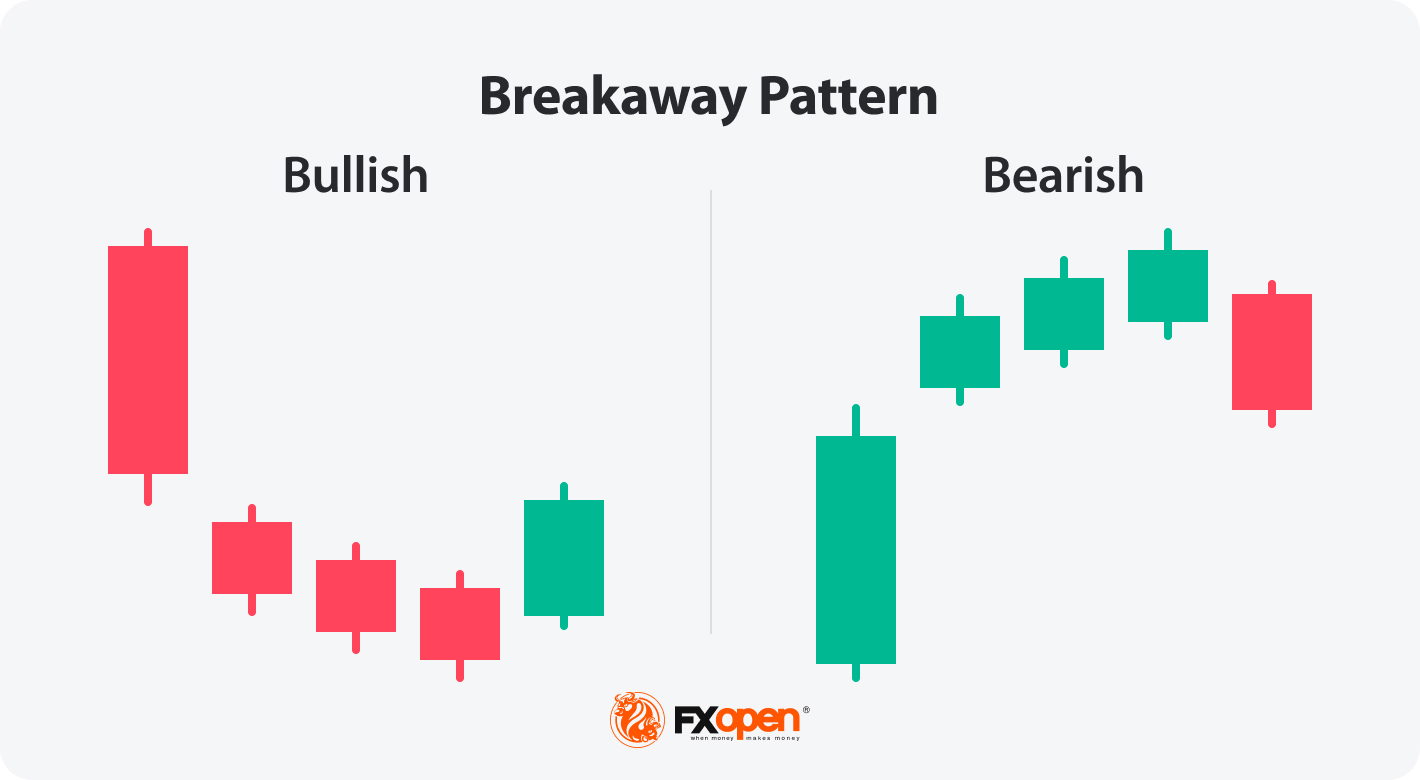
Bullish and Bearish Breakaways are advanced chart patterns, signalling potential market reversals. These formations are composed of five bars and can appear in either an upward or downward trend.
The Bullish Breakaway starts with a large bearish bar, followed by a gap and a series of smaller bearish candles. The fifth bar is large and bullish, closing between the first and second candle's prices. It indicates a potential reversal from bearish to bullish sentiment.
Conversely, the Bearish Breakaway occurs during an uptrend. It begins with a large bullish candle, then a gap, followed by a smaller bullish one, and ends with a large bearish bar. This may reflect the start of a bearish trend.
Traders may use these formations to identify entry points. For a Bullish Breakaway, a trade entry might be considered when the price starts to rise after the fifth candlestick. In the case of a Bearish Breakaway, an entry could be contemplated as prices begin to fall after the gap is filled. Stop-loss orders may be placed just outside the opposite end of the breakaway gap.
Ladder Bottom/Top
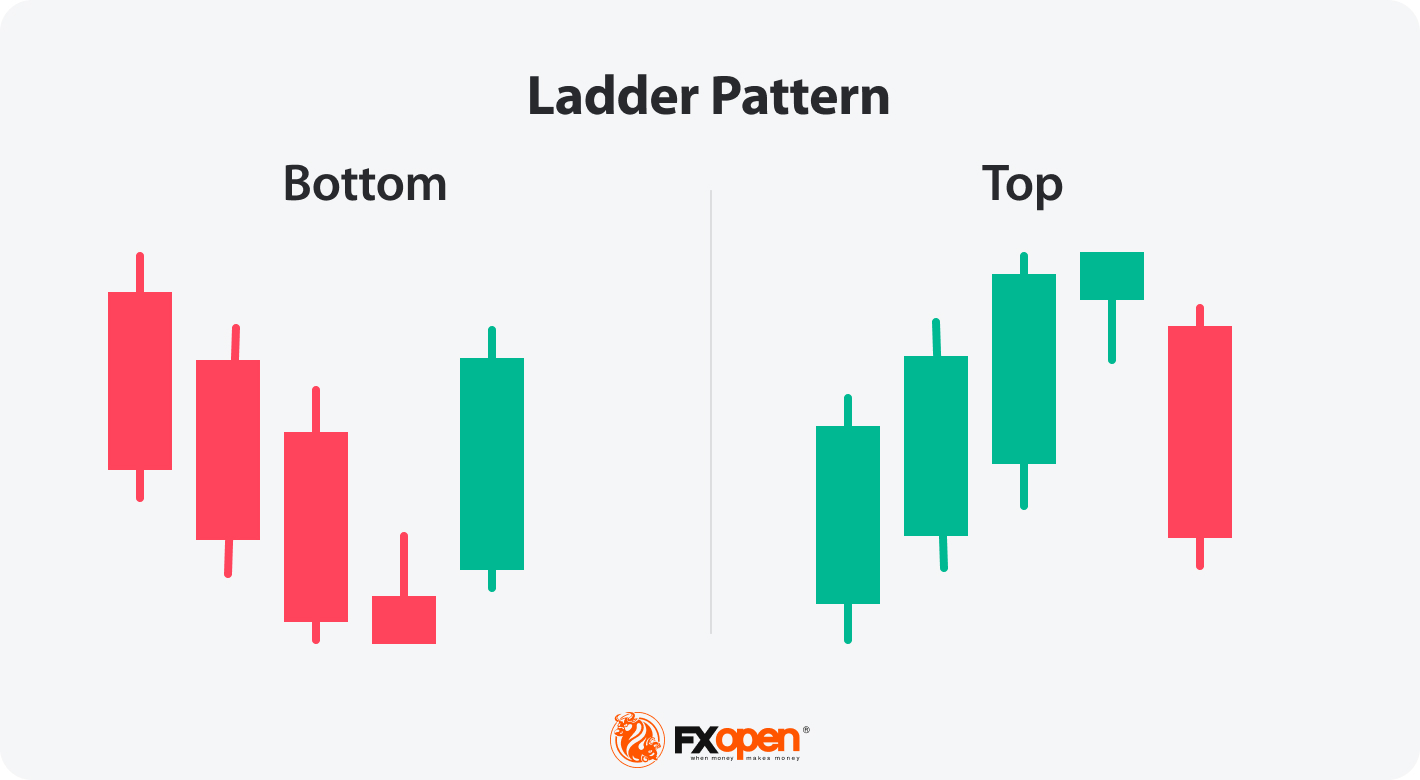
Ladder Bottom and Top are two of the more advanced trading patterns, recognised as bullish and bearish reversal signals, respectively. They are particularly notable for their five-bar formation.
Ladder Bottom Candles
- First, second, and third: Long and bearish, indicating strong selling pressure.
- Fourth: Bearish with a smaller body and a long upper wick.
- Fifth: Strong bullish, opening above the opening of the previous candlestick and signifying a sudden increase in buying pressure, potentially indicating a trend reversal.
Ladder Top Candles
- First, second, and third: Long and bullish, indicating strong buying pressure.
- Fourth: Bullish with a smaller body and a long lower wick.
- Fifth: Strong bearish, opening below the opening of the previous candlestick and signifying a sudden increase in selling pressure, potentially indicating a trend reversal.
Traders often wait for a breakout above the first bearish candle before considering a long position in the Ladder Bottom and below the first bullish candle in the ladder top, using this as an indicator of strong momentum. Traders may consider setting stop losses below the low of the setup in the ladder bottom and above the formation’s high in the Ladder Top.
Homing Pigeon
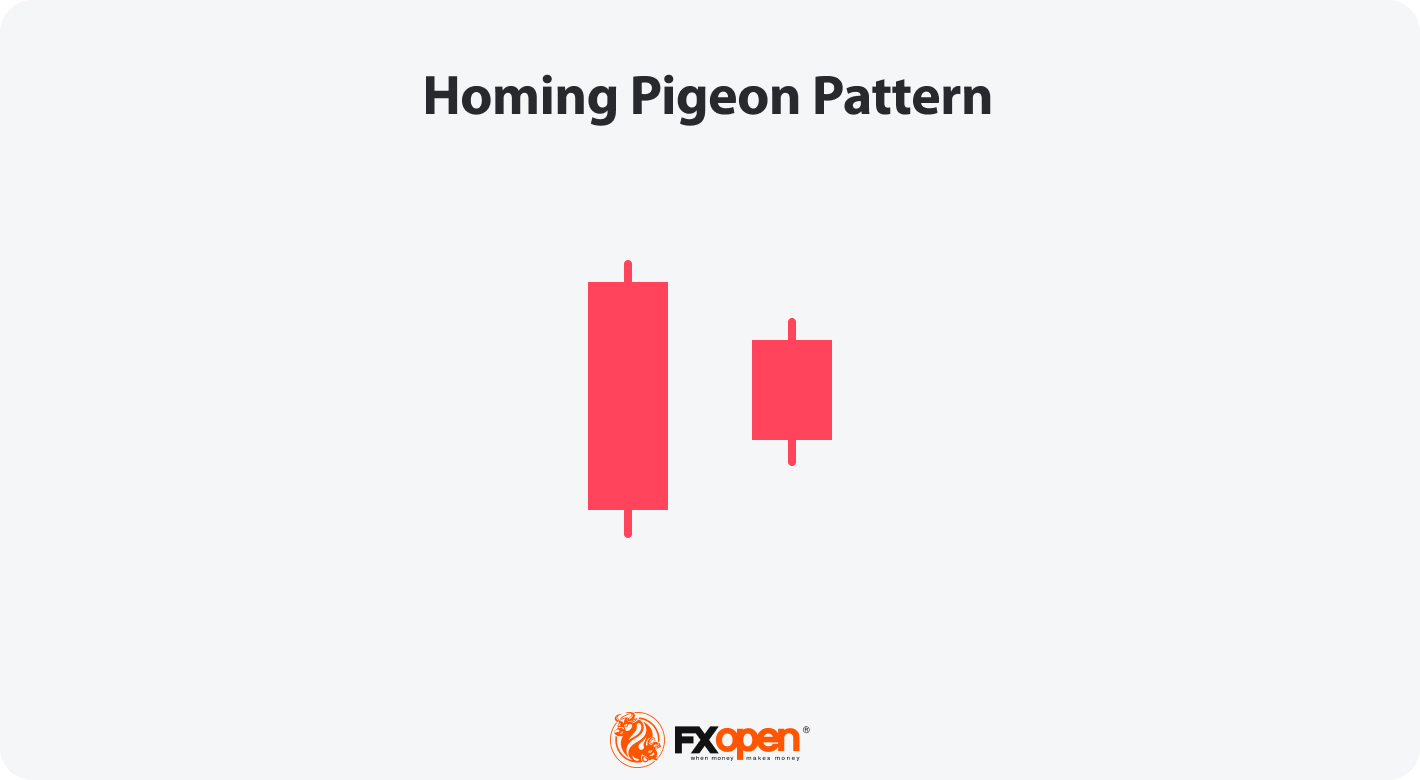
The Homing Pigeon is a two-candlestick bullish reversal formation often seen at the bottom of a downtrend. The first bar is bearish and part of the ongoing downtrend, while the second is a smaller bearish candlestick entirely contained within the first candlestick's body. It assumes that the previous selling pressure is weakening, and a potential bullish reversal may be imminent.
The entry point for a long position may be at the breakout of the first bar. The theory states that traders set a stop loss slightly below the low of the Homing Pigeon to limit potential losses if the trend fails to reverse.
Bullish/Bearish Stick Sandwich
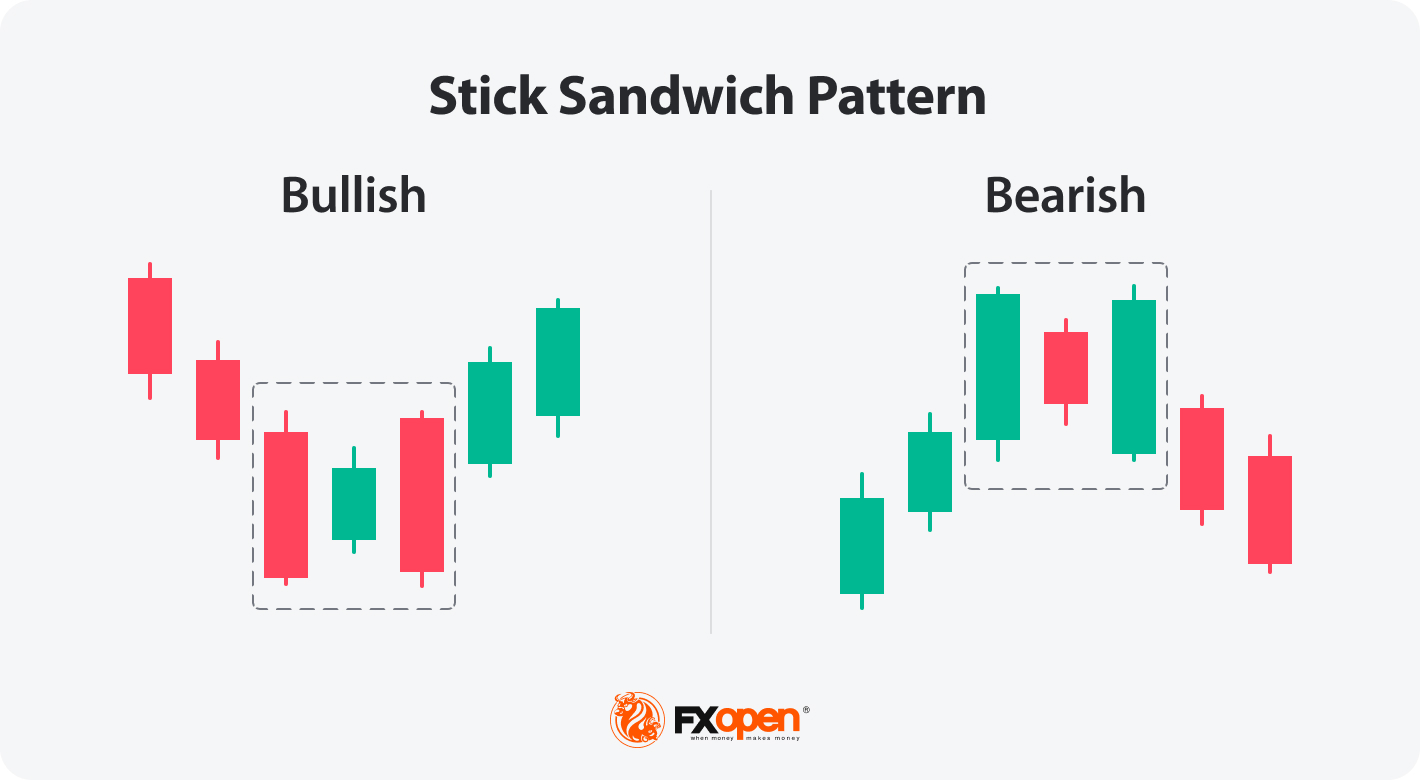
The Bullish and Bearish Stick Sandwich are three-candlestick patterns, indicating potential market reversals:
Bullish Stick Sandwich
- First: Long bearish candle.
- Second: Bullish, often within the range of the prior candle.
- Third: Long bearish, closing near the first candle's close.
An entry may be taken above the third candle’s high, with a stop loss typically set below the third bar’s low.
Bearish Stick Sandwich
- First: Long bullish candle.
- Second: Bearish, often within the range of the previous candle.
- Third: Long bearish, closing near the first candle's close.
Traders may enter below the third candle’s low, considering a stop loss placed above the third bar’s high.
Unique Three-River Bottom
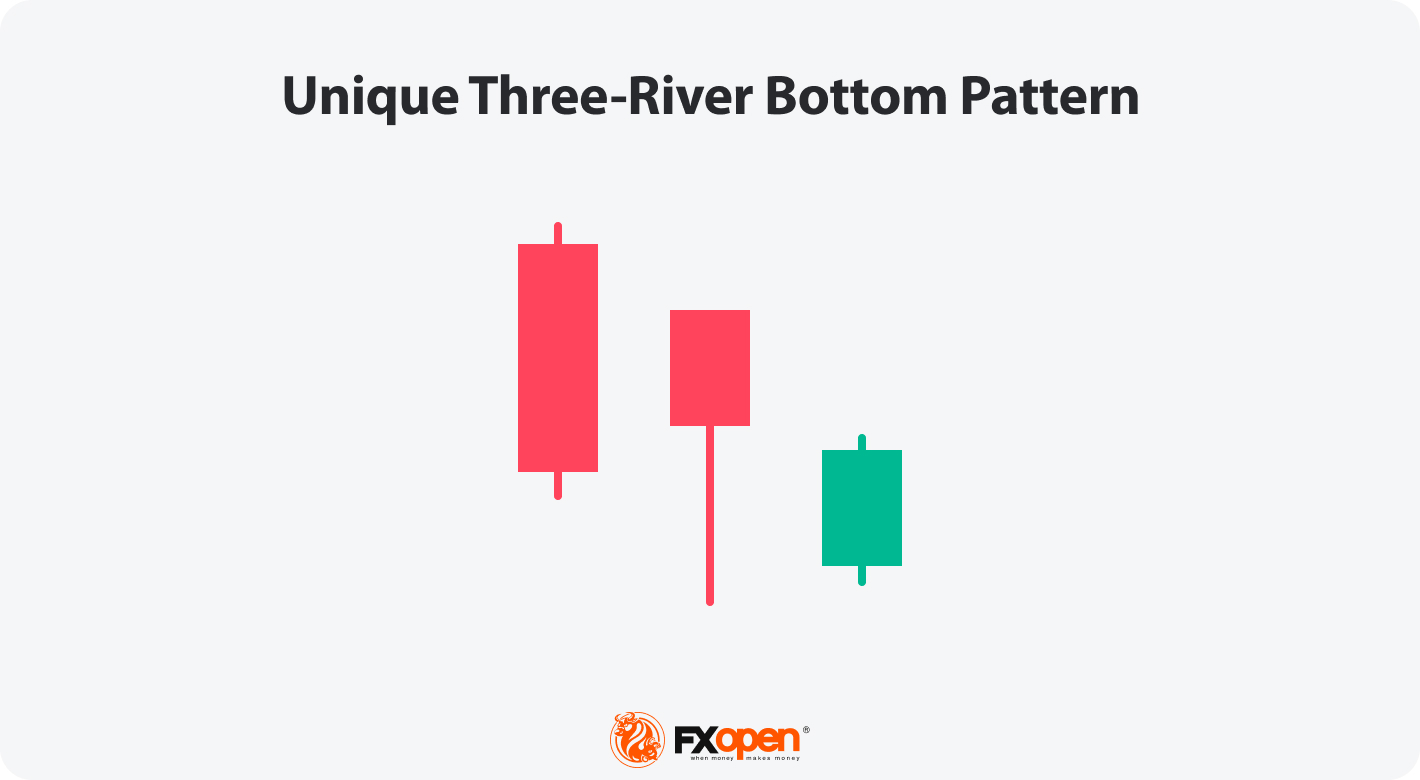
The Unique Three-River Bottom is a rare and intricate candlestick formation, often signalling a bullish reversal. However, it has also been observed to act as a bearish continuation formation. It’s formed by three specific candles:
- First: Long and bearish, indicating strong selling pressure, is a part of a downtrend.
- Second: A hammer with a lower wick, establishing a new low. This bar indicates that buyers are starting to take over.
- Third: Short and bullish with its body below the body of the second candle and not surpassing the peak or low of the second candle.
Trading the Unique Three-River Bottom involves considering a long position when the setup is followed by 1-2 bullish candles, with a stop-loss order placed below the low of the second candlestick.
Rising/Falling Window
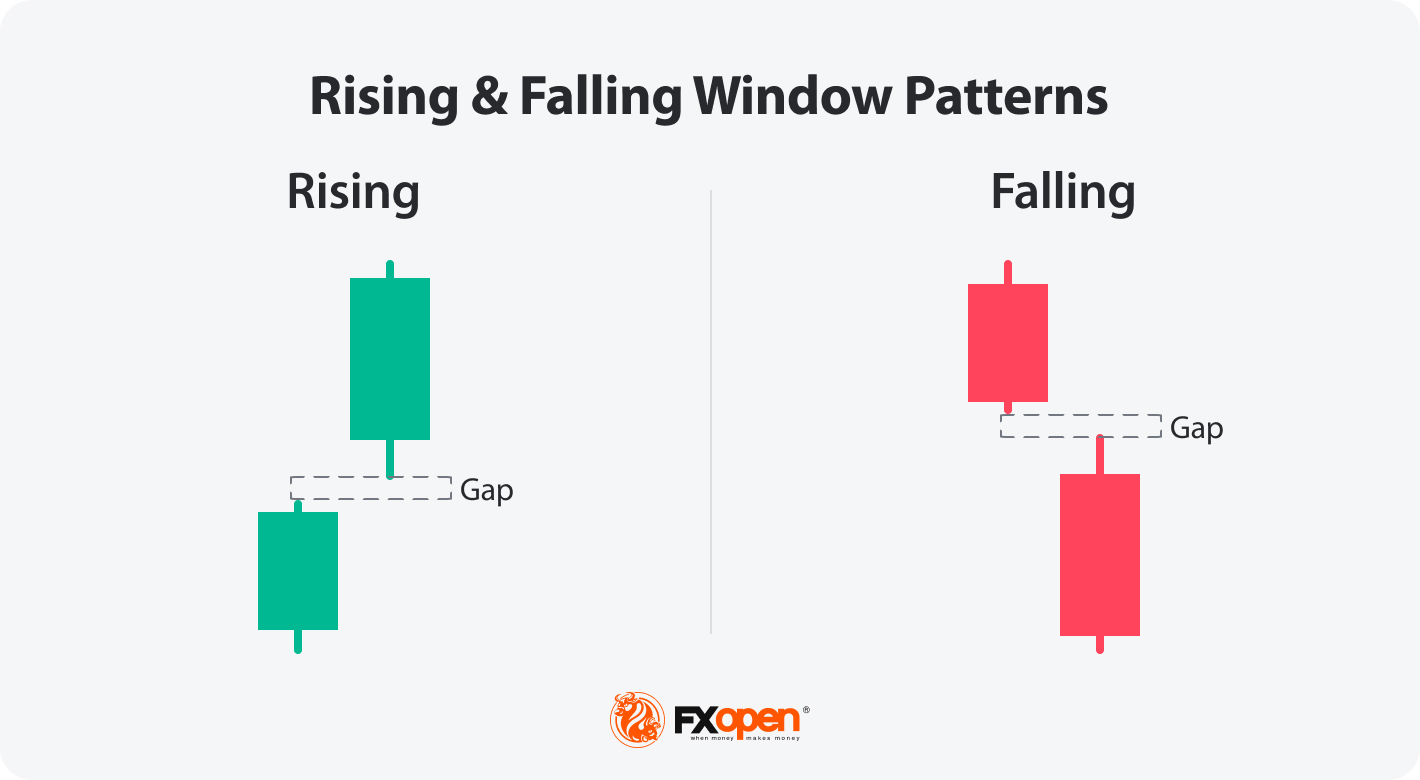
The Falling and Rising Window generally signify trend continuation, marked by a gap between two candlesticks.
Rising Window
A bullish continuation formation in an uptrend consisting of two bullish bars separated by a gap. This gap, formed when the low of the second candle is higher than the high of the first, indicates strong buying pressure.
Falling Window
A bearish formation in downtrends, comprising two bearish bars with a gap. Here, the high of the second candle is lower than the low of the first, showing strong selling pressure.
An entry may be considered after the close of the second candle, with a stop loss placed beyond the high or low of the first bar, depending on the trend direction.
The Bottom Line
Understanding these patterns is essential for forex traders looking to navigate market trends effectively. Their appearance may provide valuable insights for making informed trading decisions. Want to practically apply this knowledge and continue your trading journey? Consider opening an account with FXOpen to leverage these strategies in real-time market scenarios.
This article represents the opinion of the Companies operating under the FXOpen brand only. It is not to be construed as an offer, solicitation, or recommendation with respect to products and services provided by the Companies operating under the FXOpen brand, nor is it to be considered financial advice.
Stay ahead of the market!
Subscribe now to our mailing list and receive the latest market news and insights delivered directly to your inbox.


Latest articles

Gold Analysis: Is the Correction Over, or Just Catching Its Breath?
Gold has had a rough year. After hitting an all-time high near $5,602 in January, the metal has since dropped roughly 27% from that peak, weighed down by rising Treasury yields, a firmer dollar, and cooling demand for safe-haven

Brent Analysis: Oil Retreats from $100 as Saudi Arabia Proposes Maritime Coalition Initiative
On 23 July 2026, Brent crude rose above $100 amid reports of attacks on tankers and infrastructure in the Red Sea area, as well as strong statements from Donald Trump towards Iran over threats to shipping security through the Strait

Nasdaq 100: 48 Hours of Chaos, One Trendline Standing in the Way
Wall Street just lived through one of its wildest 48 hours of the year. On Wednesday, the Fed held rates steady at 3.50%-3.75%, but three FOMC members broke ranks to demand a hike—an unusually hawkish dissent