


Market Analysis: Gold Price Rallies Toward $2K While Crude Oil Price Takes Hit
FXOpen

Gold price surged above the $1,960 resistance during the Israel-Hamas war escalated. Crude oil price struggled and declined below the $85.75 support.
Important Takeaways for Gold and Oil Prices Analysis Today
· Gold price started a steady increase from the $1,974 zone against the US Dollar.
· A key bullish trend line is forming with support near $1,982 on the hourly chart of gold at FXOpen.
· Crude oil prices failed to clear the $89.50 region and started a fresh decline.
· There is a connecting bearish trend line forming with resistance near $83.70 on the hourly chart of XTI/USD at FXOpen.
Gold Price Technical Analysis
On the hourly chart of Gold at FXOpen, the price found support near the $1,940 zone. The price remained in bullish zone and started a strong increase above $1,960 during the Israel-Hamas war.
There was a decent move above the 50-hour simple moving average. The bulls pushed the price above the $1,974 and $1,982 resistance levels. Finally, the price tested the $1,995 zone before the bears appeared.
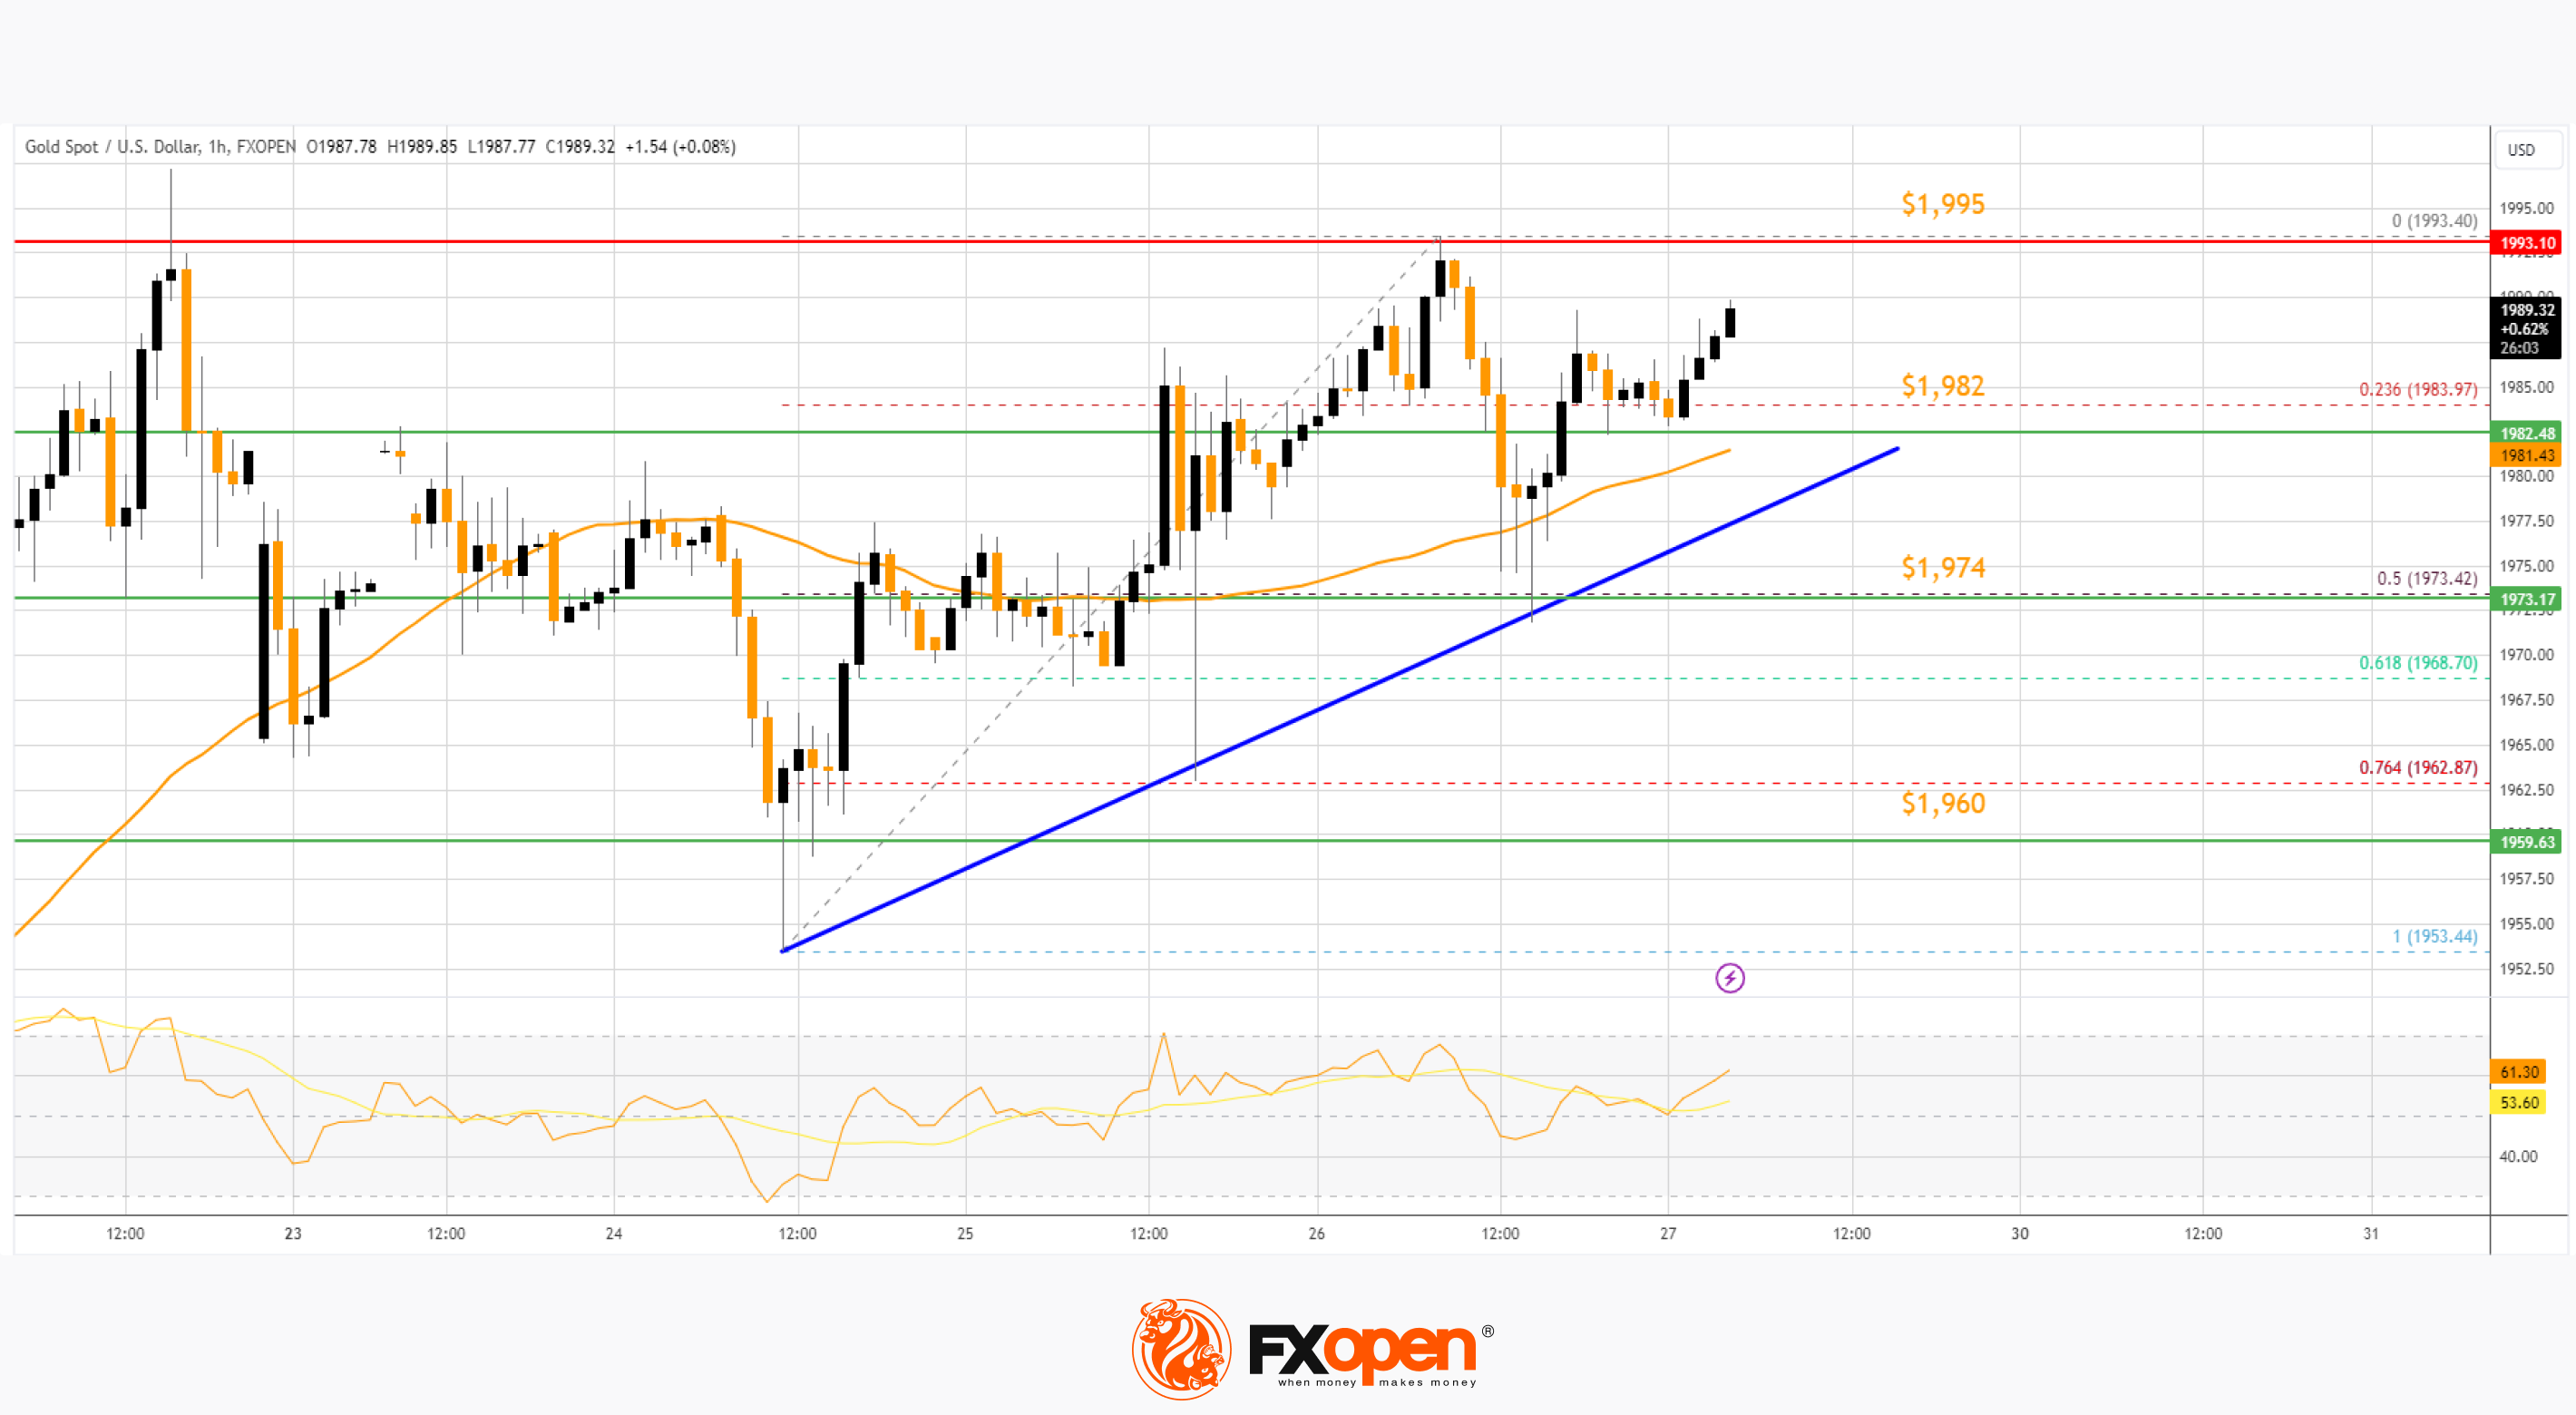
There was a minor downside correction below $1,980 and the RSI dipped below 50. There was a move below the 23.6% Fib retracement level of the upward move from the $1,953 swing low to the $1,993 high.
The price remained strong above the 50-hour simple moving average and the 50% Fib retracement level of the upward move from the $1,953 swing low to the $1,993 high.
There is also a key bullish trend line forming with support near $1,982. Initial support on the downside is near $1,982 and the 50-hour simple moving average. The first major support is near the $1,974 zone. If there is a downside break below the $1,974 support, the price might decline further. In the stated case, the price might drop toward the $1,960 support.
Immediate resistance is near the $1,995 level. The next major resistance is near the $2,000 level. An upside break above the $2,000 resistance could send Gold price toward $2,020. Any more gains may perhaps set the pace for an increase toward the $2,050 level.
Oil Price Technical Analysis
On the hourly chart of WTI Crude Oil at FXOpen, the price struggled to clear the $89.50 resistance zone against the US Dollar. The price started a fresh decline below the $87.80 support.
There was a steady decline below the $85.75 support and the 50-hour simple moving average. Finally, the price declined below the $82.80 support before the bulls appeared. A low is formed near $81.90 and the price is now recovering above the 50-hour simple moving average.
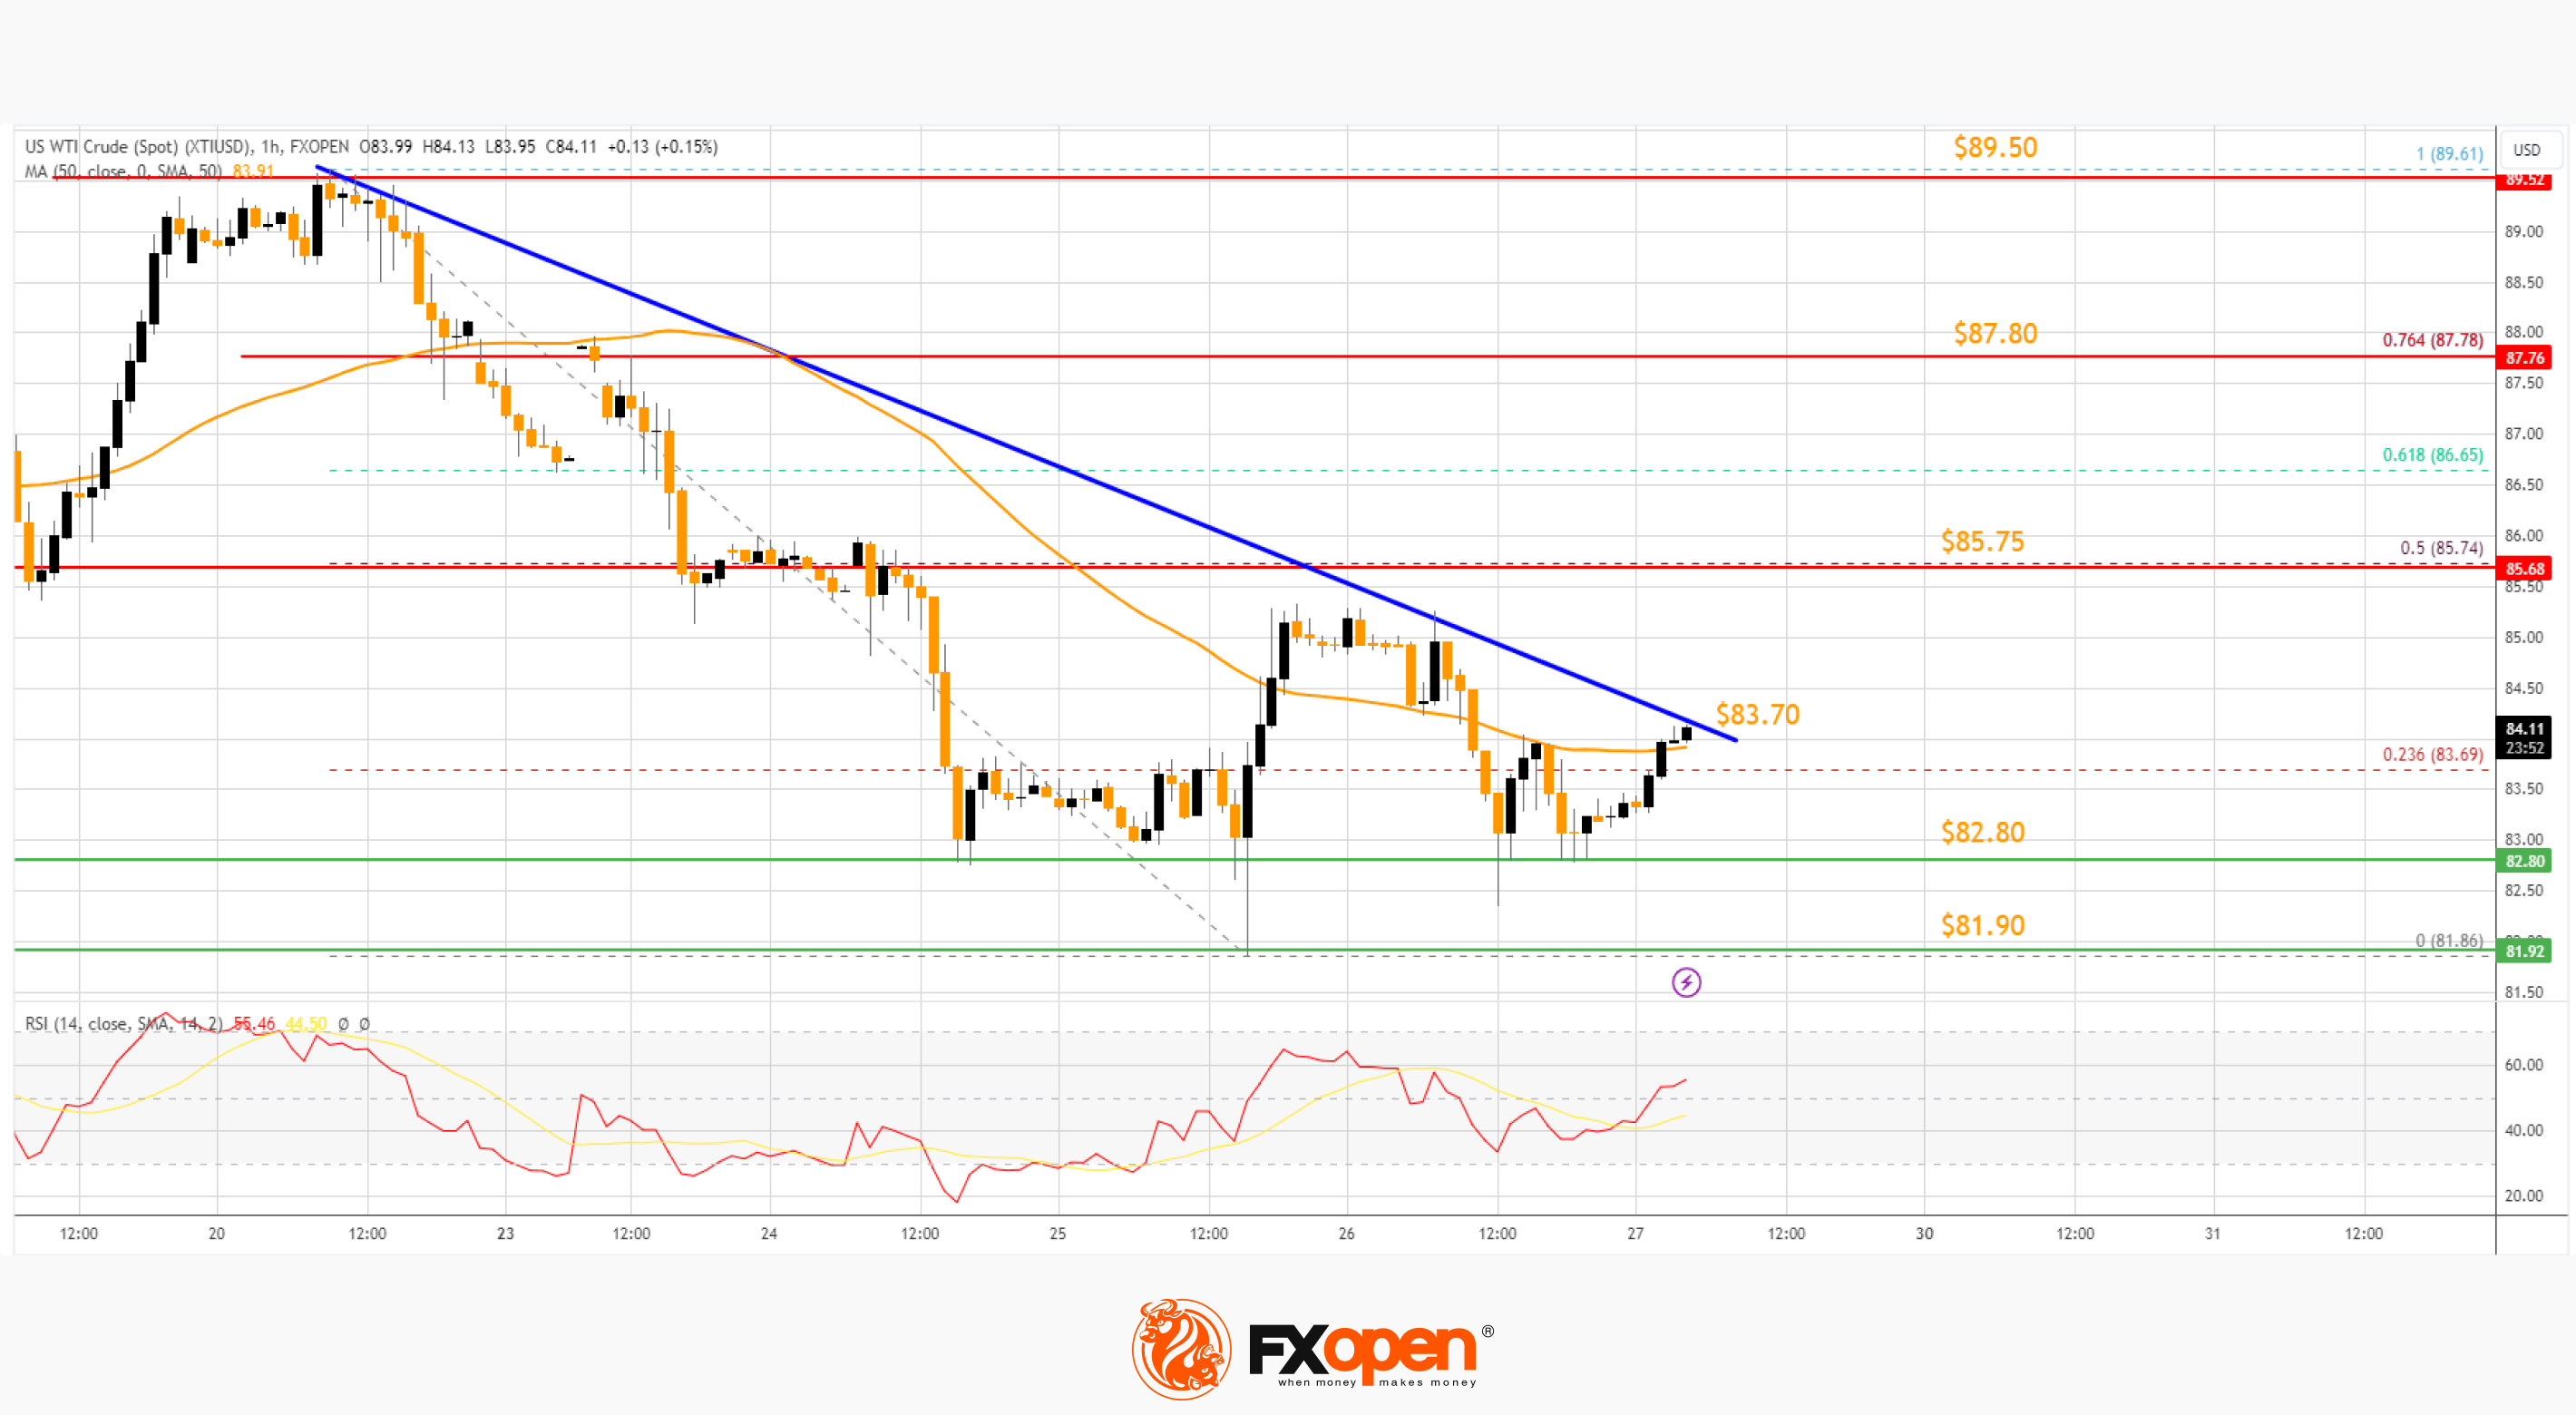
It is now consolidating above the 23.6% Fib retracement level of the downward move from the $89.61 swing high to the $81.86 low, and the RSI moved above 50. If there is a fresh increase, it could face resistance near $83.70 and a connecting trend line.
The first major resistance is near the 50% Fib retracement level of the downward move from the $89.61 swing high to the $81.86 low at $85.75. Any more gains might send the price toward the $87.80 level.
Conversely, the price might continue to move down and revisit the $82.80 support. The next major support on the WTI crude oil chart is $81.90. If there is a downside break, the price might decline toward $80.00. Any more losses may perhaps open the doors for a move toward the $78.50 support zone.
Start trading commodity CFDs with tight spreads (additional fees may apply). Open your trading account now or learn more about trading commodity CFDs with FXOpen.
This article represents the opinion of the Companies operating under the FXOpen brand only. It is not to be construed as an offer, solicitation, or recommendation with respect to products and services provided by the Companies operating under the FXOpen brand, nor is it to be considered financial advice.
Stay ahead of the market!
Subscribe now to our mailing list and receive the latest market news and insights delivered directly to your inbox.


Latest articles

AI Valuations Are Back in the Spotlight
Artificial intelligence remains the dominant investment theme of 2026, but investors are increasingly questioning whether AI stock valuations are keeping pace with reality.
💰 Big Tech continues to invest at an unprecedented scale, with hyperscaler AI spending projected to exceed $800

AUD/CAD: Months of Indecision — Is a Breakout Finally Coming?
The Australian dollar has clawed back most of its end-of-June losses, when it touched three-month lows against the greenback amid escalating Middle East tensions. Since then, sentiment has improved: the RBA's Assistant Governor Sarah Hunter signalled the board stands ready

USD/JPY: Battling at the Top of the Triangle
On 3 July, Japan's Finance Minister, Satsuki Katayama, stated that the Ministry of Finance remains in close contact with US authorities regarding developments in USD/JPY as the yen traded near its weakest level in almost 40 years. Similar verbal