


Four Popular Strategies for Swing Trading
FXOpen
Swing trading is a style employed by many traders looking to combine the intensity of day trading with the strategic planning of long-term investing. In this article, we’ll be taking an in-depth look at four of the best strategies for swing trading, offering information on entry criteria, stop-loss placements, and taking profits.
What Is Swing Trading?
Swing trading is a style of trading that aims to profit from market movements over the course of a few days to several weeks. Unlike day trading, where positions are almost always opened and closed within the same day, swing traders hold positions for more than one day. They can be thought of as a happy medium between short-term day traders and long-term position traders/investors.
Generally speaking, swing traders will attempt to capture the bulk of short-term fluctuations within a broader trend. In other words, they attempt to buy an asset at the bottom of a “swing” and sell at the top, capitalising on temporary changes in price.
One of the main benefits of using swing trading techniques is the potential for significant returns over a relatively short period. The extended holding period, compared to shorter-term styles, allows for larger price movements to play out.
Moreover, because swing traders typically pay the most attention to the 1-hour, 4-hour, daily, and weekly charts, they can manage their trades without needing to constantly monitor the market.
However, swing trading methods aren’t without their disadvantages. The extended holding period exposes swing traders to overnight and weekend market events, which could lead to potential losses or even a “gap” up or down that doesn’t trigger the trader’s stop loss. Additionally, the importance of technical analysis in swing trading can’t be understated; accurately predicting price swings is crucial for success, so there may be a steeper learning curve associated with this form of trading.
Four Simple Swing Trading Strategies
Now that we’ve taken a brief look at the basics of swing trading let’s move on to four swing trading setups you can get started with right away. While we’ve applied these strategies to the commodities and forex markets, they can also be used as stock market swing trading setups.
Want to follow along? You can open up FXOpen’s free TickTrader platform to find each of the following tools ready to help you create your own swing trading stock strategy.
Fibonacci Retracement Pullback
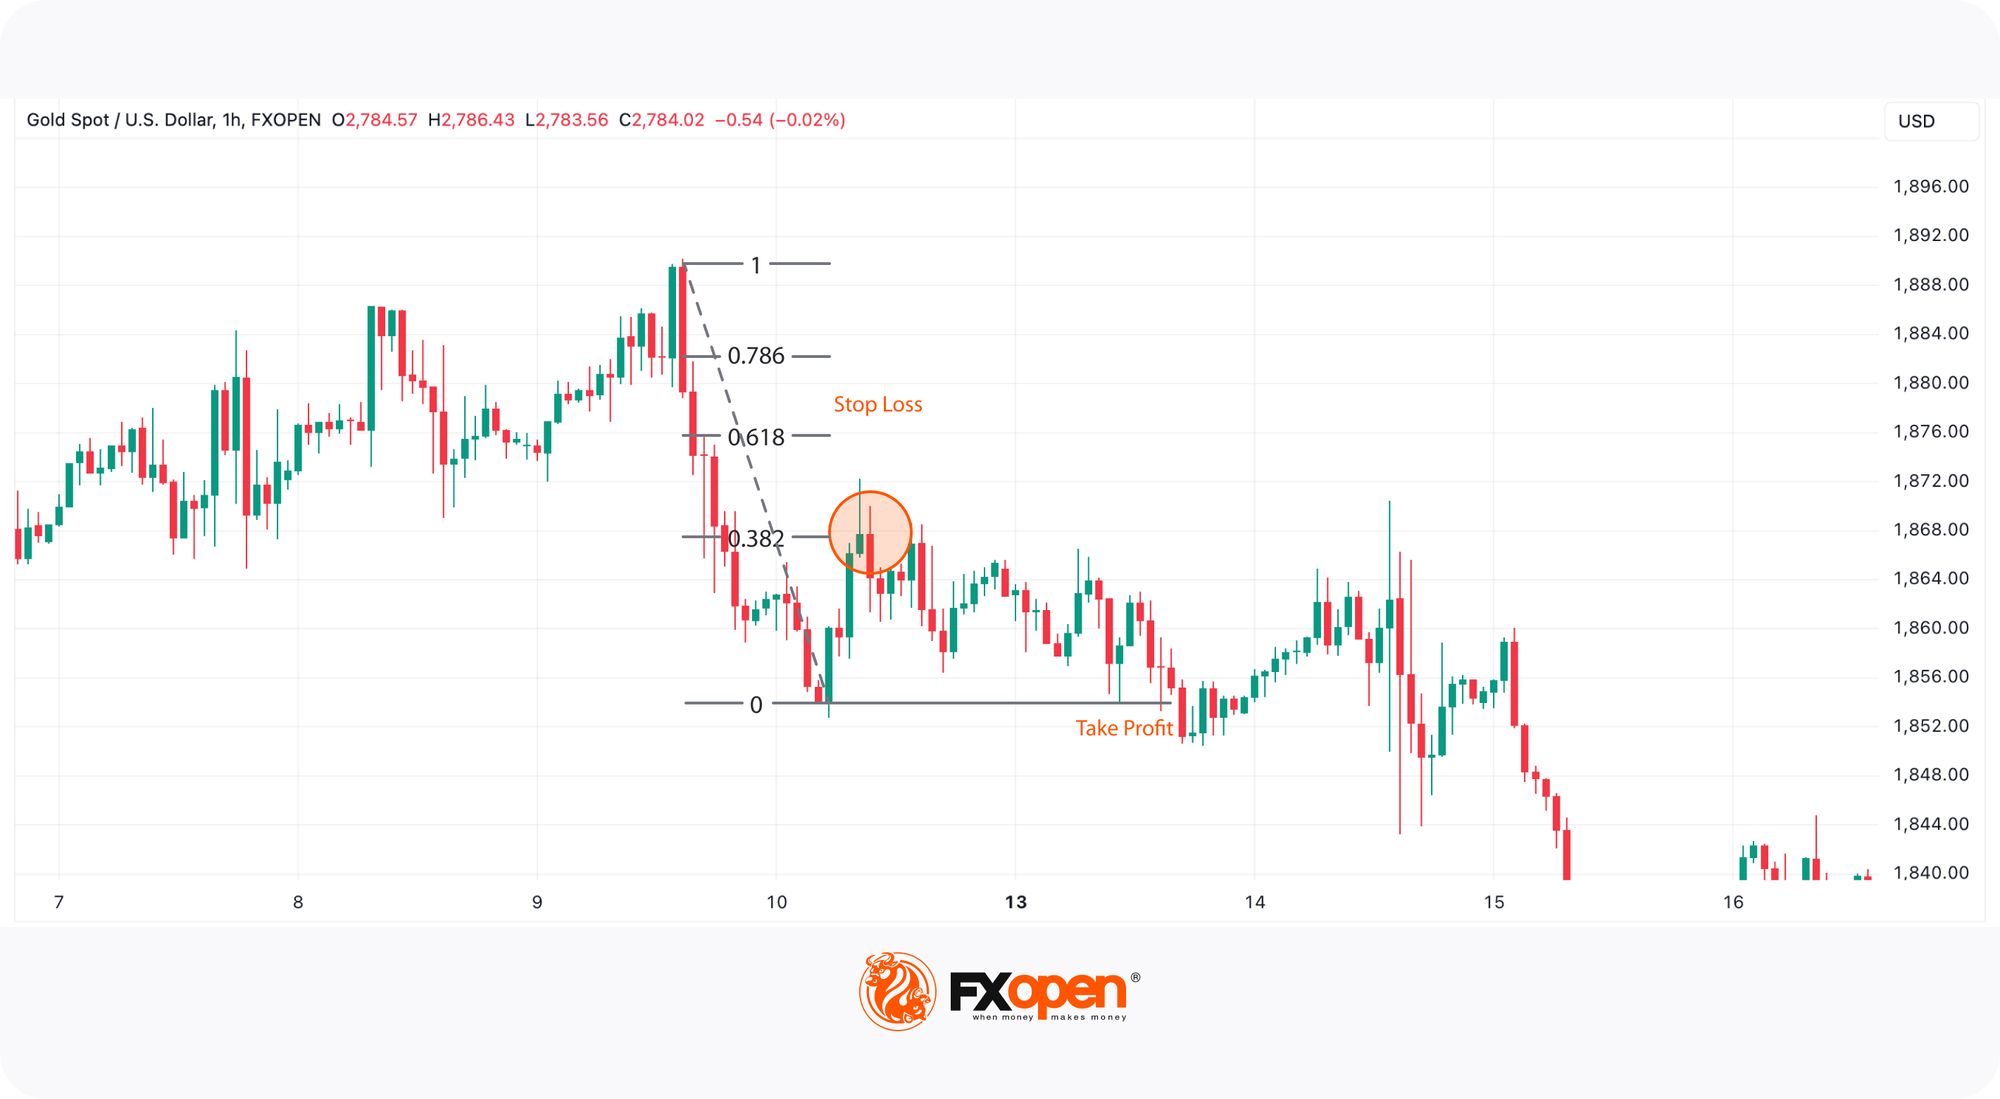
The Fibonacci retracement tool has long been favoured by swing traders for its ability to highlight specific areas of support/resistance where possible reversals might occur. The most significant levels are 38.2%, 50%, and 61.8%.
Swing traders use this tool to anticipate potential pullbacks within a larger trend. In an uptrend, for instance, traders will look for the price to pull back to a Fibonacci level before resuming its upward move. Conversely, in a downtrend, they'll anticipate a bounce back up to a Fibonacci level before the trend continues.
To use this strategy, we need to set up a Fibonacci retracement. First, traders identify the broader trend that exists on their preferred timeframe. Then, they mark the most recent significant high and low in the trend. If they are looking at an uptrend, they apply the first point to the low and the second to the high and do the opposite for a downtrend.
When the price begins to approach the 38.2%, 50%, or 61.8% levels, we wait for signs of a reversal. As a simple swing trading strategy, we’ll just look for the hammer and shooting star candlestick patterns, but you can include whichever reversal patterns you prefer. When the candle closes and confirms the pattern, we can enter.
Stop losses can either be set just beyond the entry level, the next level, or the high/low of the entire tool, depending on the risk tolerance. Traders often begin taking profits at the high/low of the retracement or at the next significant support/resistance level.
Bollinger Bands with an Impulsive Candle

Bollinger Bands are a valuable tool that helps traders identify volatility and areas where the price may be overbought or oversold. They’re composed of three lines: the middle line being a simple moving average (SMA) and the other two representing standard deviations of price.
For this strategy, the default settings of the Bollinger Bands are suitable. For reference, the length of the SMA should be 20, while the multiplier should be 2. The crux of this strategy involves watching for reactions when the price touches or crosses a band, then waiting for an impulse (engulfing) candle through the SMA to confirm a change in direction and likely trend continuation. It’s best to look for this candle to close near its high/low, effectively printing a large, solid candle.
Once we see this impulse candle, we enter as the candle closes. We can set stop losses either above/below the impulse candle or just beyond the Bollinger Bands. Traders typically close the position when the price closes back above/below the SMA.
RSI Divergence
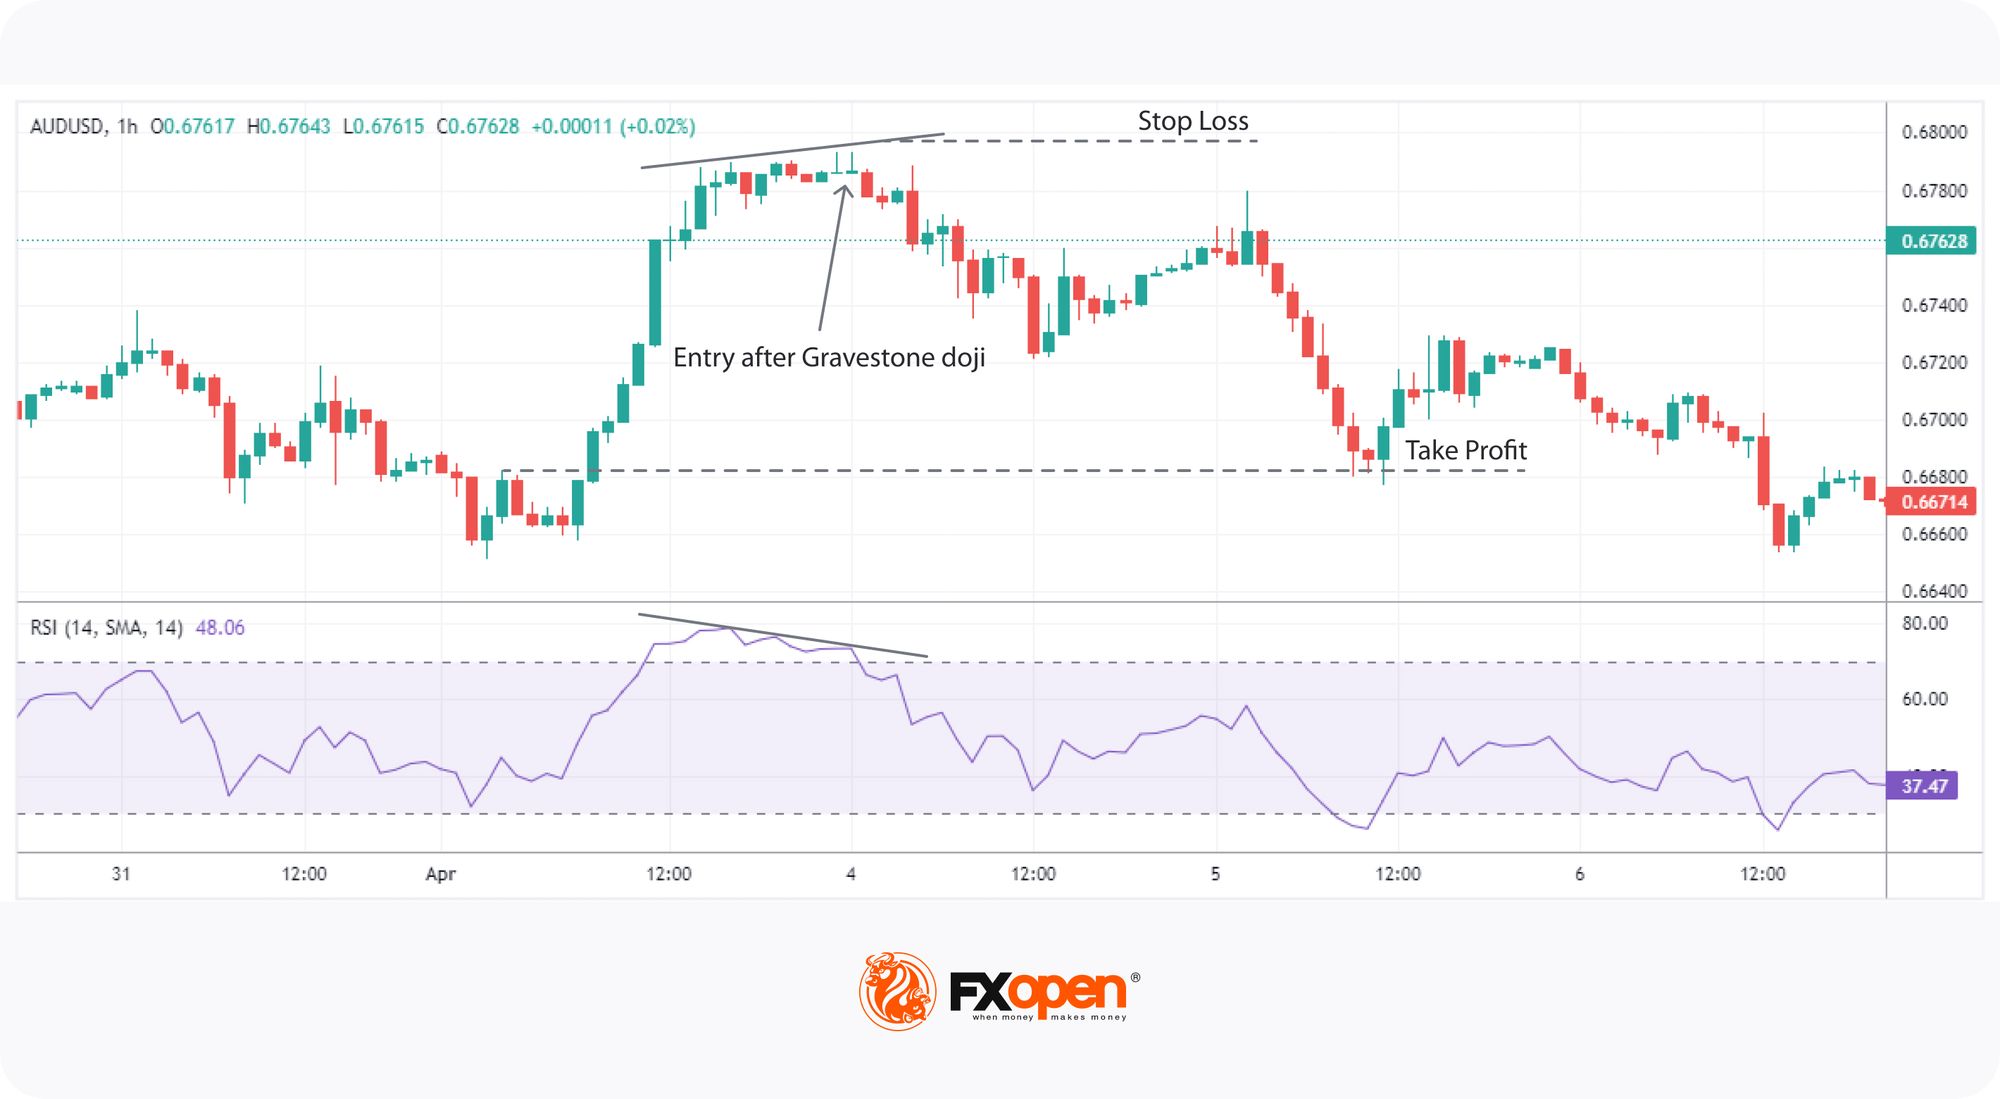
The relative strength index (RSI) is a momentum oscillator that quantifies the speed and change of an asset’s movements. It oscillates between 0 and 100, and traditionally, a level above 70 indicates overbought conditions, while a level below 30 indicates oversold conditions. When RSI moves into these areas, the likelihood of a reversal increases.
Divergences are identified when the price of an asset contrasts with the direction of the RSI. For instance, if the price is making higher highs while the RSI is making lower highs, this is considered a bearish divergence. Conversely, a bullish divergence occurs when the price makes lower lows while the RSI makes higher lows. Candlestick patterns such as the hammer and gravestone doji can further validate these signals.
For this swing trade system, we will need the RSI indicator with its default setting of 14. We will wait for RSI to move beyond 30 or 70, then watch for a divergence to appear. This will commonly occur in areas of support or resistance. Once we spot the divergence, we will wait for a reversal pattern to appear. When the candle closes, we can enter the position.
Unlike the previous two strategies, there’s no defined area to place a stop loss here. However, a stop just beyond the entry candle should suffice. The theory states that profits can be taken at a nearby support/resistance level or when RSI moves into overbought/oversold conditions, depending on the direction of the trade.
Keltner Channel Breakout
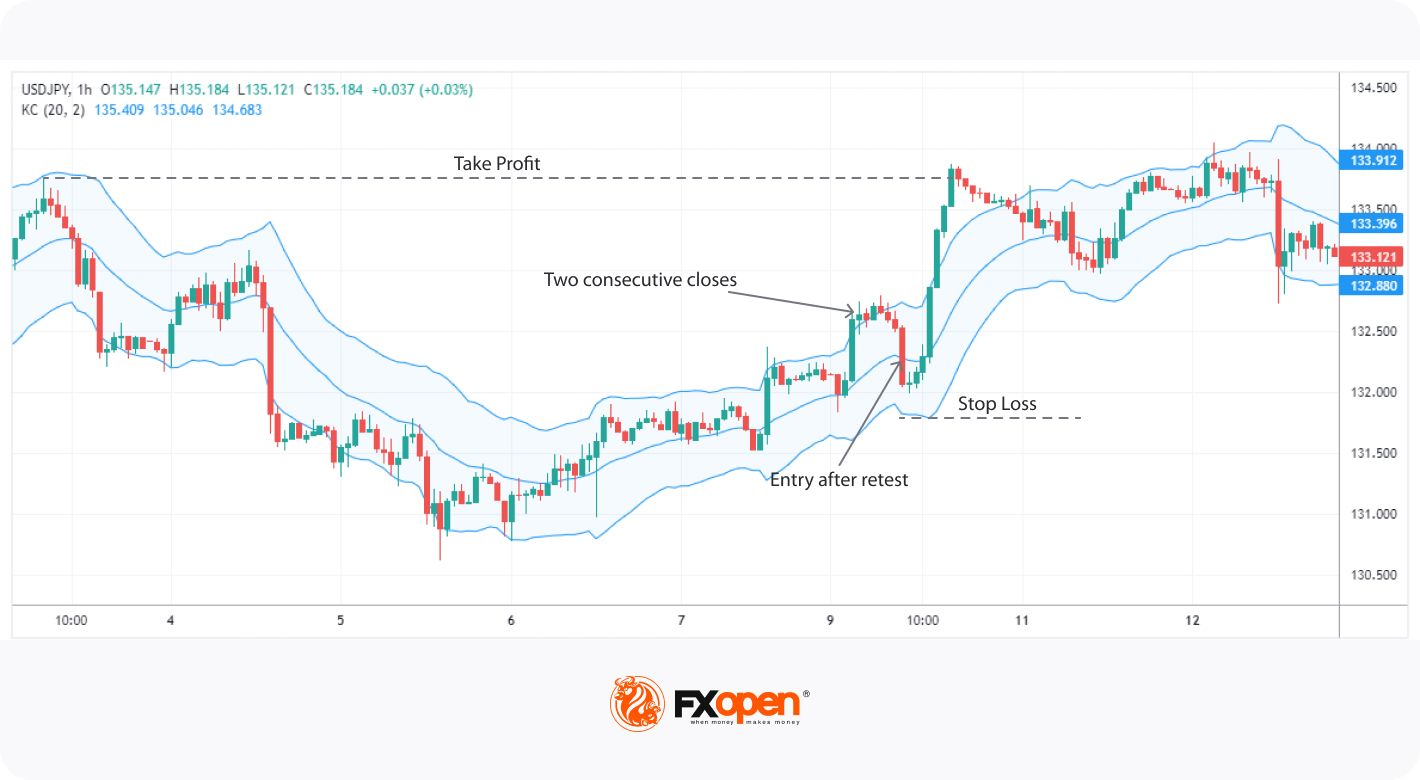
The Keltner Channels is a volatility-based indicator that’s closely related to Bollinger Bands. However, instead of plotting standard deviations of price, it uses the average true range (ATR) to measure volatility. It’s made up of three lines: the middle line is an exponential average, while the upper and lower lines are multiples of the price’s ATR.
The Keltner Channels indicator is effective at helping swing traders jump on trends. After identifying a broader trend, we can look for certain signals from the channels to find suitable entry points.
To start, we will initialise the indicator with an ATR length of 20 and a multiplier of 2. Then, we will look for two consecutive closes outside of the channel. Once these closes are observed, we can wait for a retracement back to the EMA and enter as soon as it breaks it again. In other words, we are identifying a potential breakout and waiting for a pullback to enter.
Stop losses can be placed just beyond the opposing line. Profits may be taken at nearby support/resistance levels, or we can simply trail our stop above/below the opposing line if we’re unsure of a suitable profit target.
Final Thoughts
In conclusion, swing trading offers a balanced approach, sitting between intraday and position trading styles. Short-term swing trading allows traders to take a more active approach, while long-term swing trading enables them to benefit from market trends without getting caught up in daily volatility. Either way, you’re now equipped with four potent strategies that can be used to create your own comprehensive swing trading plan.
Feeling ready to put your newfound knowledge to the test? You can open an FXOpen account to apply these strategies across 600+ markets and benefit from lightning-fast execution, tight spreads, and the advanced TickTrader platform. Good luck!
This article represents the opinion of the Companies operating under the FXOpen brand only. It is not to be construed as an offer, solicitation, or recommendation with respect to products and services provided by the Companies operating under the FXOpen brand, nor is it to be considered financial advice.
Stay ahead of the market!
Subscribe now to our mailing list and receive the latest market news and insights delivered directly to your inbox.


Latest articles

Weekly Market Insights with Gary Thomson: US Inflation, UK GDP, Chair Warsh Testimony, and Earnings
In this video, we’ll explore the key economic events and market trends, shaping the financial landscape. Get ready for insights into financial markets to help you navigate the week ahead. Let’s dive in!
In this episode of Market

GBP/AUD Analysis: The Tug-of-War Begins
Oil is back in the driver's seat, and both the pound and the aussie are feeling its grip. The Bank of England held rates at 3.75% in June, but with UK inflation at 2.8% and crude oil climbing

Australian Dollar Holds Above the Current Market Profile
The minutes from the Reserve Bank of Australia's (RBA) June meeting, released on 30 June, suggested that policymakers are not yet ready to rule out further policy tightening. Board members noted persistent excess demand and broad-based inflationary pressures across the