


How to Use Correlations in Trading
FXOpen
In the dynamic world of trading, utilising correlations can be a valuable tool for traders. This article explores the concept of correlations and their significance in forex trading. Additionally, we discuss some practical applications for trading with correlations, emphasising the importance of staying informed and managing risk in the ever-evolving financial landscape.
Measuring Currency Correlation in Forex Trading
In the context of forex trading, correlation refers to the extent to which two currency pairs move in relation to each other. Positively correlated currency pairs would rise or fall together, while negatively correlated ones would move in different directions. Traders have various methods at their disposal to gauge the correlation level, each with its own set of advantages and drawbacks.
Correlation Coefficients
Typically expressed as a value between -1 and 1, a Correlation Coefficient indicator is available on most trading platforms, including TickTrader. This shows the strength and direction of the relationship between two currency pairs. Positive values imply a positive correlation, while negative values suggest a negative correlation. Values above 0.75 and below -0.75 indicate high positive and high negative correlations, respectively, while values between -0.30 and 0.30 can be read as low or no correlation. This method provides a clear numeric value, though it may oversimplify complex market dynamics. It can also be unreliable since it is based solely on historical values.
Statistical Software
Statistical software can automatically calculate and display correlations, saving time and effort. However, it's essential to understand the algorithms behind these calculations for better decision-making. This method is convenient and time-efficient, and it also offers real-time correlation data. On the other hand, traders may become overly reliant on software without fully understanding the underlying factors affecting correlation.
Manual Analysis
Some experienced traders prefer to manually analyse price charts or other historical data to identify correlations. This method allows for a more in-depth understanding of how and why correlations change over time. This can lead to more nuanced insights and a deeper understanding of market dynamics. However, it is time-consuming and may require advanced analytical skills, like the ability to conduct technical and fundamental analysis of the traded assets.
Real-Life Applications of Forex Pairs Correlation
Currency pair correlation is not merely a theoretical concept; it holds practical significance in the world of forex trading. Here, we explore how these correlations are applied in real-life trading scenarios.
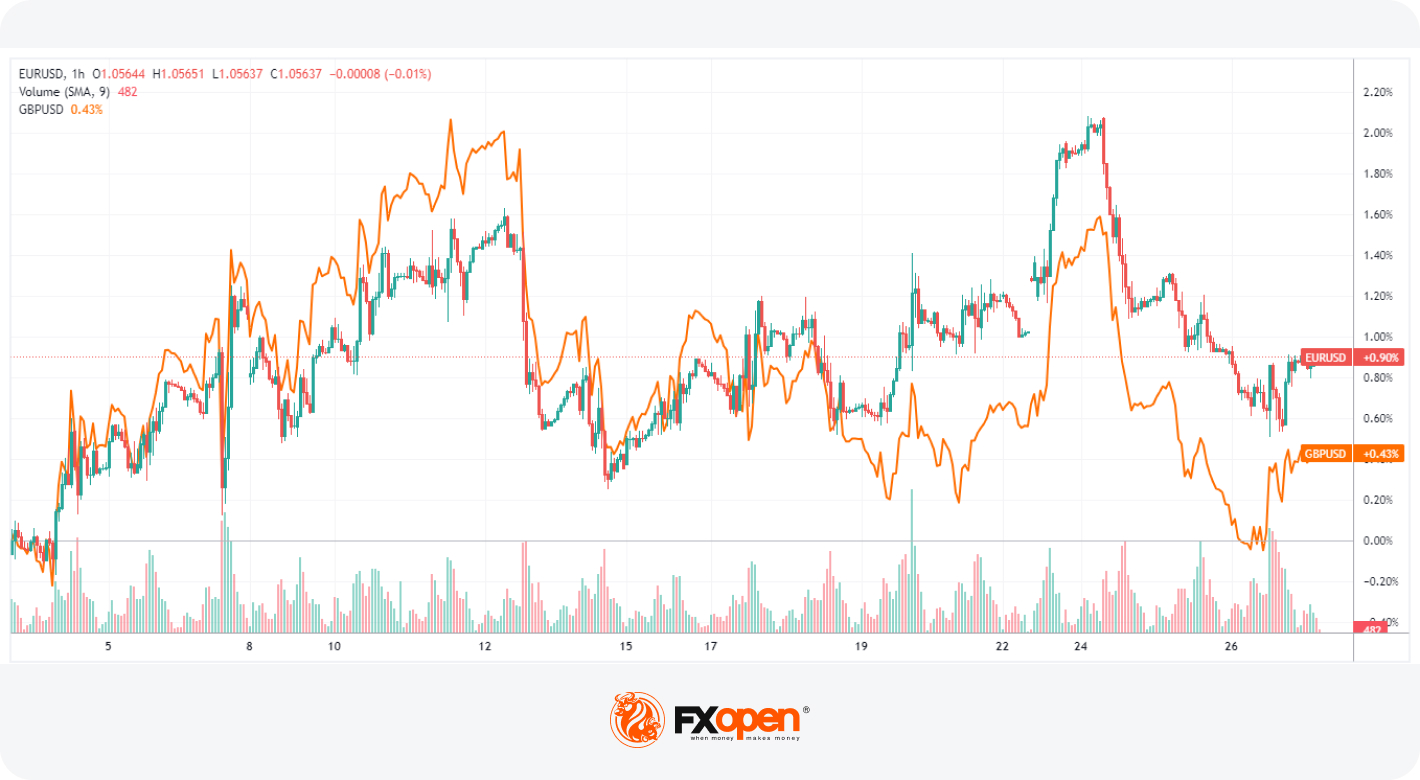
Trading Positively Correlated Pairs
Traders often use positively correlated pairs to confirm trends. For example, if EUR/USD and GBP/USD are both moving upwards, this can indicate a strong bullish trend in Europe. Traders can capitalise on this by entering long positions in these pairs, enhancing their potential gains. Scalpers may use minute fluctuations in positively correlated pairs to execute multiple quick, short-term trades. Traders may also engage in arbitrage by taking advantage of discrepancies in pricing between positively correlated pairs. If one pair lags behind in responding to a fundamental event, arbitrageurs can exploit the price difference for profit.
If you're dealing with positively correlated assets, consider adding indicators like Moving Averages, Relative Strength Index (RSI), and Stochastic Oscillator to your analysis. These can help you spot trends, momentum, and overbought/oversold conditions that align with the correlated movements.
You can visit FXOpen and discover some of the best forex correlation pairs on the free TickTrader trading platform.
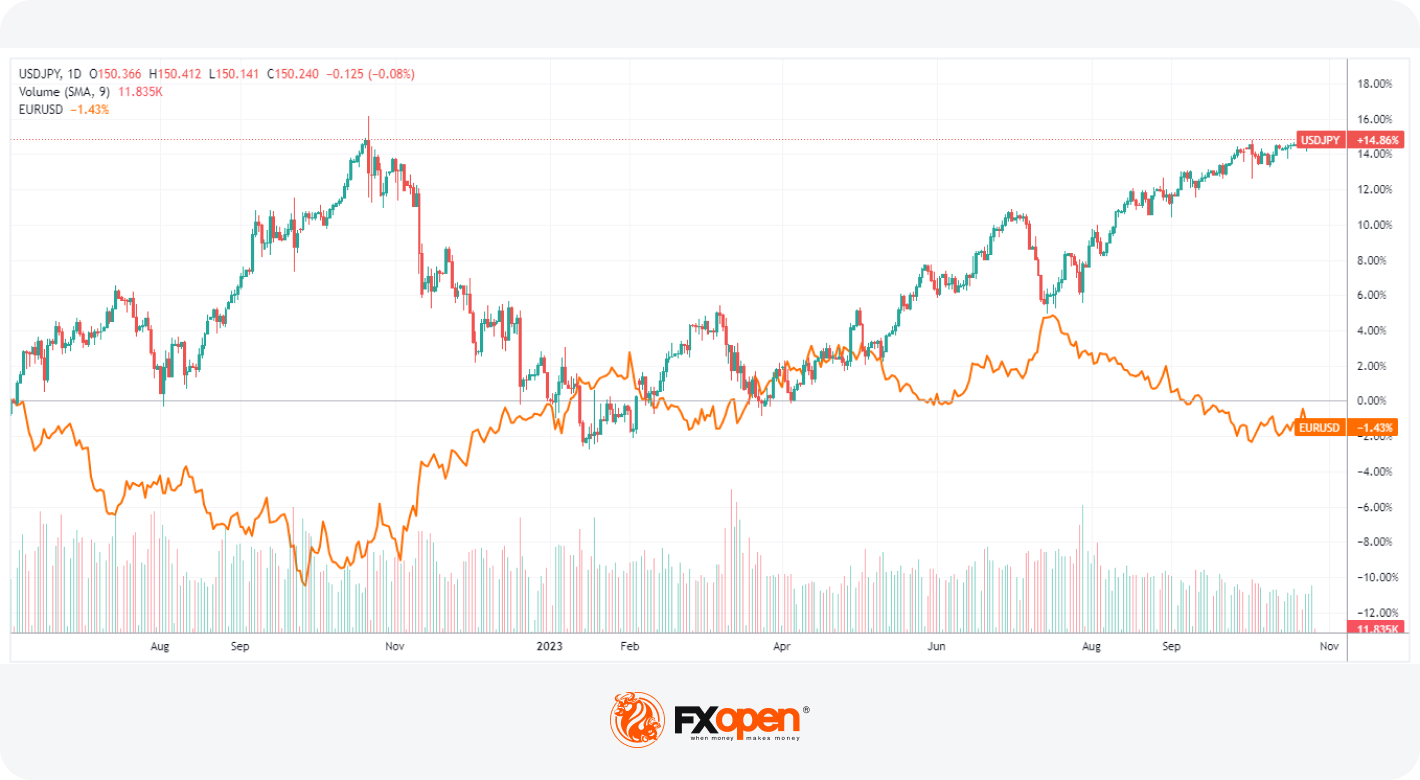
Hedging with Negative Currency Pair Correlation
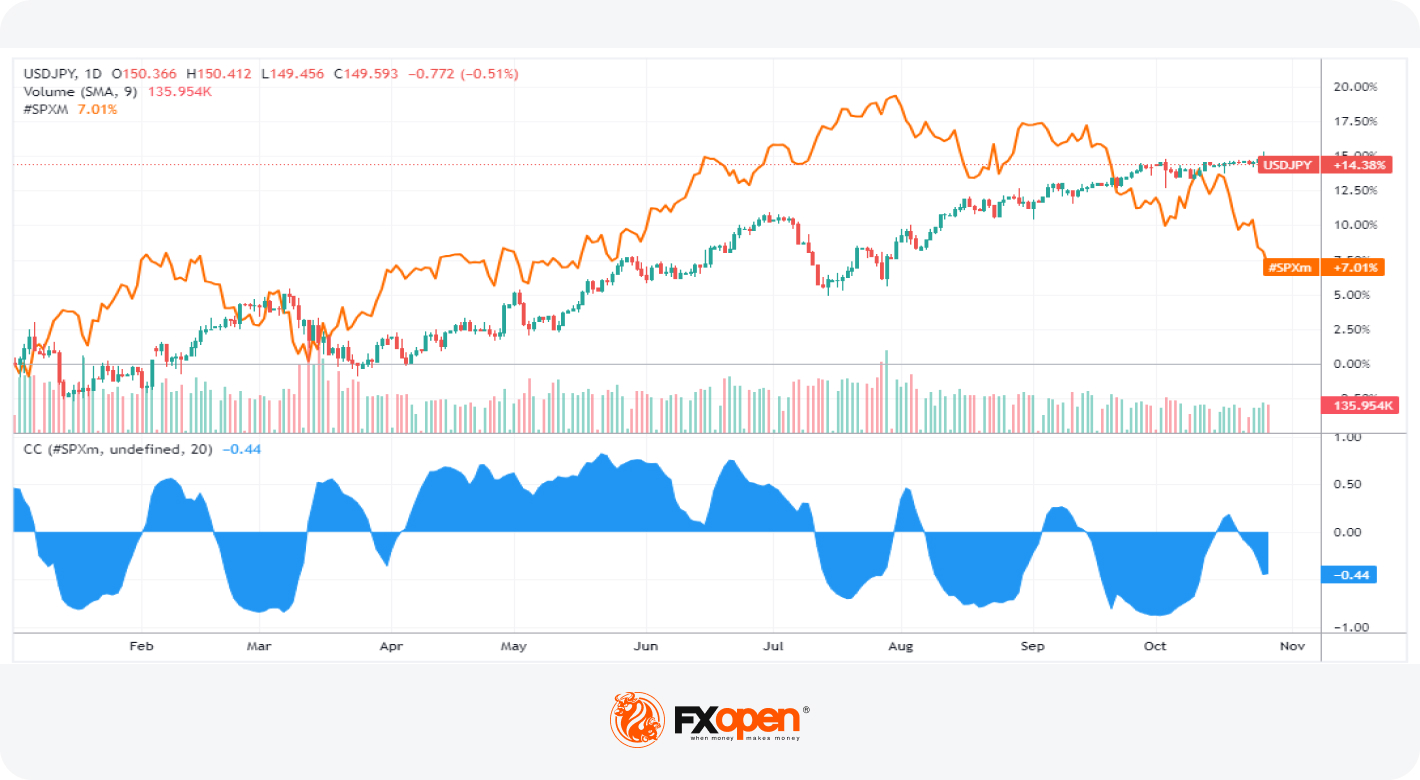
Negative correlations between currency pairs can be employed for risk management and hedging by holding positions in two negatively correlated pairs. Thus, traders can reduce risk by offsetting potential losses in one pair with gains in the other. For example, USD/JPY and EUR/USD often exhibit a negative correlation, so a long position in both can help hedge against adverse price movement. This can be helpful when major events are expected, like interest rate announcements, for example.
When trading negatively correlated assets, technical indicators like Bollinger Bands, MACD (Moving Average Convergence Divergence), and Rate of Change (ROC) can assist in identifying reversals and volatility and measuring divergences between the assets.
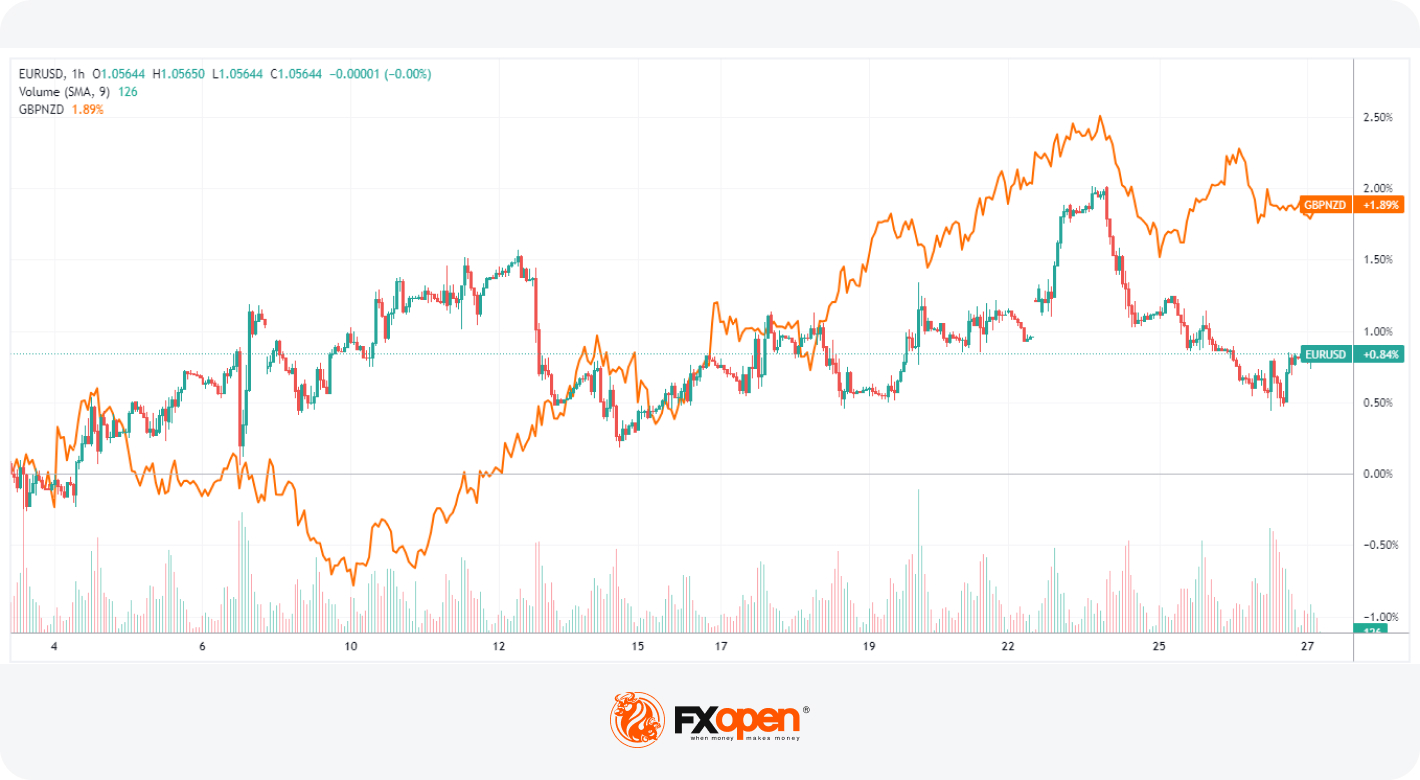
Utilising Low Forex Market Correlation
Utilising low correlation between currency pairs can be another valuable strategy for traders looking to additionally diversify and enhance their portfolios and minimise risk. When one pair, e.g. EUR/USD, is experiencing adverse price movements, the other, e.g. GBP/NZD, may remain stable or move favourably. This can help traders reduce overall portfolio risk. Utilising low forex market correlation allows a more robust and resilient trading strategy.
Forex and Stock Market Correlation
The correlation between the forex market and the stock market, while often significant, is dynamic and can shift due to various economic and geopolitical factors. In periods of economic stability and positive market sentiment, stocks tend to rise, which often aligns with a stronger domestic currency. Traders can capitalise on this positive correlation by strategically investing in currency pairs that align with the prevailing stock market trends. On the other hand, during times of economic uncertainty or crises, this correlation may transform into a negative one. Here, traders can find opportunities in safe-haven currencies, as these currencies tend to strengthen when stocks decline.
Conclusion
By employing a combination of technical indicators and risk management strategies, traders can harness the power of market correlations to make informed decisions, diversify portfolios, and ultimately enhance their trading endeavours. You can open an FXOpen account and find out how to extend your trading opportunities.
This article represents the opinion of the Companies operating under the FXOpen brand only. It is not to be construed as an offer, solicitation, or recommendation with respect to products and services provided by the Companies operating under the FXOpen brand, nor is it to be considered financial advice.
Stay ahead of the market!
Subscribe now to our mailing list and receive the latest market news and insights delivered directly to your inbox.


Latest articles

Weekly Market Insights with Gary Thomson: The Week of Central Banks and Earnings
In this video, we’ll explore the key economic events and market trends, shaping the financial landscape. Get ready for insights into financial markets to help you navigate the week ahead. Let’s dive in!
In this episode of Market

Intel at a Crossroads: Earnings Beat Meets Technical Resistance
Intel has just delivered its strongest quarter in over fifteen years, and the market reaction says it all. Q2 2026 revenue surged 25% year-over-year to $16.1 billion, crushing the consensus estimate of $14.42 billion, while adjusted EPS of

Tesla: Complex Range Structure Breaks Down Following Quarterly Earnings
Tesla released its Q2 2026 results after the market closed on 22 July. Revenue increased 26% year-on-year to $28.24 billion, while vehicle deliveries reached a record 480,126 units. However, operating margin fell sharply to 1.4%, down from