


FXOpen
Price charts form shapes that hint at the market’s next move, and one of them is the symmetrical triangle. Unlike patterns that clearly point to bullish or bearish outcomes, this formation builds tension as buyers and sellers converge, leaving traders waiting for the breakout. In this article, we will discover how the symmetrical triangle forms, what signals it may provide, and how it can be implemented into a trading strategy.
What Is a Symmetrical Triangle Pattern in Trading?
A symmetrical triangle is a chart pattern that relates to the triangle group, which also includes ascending and descending triangles. It’s a bilateral formation, so it may signal a fall or rise in the price.
Moreover, as with ascending and descending triangles, it can occur in an uptrend and downtrend and reflect a potential trend reversal or continuation. Still, according to the work Technical Analysis of Stock Trends by Robert D. Edwards and John Magee, in 75% of cases, the triangle is a continuation signal. Therefore, it can be assumed that a bullish symmetrical triangle pattern occurs in an uptrend, while a bearish symmetrical triangle pattern appears in a downtrend.
The triangle consists of two sloping trendlines – the upper line connects at least two lower highs, while the lower line goes through at least two higher lows. Like ascending and descending triangles, the symmetrical formation appears in market consolidation periods.
The formation can be found on any timeframe of any asset. That is, there are symmetrical triangles in stock, commodity, cryptocurrency*, and forex markets. The triangle forms from several minutes to several months, depending on the timeframe.
Descending, Ascending, and Symmetrical Triangles: The Differences
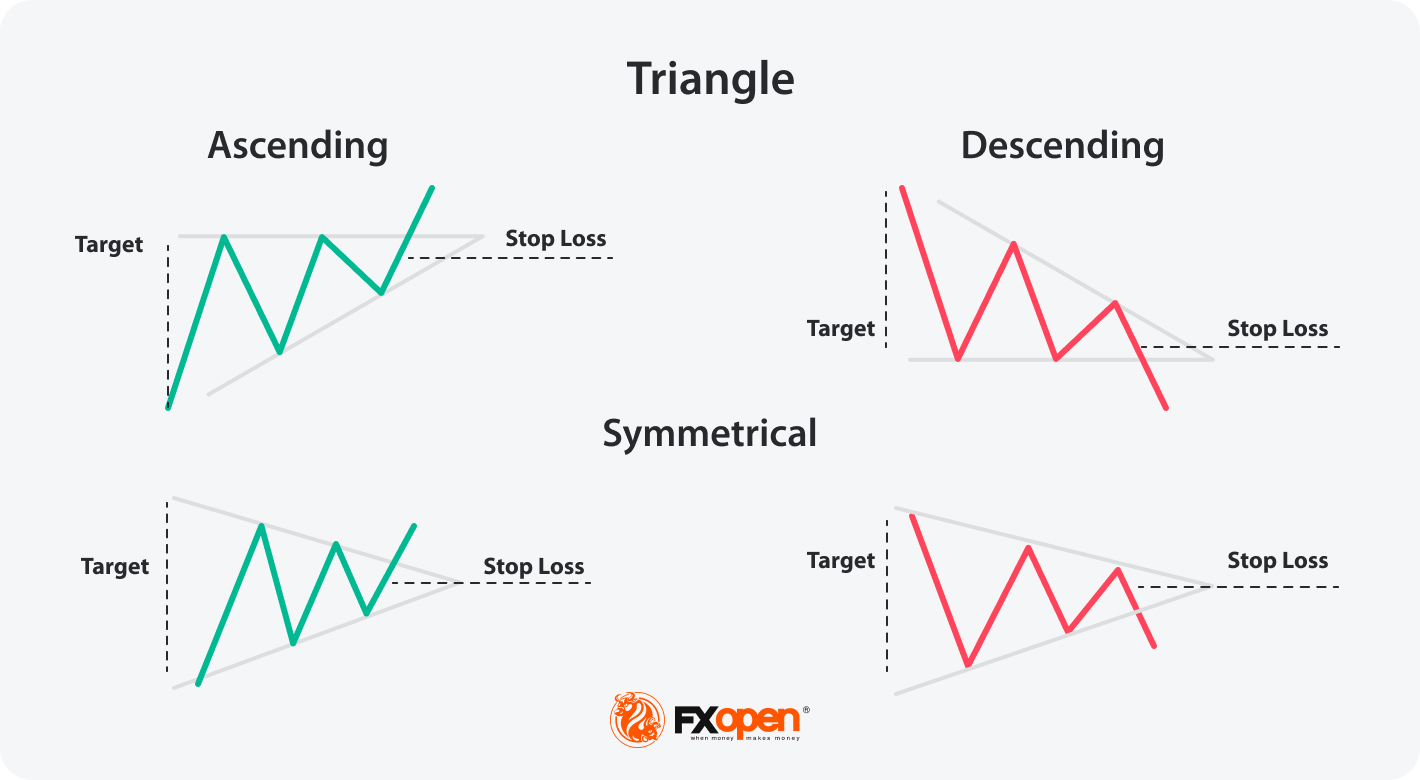
Ascending, descending, and symmetrical triangles comprise a group of triangle formations. Each of them may reflect a trend continuation and reversal. The main difference is the signals they provide. The ascending triangle is bullish, and it reflects only a price rise. The descending triangle is bearish, and it signals only a price fall. The symmetrical triangle in trading can be both bullish and bearish.
To distinguish between them, a trader needs to draw trendlines.
- In an ascending triangle, the upper line is horizontal, and the lower line is angled up, connecting higher lows.
- In a descending triangle, the upper boundary is angled down and connects lower highs, and the lower boundary is horizontal.
- In a symmetrical triangle, the upper boundary falls while the lower rises.
How May the Symmetrical Triangle Be Traded?
Most chart patterns have specific entry and exit rules, and the symmetrical triangle is no exception. Still, traders should remember that these rules don’t guarantee an effective trade. Therefore, many traders modify them to suit their trading approaches.
If you want to develop your own rules for triangle trading, consider using the TickTrader trading platform.
According to theory, the following rules can be used for long and short trades.
Entry
The idea of any triangle is to enter the market on a breakout. As the symmetrical triangle provides buy and sell signals, a trader waits for a symmetrical triangle breakout of either trendline. Let’s remember that, more often, this setup appears ahead of the trend continuation. Therefore, it’s more likely the upper boundary will be broken in an uptrend and a lower boundary will be broken in a downtrend.
Traders may open a position as soon as the breakout candlestick closes or wait for several candles to be formed in the breakout direction. The choice depends on a trader’s experience and willingness to take risks.
One of the disadvantages of the formation is the risk of a fakeout when the price moves in the previous direction. Therefore, traders use various tools to confirm price moves.
Take Profit
The common rule is to measure the widest part of the formation and calculate the same distance from the breakout point.
Stop Loss
No matter what tools traders use, many rely on the standard risk/reward ratio of 1:2 and 1:3, which can be increased if a trader feels confident.
Another trader’s method is to place the stop-loss order just under the lower trendline in a buy trade and above the upper one in a sell trade.
Symmetrical Triangle: Trading Example
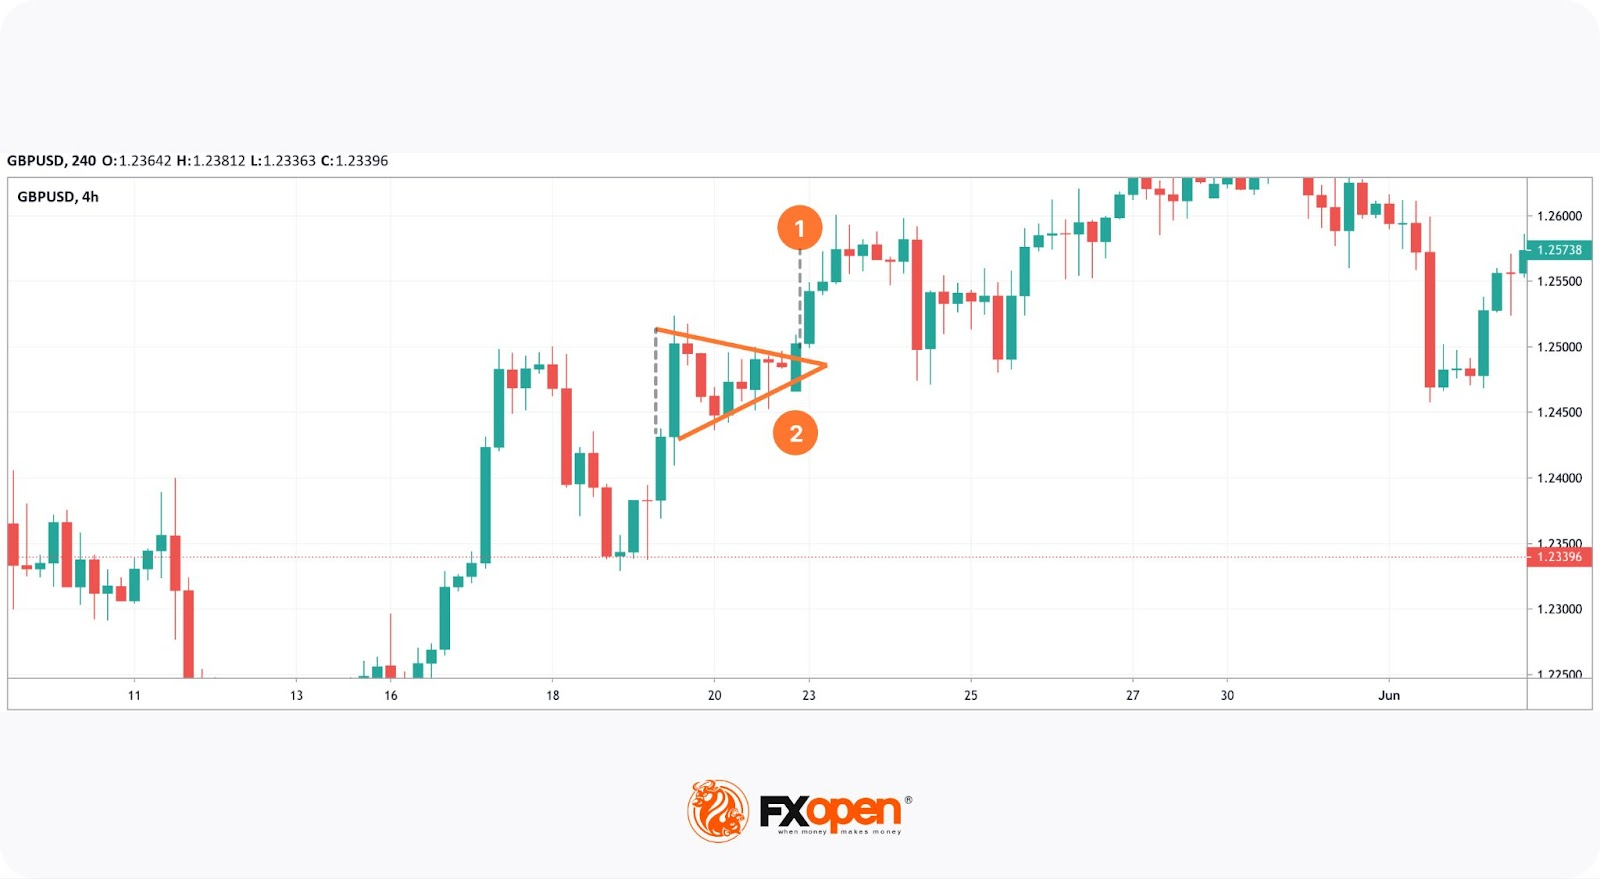
A pattern formed on the 4-hour chart of the GBP/USD pair. As it was a solid uptrend, a trader could expect it to continue. A take-profit level would equal the height of the triangle at its widest part (1) and would be set just from the breakout point. A stop-loss order could be calculated according to the 1:2 risk/reward ratio and placed at point 2.
If a trader opened a buy position as soon as the breakout candlestick closed, the setup standard rules would work. However, if they waited for several candles to form, the returns would be smaller than they could be.
Confirmation Tools
When trading with the symmetrical triangle, it's important to use additional confirmation to contribute to the accuracy of your trades. Here are some tools and techniques you may consider to use:
- Volume Surge: One of the most reliable confirmation tools is volume. A significant rise in volume during the breakout indicates strong momentum and increases the likelihood of a sustained move.
- Moving Average Crossovers: Moving averages may help confirm the trend direction post-breakout. For example, a bullish crossover (where a shorter-term moving average crosses above a longer-term moving average) after an upward breakout can confirm the upward trend.
- ADX (Average Directional Index): ADX measures the strength of a trend. A rising ADX after a breakout suggests a strong trend.
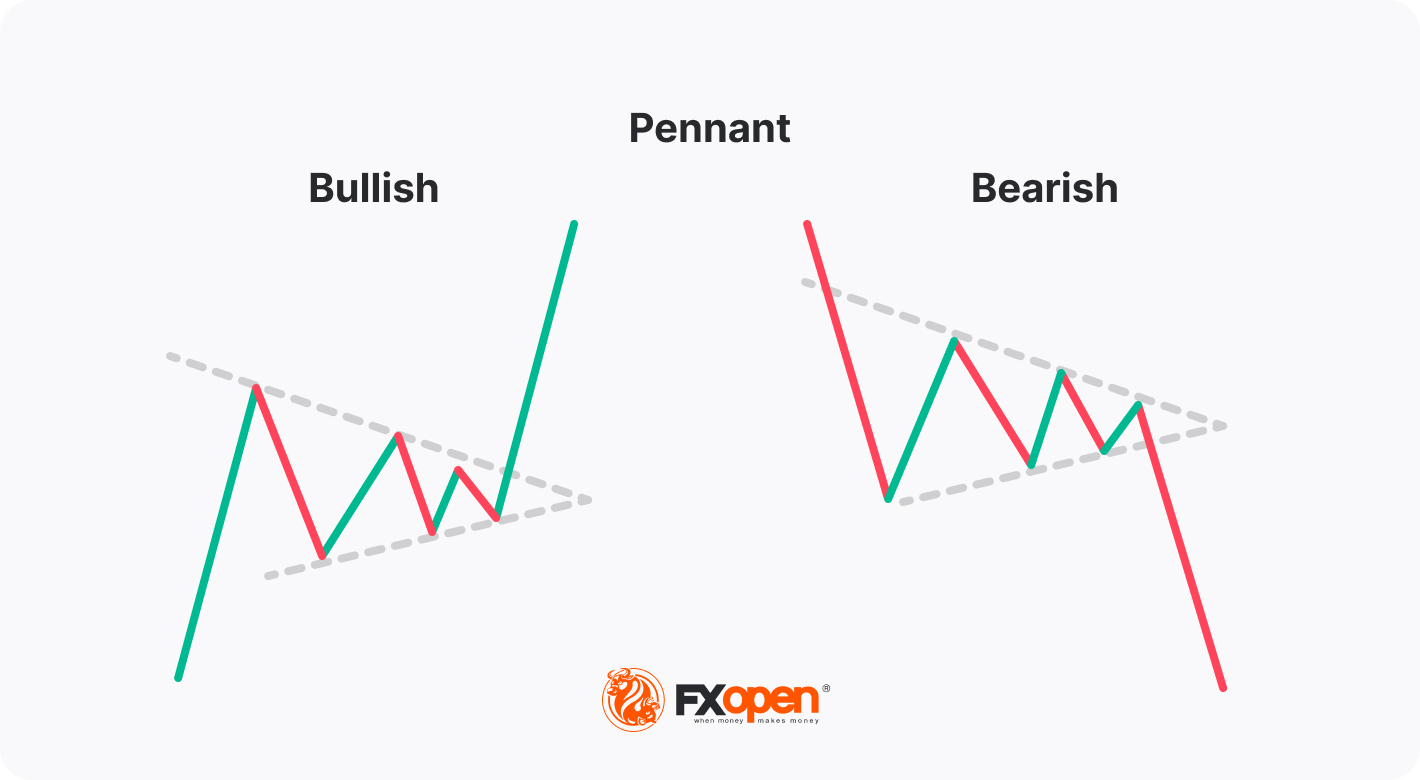
Symmetrical Triangle vs Pennant
The pennant pattern is similar to the symmetrical triangle, but it is generally smaller and occurs after a significant price movement, forming a brief consolidation before continuing in the direction of the prior trend. The symmetrical triangle can provide either a continuation or reversal signal, while the pennant typically signals a trend continuation.
Benefits and Drawbacks
The primary challenge of the symmetrical triangle is its confusing signals. However, this is not the only aspect you should consider when using this chart formation.
Benefits
- It occurs on any timeframe. Triangles earned recognition due to their ability to be formed on every timeframe. However, if the trend is solid, the signals may be more reliable.
- It is used when trading various assets. Traders look for the symmetrical triangle on stocks, commodities, cryptocurrencies*, indices, and currencies price charts.
- It requires a few tools. A trader only needs to draw two lines to determine the pattern on a chart. You can practise on the TickTrader trading platform.
- It offers exact entry and exit points. The formation offers particular entry and exit points, which can be used directly or with little corrections according to a trader's approach.
Drawbacks
- It may be confusing. Is the symmetrical triangle bullish or bearish? Unlike ascending and descending setups, this formation could be either.
- Fakeouts. There is a significant risk of a false breakout, as triangles are consolidation formations, reflecting market uncertainties.
- It may fail. As with other patterns, there is no guarantee the price will behave according to a triangle's rules.
The Bottom Line
The reliability of triangle’s signals depends on market conditions and the skills of the trader. Before implementing the symmetrical triangle in forex, or any other market, traders learn its unique features, test it in real market conditions, and adjust its rules to their trading approaches.
If you want to apply different strategies with the triangle to the live markets, you can consider opening an FXOpen account and access tight spreads and low commissions. Good luck!
FAQ
How May Traders Identify a Symmetrical Triangle Trading Pattern?
A symmetrical triangle is identified when two symmetrical converging trendlines connect a series of lower highs and higher lows on a price chart.
What Is a Symmetrical Triangle Pattern in Crypto*?
In cryptocurrency trading, the symmetrical triangle functions the same way as in other markets. It indicates a period of consolidation, where the price is moving between narrowing trendlines before a breakout. This formation can signal a potential sharp move in either direction once the price breaks out of it. Read our article “Crypto Chart Patterns in Trading.”*
How May a Symmetrical Triangle Be Used?
In technical analysis, the symmetrical triangle is used to identify a potential breakout after a period of consolidation. Traders watch for the price to break above or below the converging trendlines to signal the direction of the next move, typically entering a trade in the direction of the breakout with a stop loss just outside the opposite trendline. The take-profit target is commonly set by measuring the height of the triangle at its widest point and projecting that distance from the breakout point.
*Important: At FXOpen UK, Cryptocurrency trading via CFDs is only available to our Professional clients. They are not available for trading by Retail clients. To find out more information about how this may affect you, please get in touch with our team.
This article represents the opinion of the Companies operating under the FXOpen brand only. It is not to be construed as an offer, solicitation, or recommendation with respect to products and services provided by the Companies operating under the FXOpen brand, nor is it to be considered financial advice.
Stay ahead of the market!
Subscribe now to our mailing list and receive the latest market news and insights delivered directly to your inbox.


Latest articles

FX Market Awaits Macro Data: EUR/USD and GBP/USD Near Range Boundaries
European currencies are trading without a clear direction against the US dollar, remaining in a consolidation phase following the earlier decline driven by USD strength. At the start of the week, both EUR/USD and GBP/USD attempted a recovery,

Market Analysis: AUD/USD, NZD/USD Struggle at Resistance, Upside Risks Diminish
AUD/USD is attempting a recovery wave from 0.6910. NZD/USD is also correcting losses and might recover if there is a clear move above 0.5885.
Important Takeaways for AUD/USD and NZD/USD Analysis Today
· The Aussie

Tesla (TSLA) Shares Surge Following Musk’s Announcements
According to the chart, Tesla (TSLA) shares had been under significant pressure since the start of 2026: from their December high, they had lost around 25% of their value. The main bearish drivers included:
→ Intense competition from Chinese automakers, particularly