


Market Analysis: Gold Drops to 3-Month Low
FXOpen

Yesterday, a forum of heads of central banks was held, organized by the ECB, with speeches by Lagarde, Powell, Ueda, Bailey. In general (with the exception of Japan), according to bankers, they intend to maintain a tight monetary policy, not excluding new increases in interest rates, and plan that inflation will continue to decline.
Against the background of this information, the price of gold in dollars fell — perhaps because forecasts for lower inflation, according to market participants, reduce the value of gold as a "rescue" asset.
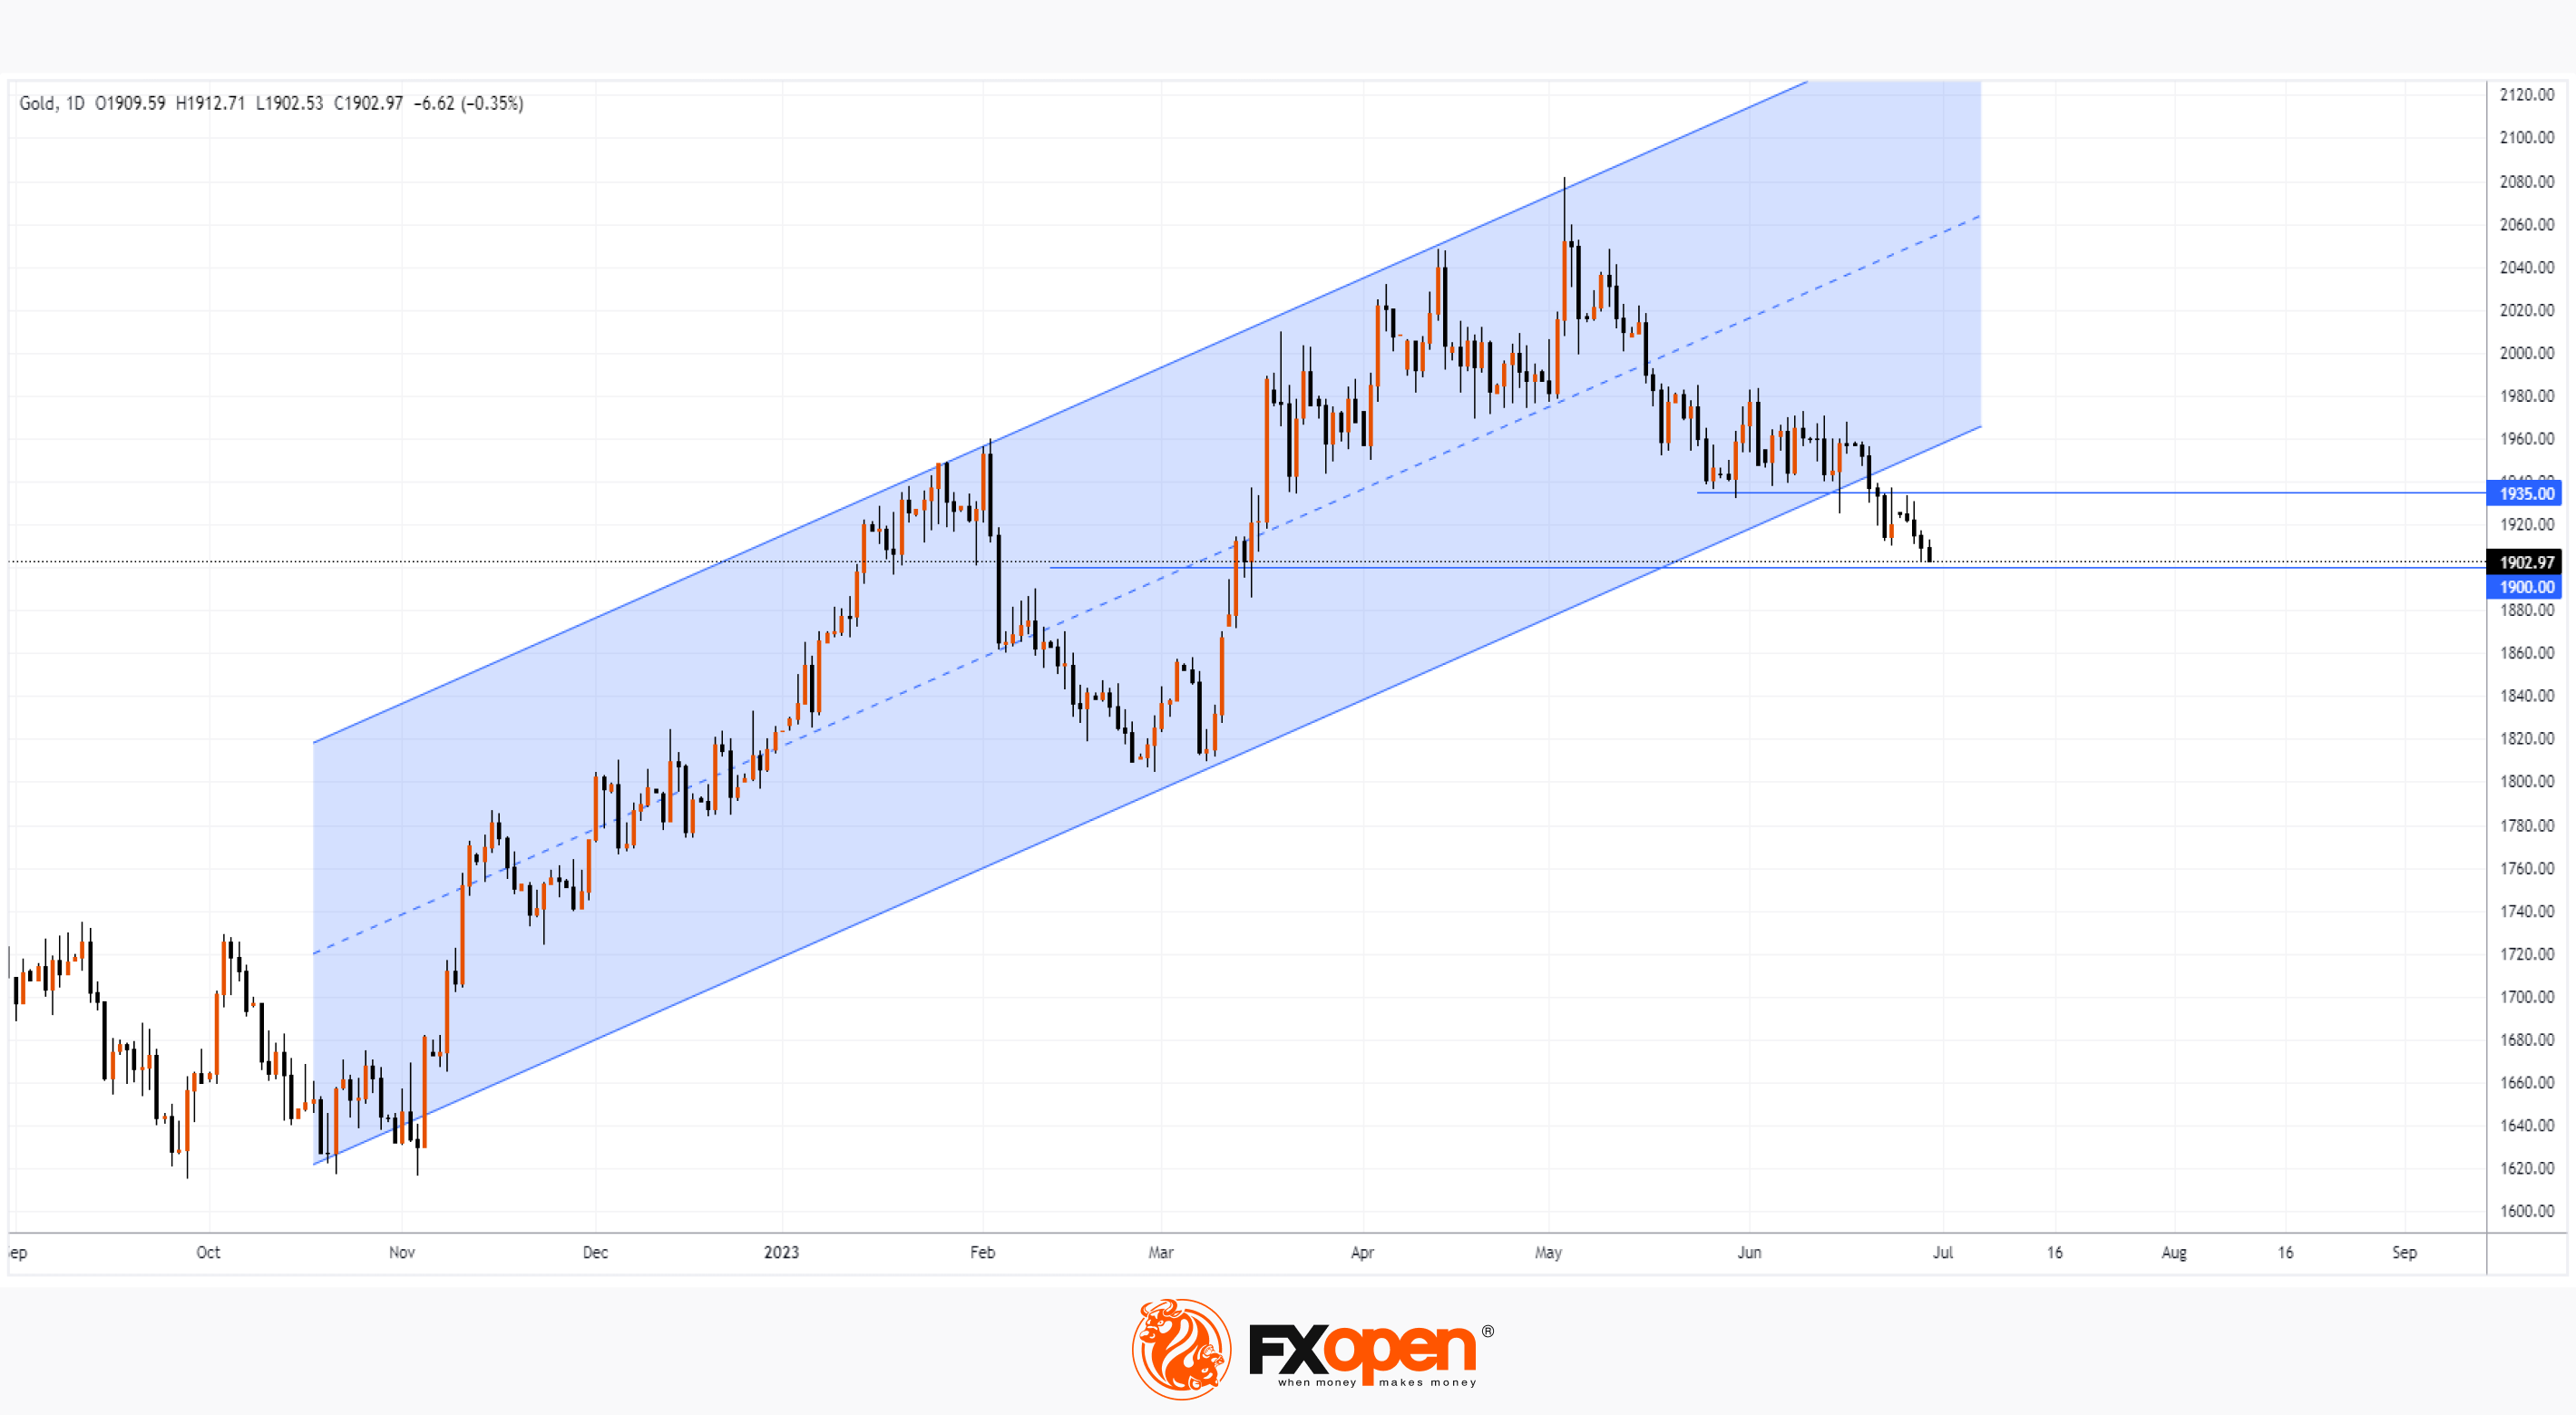
The XAU/USD price chart shows that it has made a bearish breakout of the ascending channel that has been in place since last fall and is approaching the psychological level of USD 1,900 per ounce. A rebound can be expected from this level — for example, to the resistance of 1,935 USD per ounce, which was still a pronounced support in early May.
Start trading commodity CFDs with tight spreads (additional fees may apply). Open your trading account now or learn more about trading commodity CFDs with FXOpen.
This article represents the opinion of the Companies operating under the FXOpen brand only. It is not to be construed as an offer, solicitation, or recommendation with respect to products and services provided by the Companies operating under the FXOpen brand, nor is it to be considered financial advice.
Stay ahead of the market!
Subscribe now to our mailing list and receive the latest market news and insights delivered directly to your inbox.


Latest articles

Weekly Market Insights with Gary Thomson: The Week of Central Banks and Earnings
In this video, we’ll explore the key economic events and market trends, shaping the financial landscape. Get ready for insights into financial markets to help you navigate the week ahead. Let’s dive in!
In this episode of Market

Intel at a Crossroads: Earnings Beat Meets Technical Resistance
Intel has just delivered its strongest quarter in over fifteen years, and the market reaction says it all. Q2 2026 revenue surged 25% year-over-year to $16.1 billion, crushing the consensus estimate of $14.42 billion, while adjusted EPS of

Tesla: Complex Range Structure Breaks Down Following Quarterly Earnings
Tesla released its Q2 2026 results after the market closed on 22 July. Revenue increased 26% year-on-year to $28.24 billion, while vehicle deliveries reached a record 480,126 units. However, operating margin fell sharply to 1.4%, down from