


Market Analysis: Price of Oil in Tense Anticipation
FXOpen

Monday's opening came without any surprises. Despite the news that the Israeli army is moving to a new phase of the operation in Gaza, the price of Brent oil did not change much, trading started around the middle of the Friday candle.
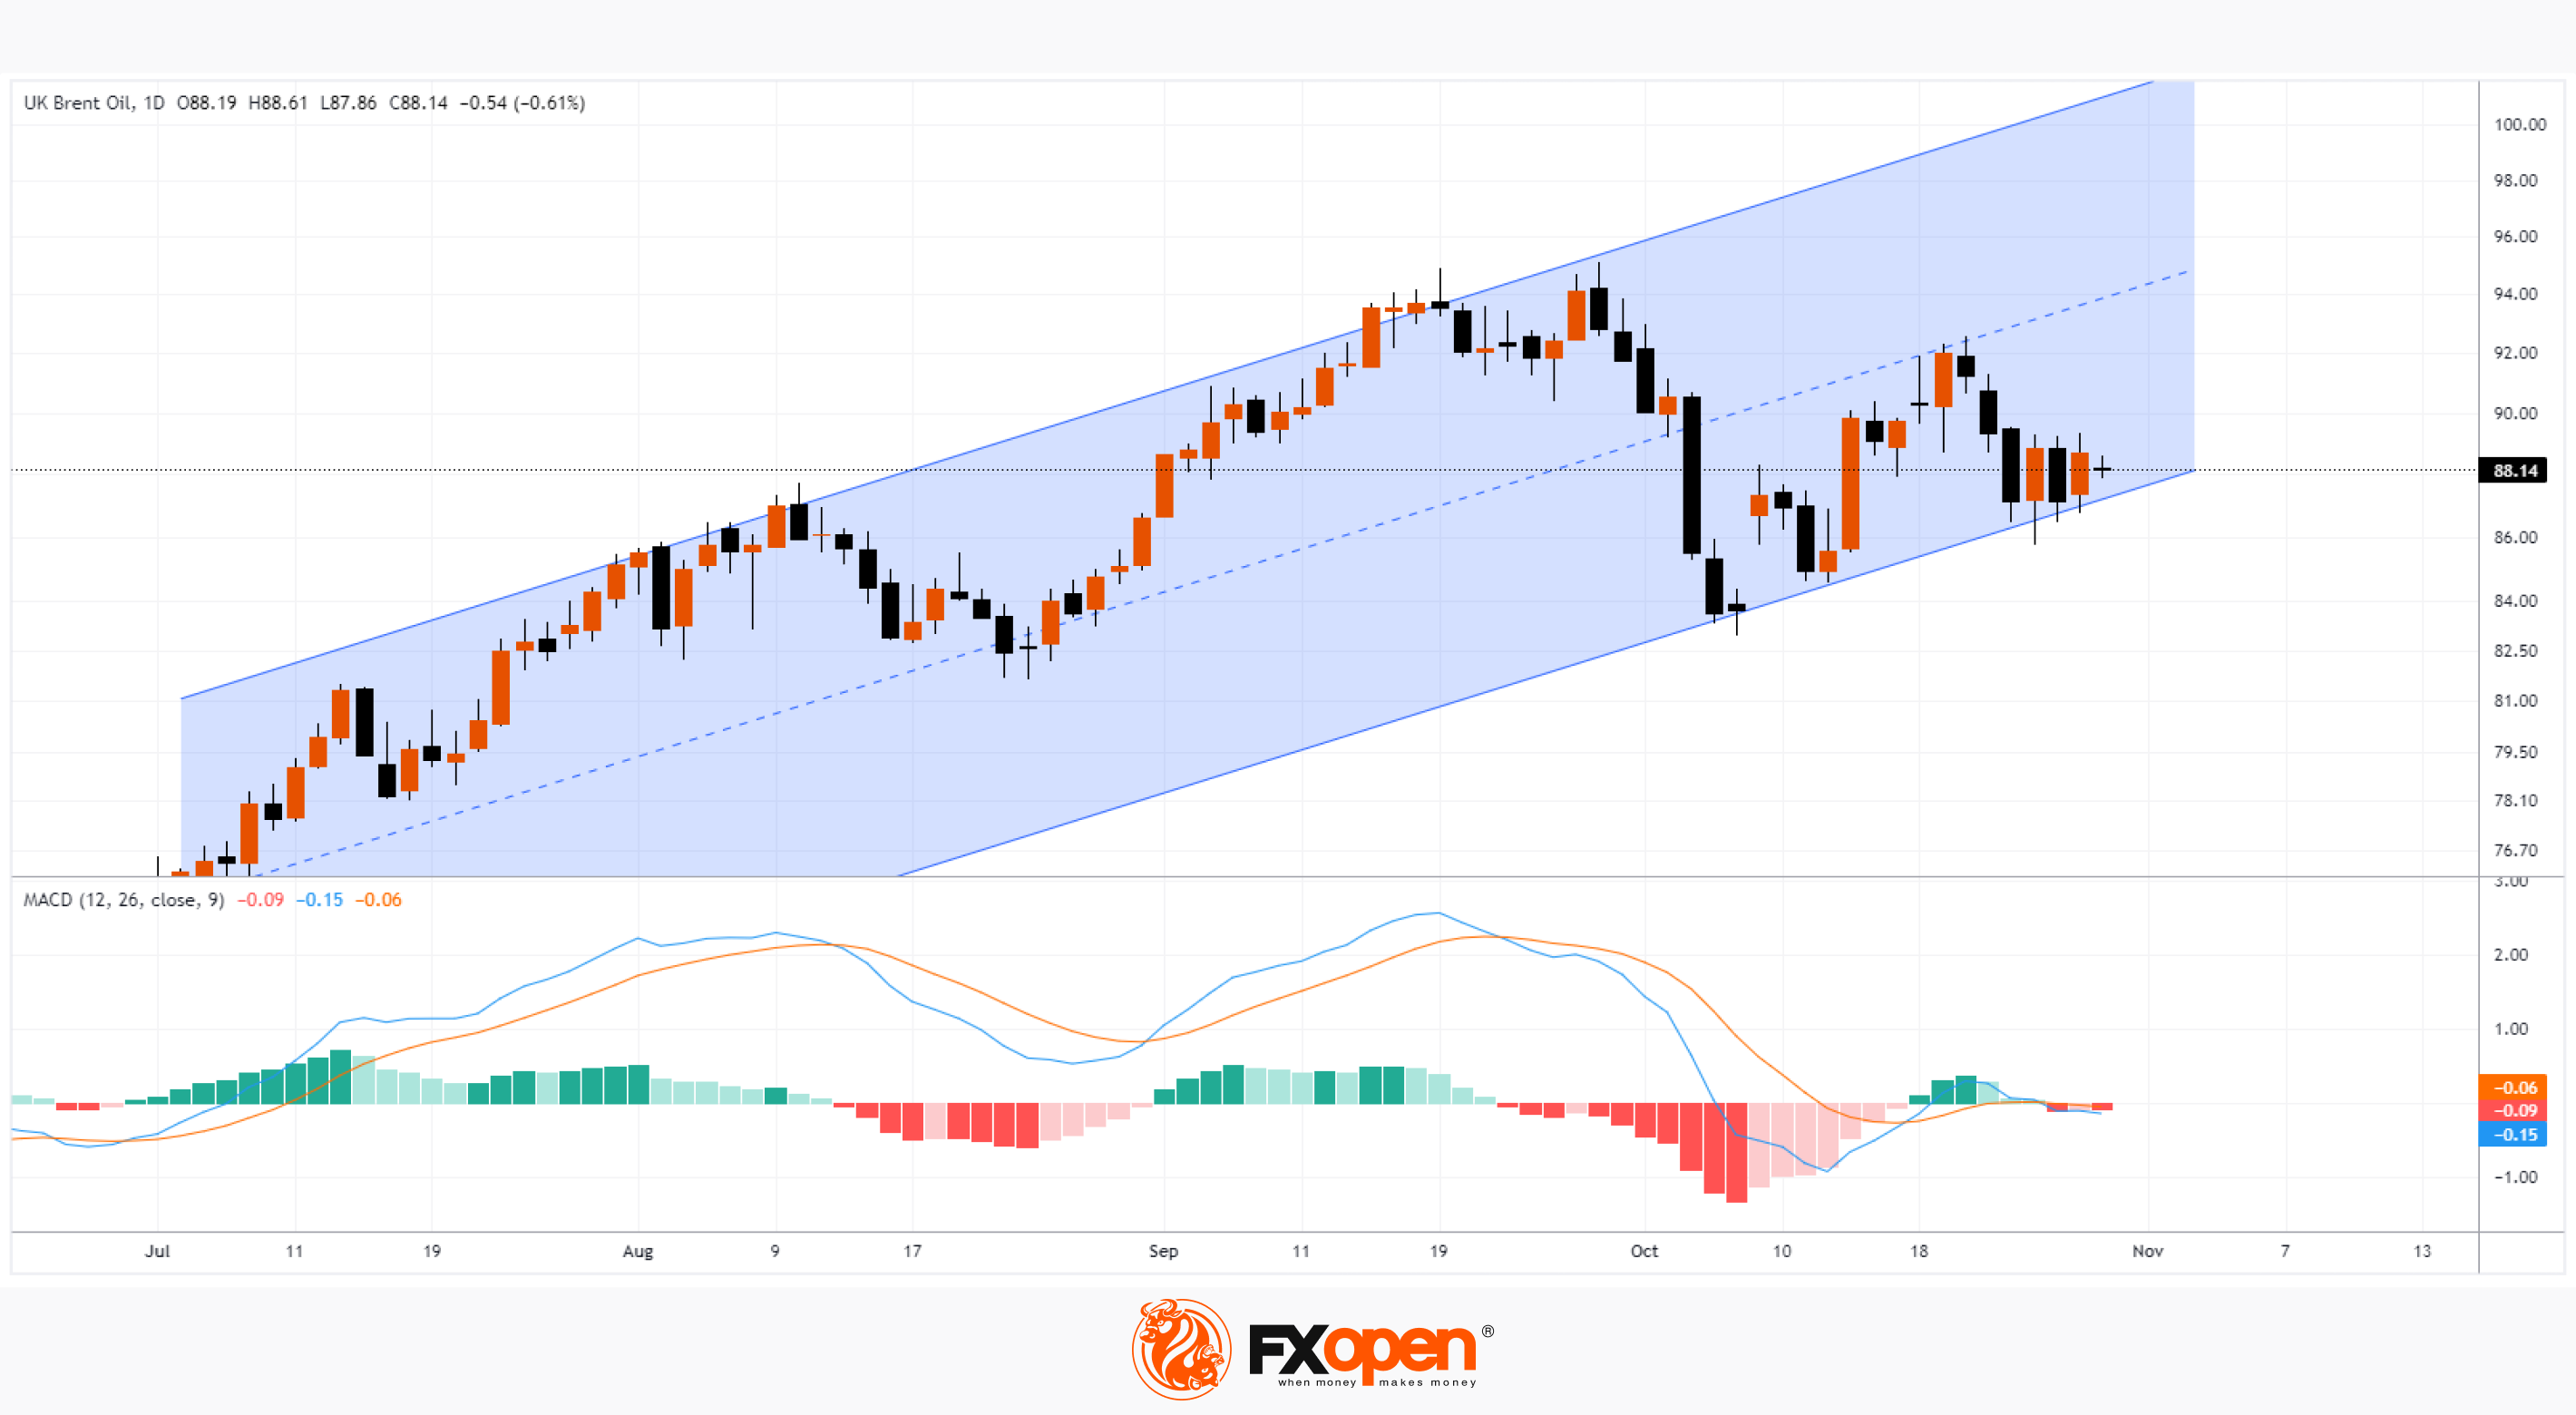
The chart shows that the price of Brent oil has fluctuated between USD 86.60 and USD 89.10 since October 24th. At the same time, the MACD indicator shrank near the zero line, which is typical for flat markets. However, it can hardly be said that bidders are calm.
On the one hand, they are closely monitoring news from the Middle East, where escalation could provoke supply disruptions and sharply increase the price of oil. On Sunday, US national security adviser Jake Sullivan said the US sees an increased risk of the conflict spreading to other parts of the Middle East region.
On the other hand, the Federal Reserve is expected to make a decision on interest rates this week. The event is scheduled for Wednesday evening, and it can greatly change the current balance of supply and demand.
The basis of the plan for the week can be the expectation of an impulse with the price leaving the specified range (similar to the inside bar strategy), which can develop into a new significant trend.
In this case, if the price goes out of the range:
→ in the upward direction will mean an attack by the bulls on the psychological level of USD 90;
→ in a downward direction will mean an attempt to break through an important ascending channel (shown in blue);
→ since the level of emotional stress is high, it can be assumed that the market is especially vulnerable to false movements.
Start trading commodity CFDs with tight spreads (additional fees may apply). Open your trading account now or learn more about trading commodity CFDs with FXOpen.
This article represents the opinion of the Companies operating under the FXOpen brand only. It is not to be construed as an offer, solicitation, or recommendation with respect to products and services provided by the Companies operating under the FXOpen brand, nor is it to be considered financial advice.
Stay ahead of the market!
Subscribe now to our mailing list and receive the latest market news and insights delivered directly to your inbox.


Latest articles

Ethereum: Has the Recovery Begun?
Ethereum has staged a notable rebound after once again testing the heavily watched psychological zone around 1500$. Since bouncing off this support, ETH/USD has climbed roughly 13%, now trading around the $1,700 mark.
This recovery is being driven

Oil Prices Are Back at Pre-Conflict Levels. Analysts Are Divided
At the start of May, oil markets were still pricing in elevated geopolitical risk and expectations of sustained supply disruption.
But easing tensions between Washington and Tehran, along with improving supply expectations, have rapidly shifted sentiment back toward fundamentals.
📉 Brent

The Dollar Awaits the Week’s Key Report: AUD/USD and NZD/USD at Crucial Technical Levels
Following mixed performance by the US dollar earlier this week, investors are now fully focused on the June Nonfarm Payrolls report, which will be released on Thursday rather than Friday. The schedule has been brought forward as US financial markets