


Market Analysis: The Price of Gold Rises More Than 5% Since Last Friday
FXOpen

The rise in the price of the (considered a safe haven) asset was driven by:
→ escalation of geopolitical conflicts;
→ increasing US government debt and rising bond prices make gold a more attractive option for a defensive portfolio.
Also, according to Business Insider, global central banks are buying gold in an effort to diversify reserves away from the dollar.
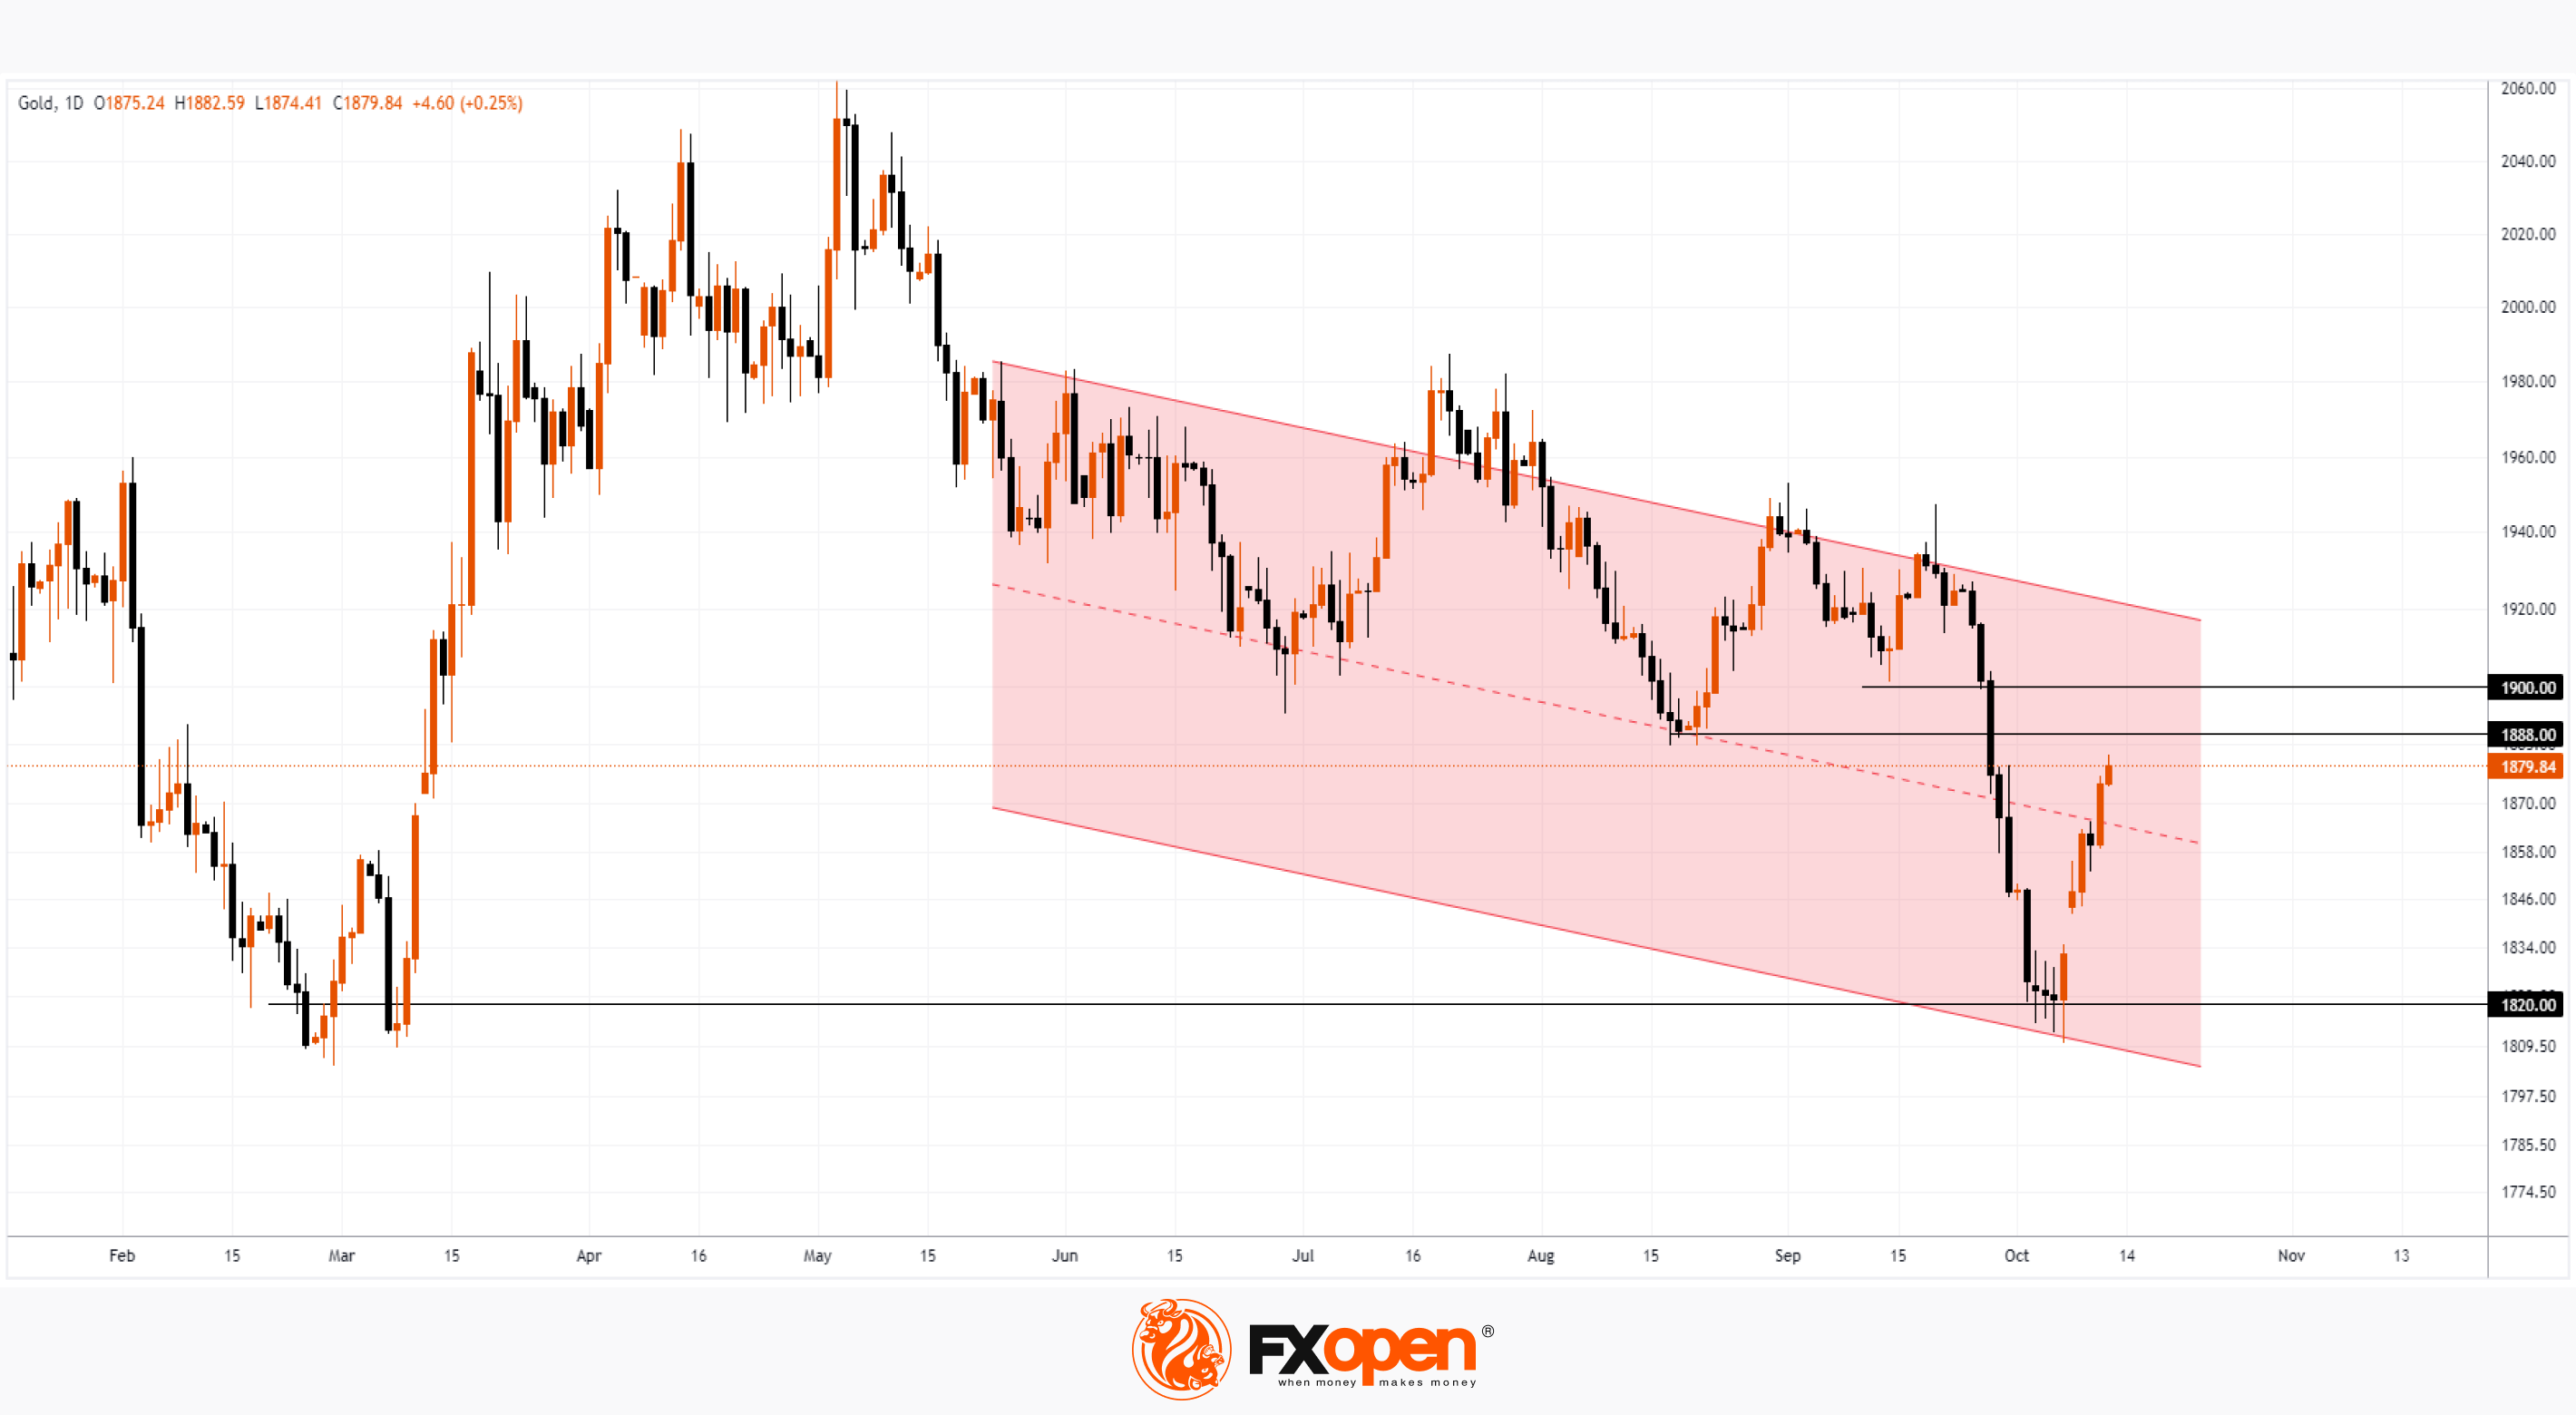
Thanks to the bullish momentum, the price of XAU/USD has risen into the upper half of the downward channel that has been in effect in the market since late spring. If the bulls are able to reach its upper limit in a relatively short amount of time, this will be a prerequisite to consider that the channel is losing its relevance.
From a technical point of view, the price increase was facilitated by:
→ lower border of the channel;
→ level 1,820, where the bulls had control in March and confirmed it in October.
Can the rally continue? This will be prevented by:
→ desires of buyers to secure profits from a sharp impulse;
→ level 1,888 (former support);
→ psychological level 1,900 (for the same reason).
→ at current levels a sharp decline was recorded on September 27, so the imbalance in favor of offers may persist here.
Start trading commodity CFDs with tight spreads (additional fees may apply). Open your trading account now or learn more about trading commodity CFDs with FXOpen.
This article represents the opinion of the Companies operating under the FXOpen brand only. It is not to be construed as an offer, solicitation, or recommendation with respect to products and services provided by the Companies operating under the FXOpen brand, nor is it to be considered financial advice.
Stay ahead of the market!
Subscribe now to our mailing list and receive the latest market news and insights delivered directly to your inbox.


Latest articles

Dow Jones (DJIA): Consolidation Beyond the Trend
Federal Reserve Chair Kevin Warsh testified before Congress on 14–15 July, reaffirming the Fed's commitment to bringing inflation back to target while providing no clear guidance on the future path of interest rates. Meanwhile, June inflation data came in

European Currencies Strengthen Ahead of Key Macroeconomic Releases
EUR/USD and GBP/USD continue to recover moderately following the recent weakening of the US dollar. European currencies have been supported by expectations that US inflationary pressures will continue to ease after softer-than-expected CPI and PPI data, reinforcing market

Brent Crude Oil: From Ceasefire to Crossfire — What's Next?
Just weeks ago, traders were pricing in peace. Now they're pricing in war again—and that reversal says everything about how fragile the current Middle East calm really is.
Brent crude has surged to $86 a barrel, its highest level