


XAG/USD Analysis: Silver Price Quickly Drops by Approximately 7.5%
FXOpen

On Friday, silver was trading at USD 23.5 per ounce, but on Monday morning it dropped below USD 21.7 – a difference of 7.5%.
Fundamental influencing factors are not clearly identified, but it can be assumed that the sharp drop was facilitated by:
→ the fact that a shutdown of US government agencies was avoided, since the authorities reached a budget agreement – albeit a temporary one;
→ high yield on bonds;
→ at the end of the Q3, the long-term portfolios of large market participants were rebalanced.
Factors could put pressure on gold (it also shows a negative trend, falling below USD 1,850 per ounce for the first time since March of this year), and more volatile silver rushed after gold.
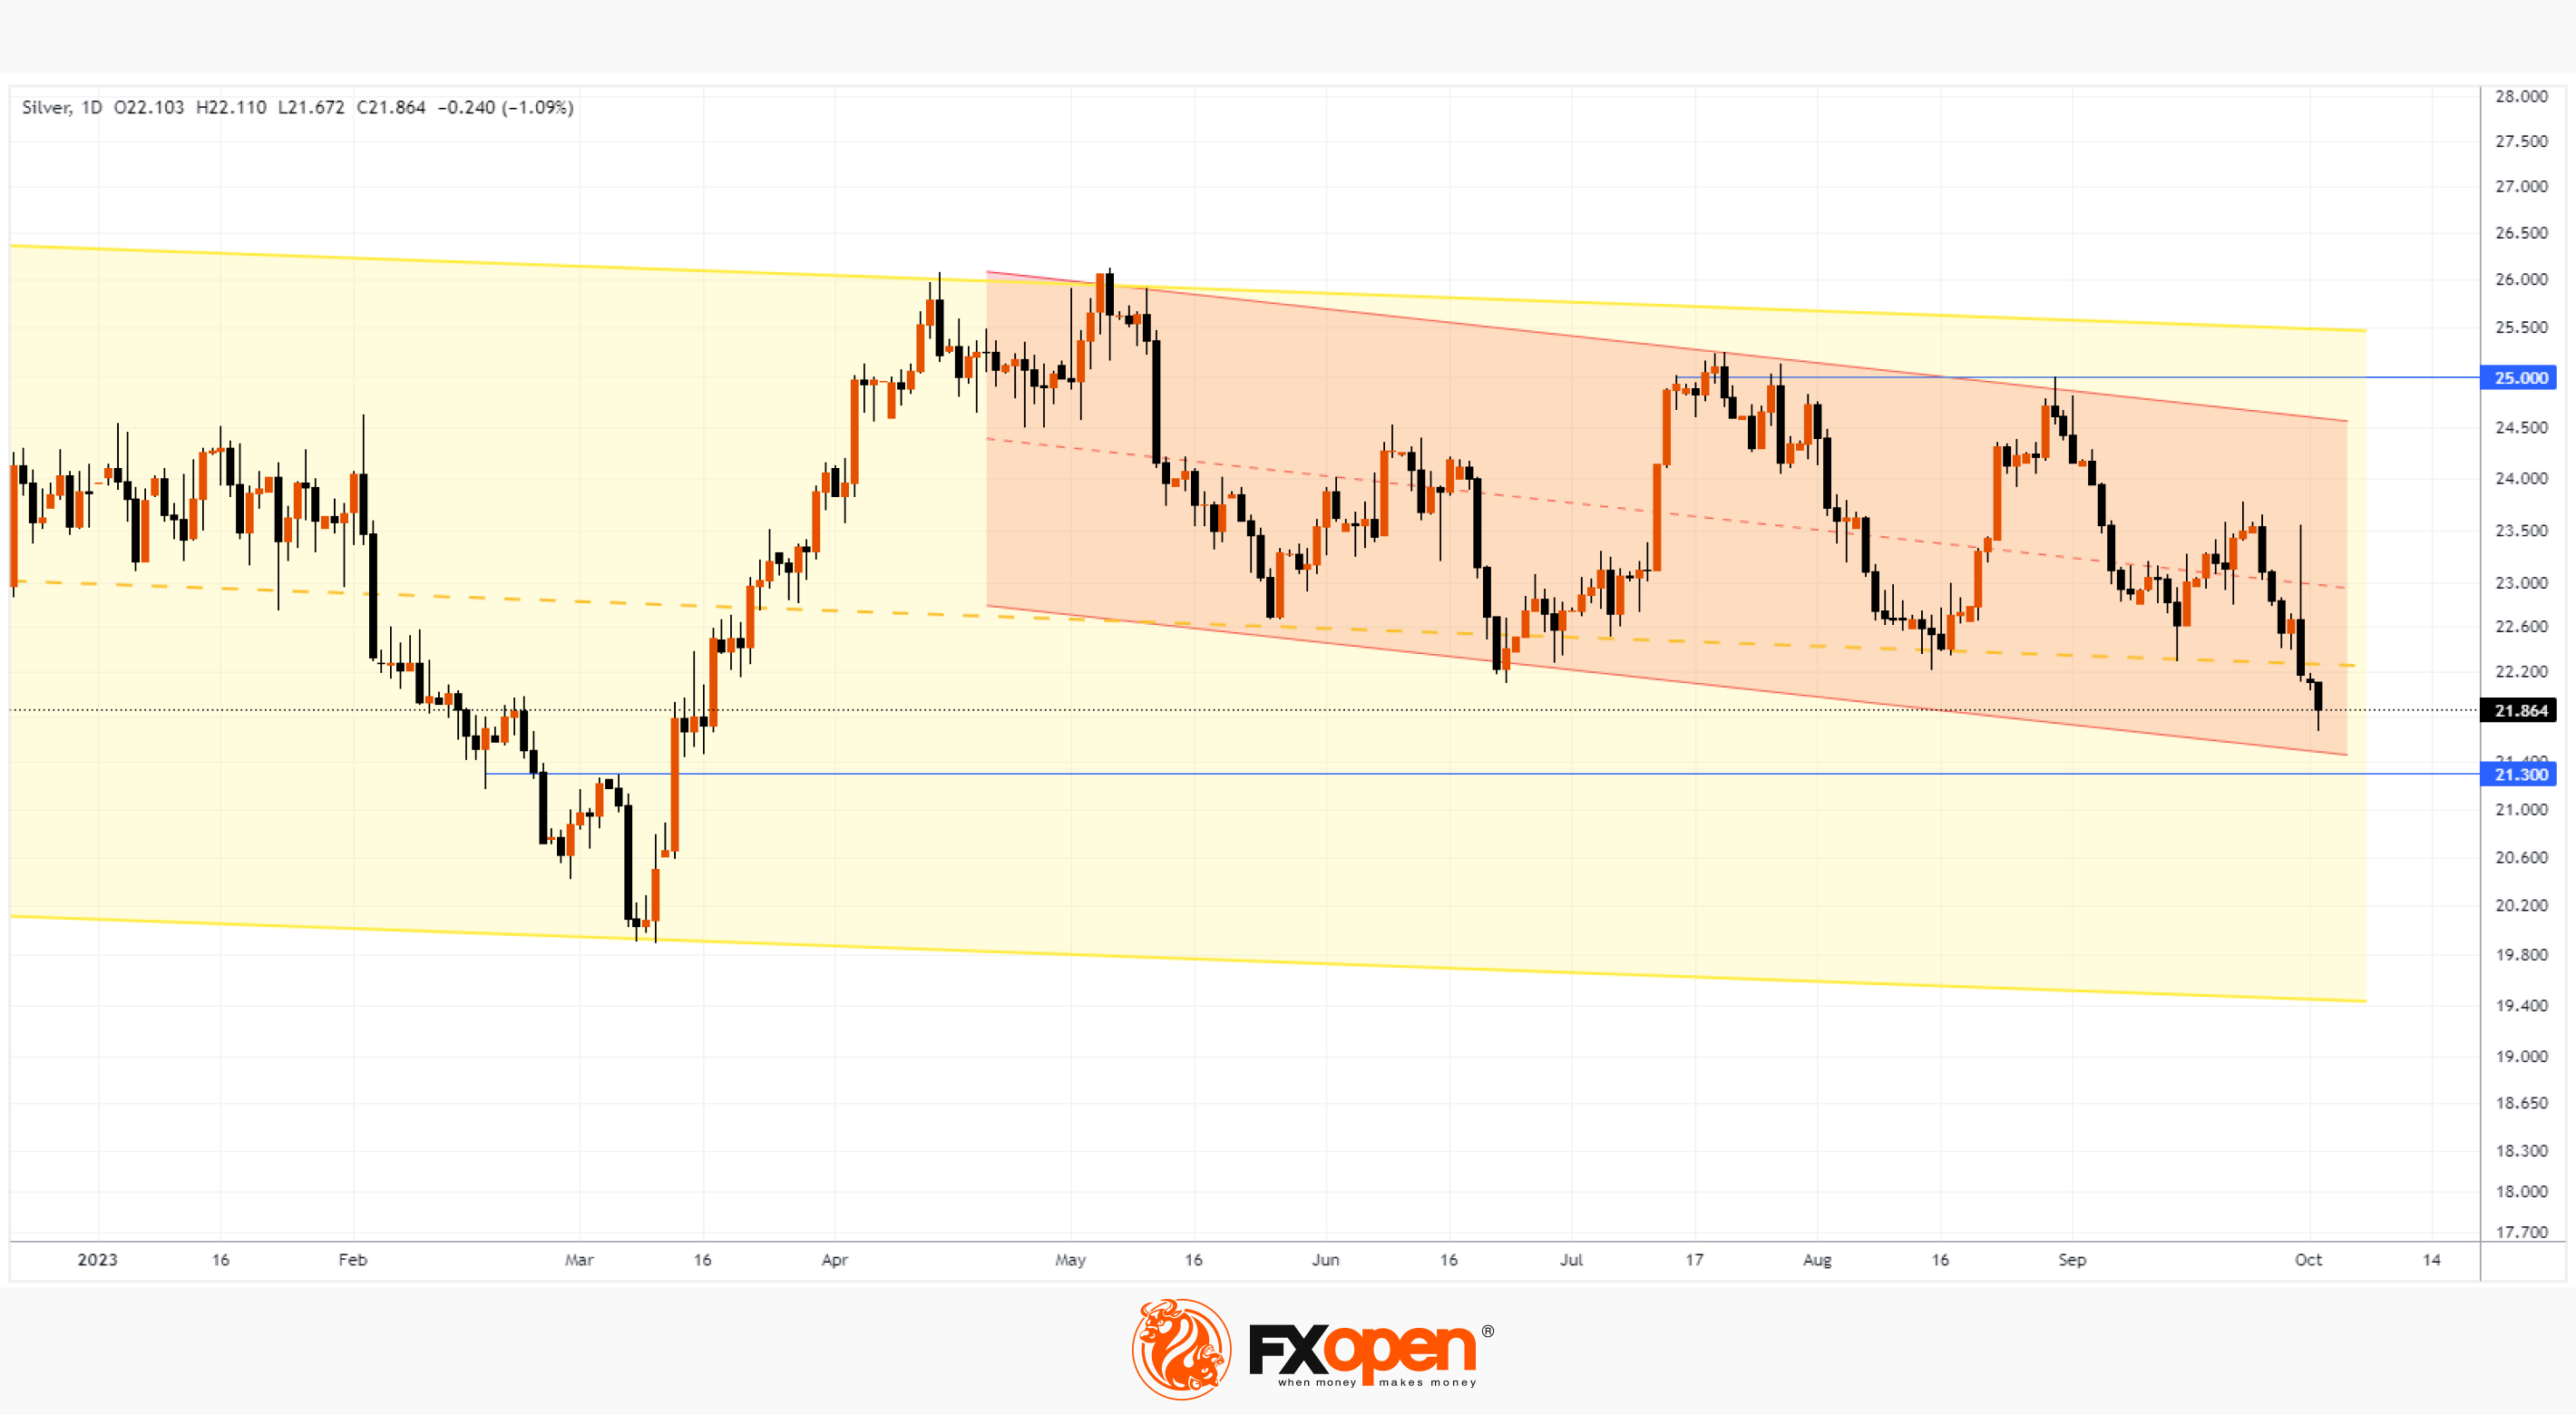
Technical analysis adds more information about the nature of the fall. In mid-July, we wrote that the price of gold had approached the upper limit of the long-term downward channel (shown in yellow), from which resistance could be expected.
However, the strength of demand was exhausted earlier, around the level of USD 25 per ounce, it turned out to be an unbearable barrier for the bulls, which is noticeable in the price action in July and August.
But what next?
Bearish arguments:
→ a long upper shadow on the Friday candle indicates strong selling pressure;
→ the price has dropped below the median line of the long-term yellow channel – now it can act as resistance (after serving as support in September);
→ resistance may also come from the median line of the red channel, where the psychological level of USD 23 per ounce also passes.
Bullish arguments:
→ the psychological level of USD 21 can provide support;
→ also in this area there is the lower border of the red channel;
→ after a sharp drop, the market looks oversold, and if sellers want to take profits, this should bring positivity to the price action.
The level of 21.30, which dates back to March, also looks strong. The emergence of fundamental factors could add more weight to it.
Start trading commodity CFDs with tight spreads (additional fees may apply). Open your trading account now or learn more about trading commodity CFDs with FXOpen.
This article represents the opinion of the Companies operating under the FXOpen brand only. It is not to be construed as an offer, solicitation, or recommendation with respect to products and services provided by the Companies operating under the FXOpen brand, nor is it to be considered financial advice.
Stay ahead of the market!
Subscribe now to our mailing list and receive the latest market news and insights delivered directly to your inbox.


Latest articles

Weekly Market Insights with Gary Thomson: The Week of Central Banks and Earnings
In this video, we’ll explore the key economic events and market trends, shaping the financial landscape. Get ready for insights into financial markets to help you navigate the week ahead. Let’s dive in!
In this episode of Market

Intel at a Crossroads: Earnings Beat Meets Technical Resistance
Intel has just delivered its strongest quarter in over fifteen years, and the market reaction says it all. Q2 2026 revenue surged 25% year-over-year to $16.1 billion, crushing the consensus estimate of $14.42 billion, while adjusted EPS of

Tesla: Complex Range Structure Breaks Down Following Quarterly Earnings
Tesla released its Q2 2026 results after the market closed on 22 July. Revenue increased 26% year-on-year to $28.24 billion, while vehicle deliveries reached a record 480,126 units. However, operating margin fell sharply to 1.4%, down from