


XAGUSD Analysis: Silver Price Up Over 7% in 2 Days
FXOpen

On Friday morning the price of silver was USD 24.8. The sharp rise was triggered by the weakening of the dollar on Wednesday, which was influenced by inflation data in the US.
When looking for reasons why silver is stronger than other commodity markets (for example, gold has risen in price by no more than 1.5% over the same period), you may not find satisfying explanations, but pay attention to information on twitter by Robert Kiyosaki (author of the books in the Rich Dad series). In his opinion, on August 22 in South Africa, at the BRICS forum, the creation of a currency backed by gold will be announced. Therefore, Robert predicts problems for the US dollar and suggests considering buying gold, silver, and bitcoin.
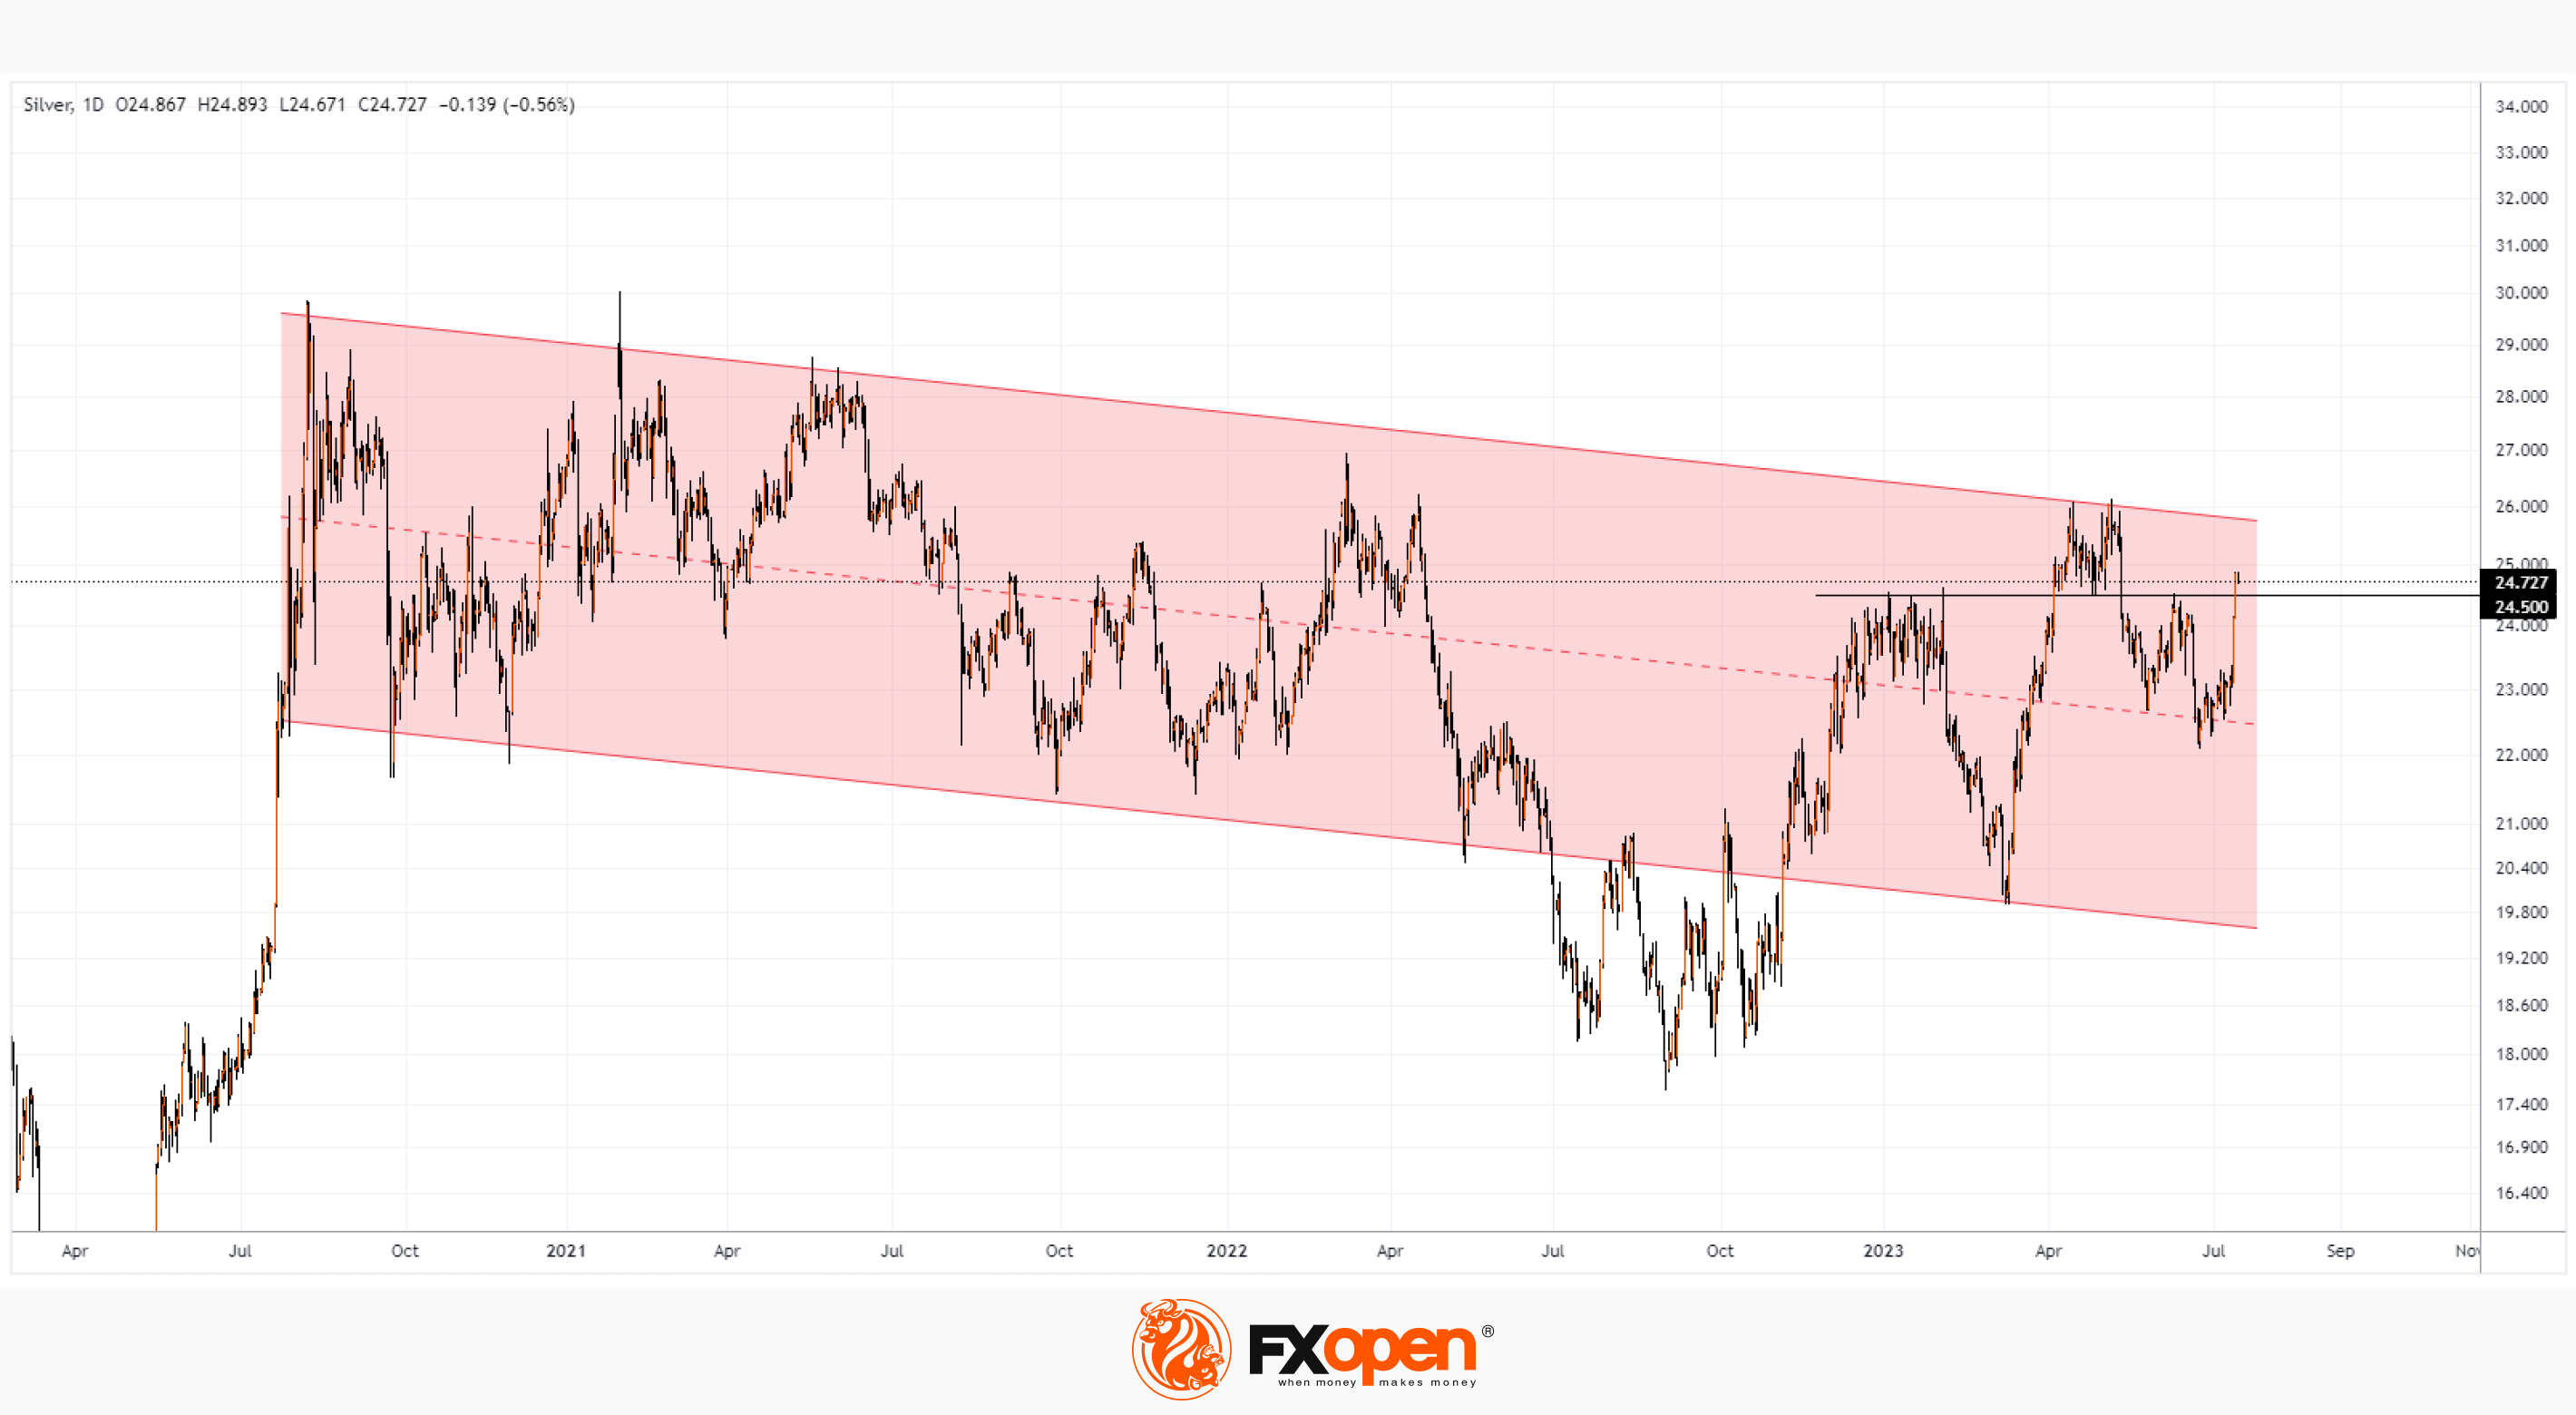
In the meantime, the XAG/USD chart shows that the price of silver has approached the upper boundary of the long-term descending channel (shown in red). If the bulls try to reach the upper border of the channel, then perhaps before that we will see a test of the level of 24.5, which previously served as both support and resistance.
Start trading commodity CFDs with tight spreads (additional fees may apply). Open your trading account now or learn more about trading commodity CFDs with FXOpen.
This article represents the opinion of the Companies operating under the FXOpen brand only. It is not to be construed as an offer, solicitation, or recommendation with respect to products and services provided by the Companies operating under the FXOpen brand, nor is it to be considered financial advice.
Stay ahead of the market!
Subscribe now to our mailing list and receive the latest market news and insights delivered directly to your inbox.


Latest articles

Weekly Market Insights with Gary Thomson: The Week of Central Banks and Earnings
In this video, we’ll explore the key economic events and market trends, shaping the financial landscape. Get ready for insights into financial markets to help you navigate the week ahead. Let’s dive in!
In this episode of Market

Intel at a Crossroads: Earnings Beat Meets Technical Resistance
Intel has just delivered its strongest quarter in over fifteen years, and the market reaction says it all. Q2 2026 revenue surged 25% year-over-year to $16.1 billion, crushing the consensus estimate of $14.42 billion, while adjusted EPS of

Tesla: Complex Range Structure Breaks Down Following Quarterly Earnings
Tesla released its Q2 2026 results after the market closed on 22 July. Revenue increased 26% year-on-year to $28.24 billion, while vehicle deliveries reached a record 480,126 units. However, operating margin fell sharply to 1.4%, down from