


XNGUSD: Natural Gas Price Hits 5-month High
FXOpen

The hostilities in Ukraine have drastically changed the world's natural gas transportation routes, and yesterday's information about possible interruptions in the supply of liquefied gas from Australia due to the planned strikes of workers led to the fact that the XNG/USD quote jumped above the psychological level of USD 3.0.
Citigroup analysts believe that gas prices in Europe could double by January if strikes in Australia, which is an important supplier of liquefied gas to Europe and Asia, drag on through the autumn.
And the FT writes that yesterday's growth was accelerated due to the fact that traders closed short positions, thereby increasing demand.
The XNG price chart shows that the extremes of summer are forming an ascending channel, and its upper limit has not yet been reached. The ability of the bulls to gain a foothold above the psychological level of USD 3.0 will indicate the strength of demand.
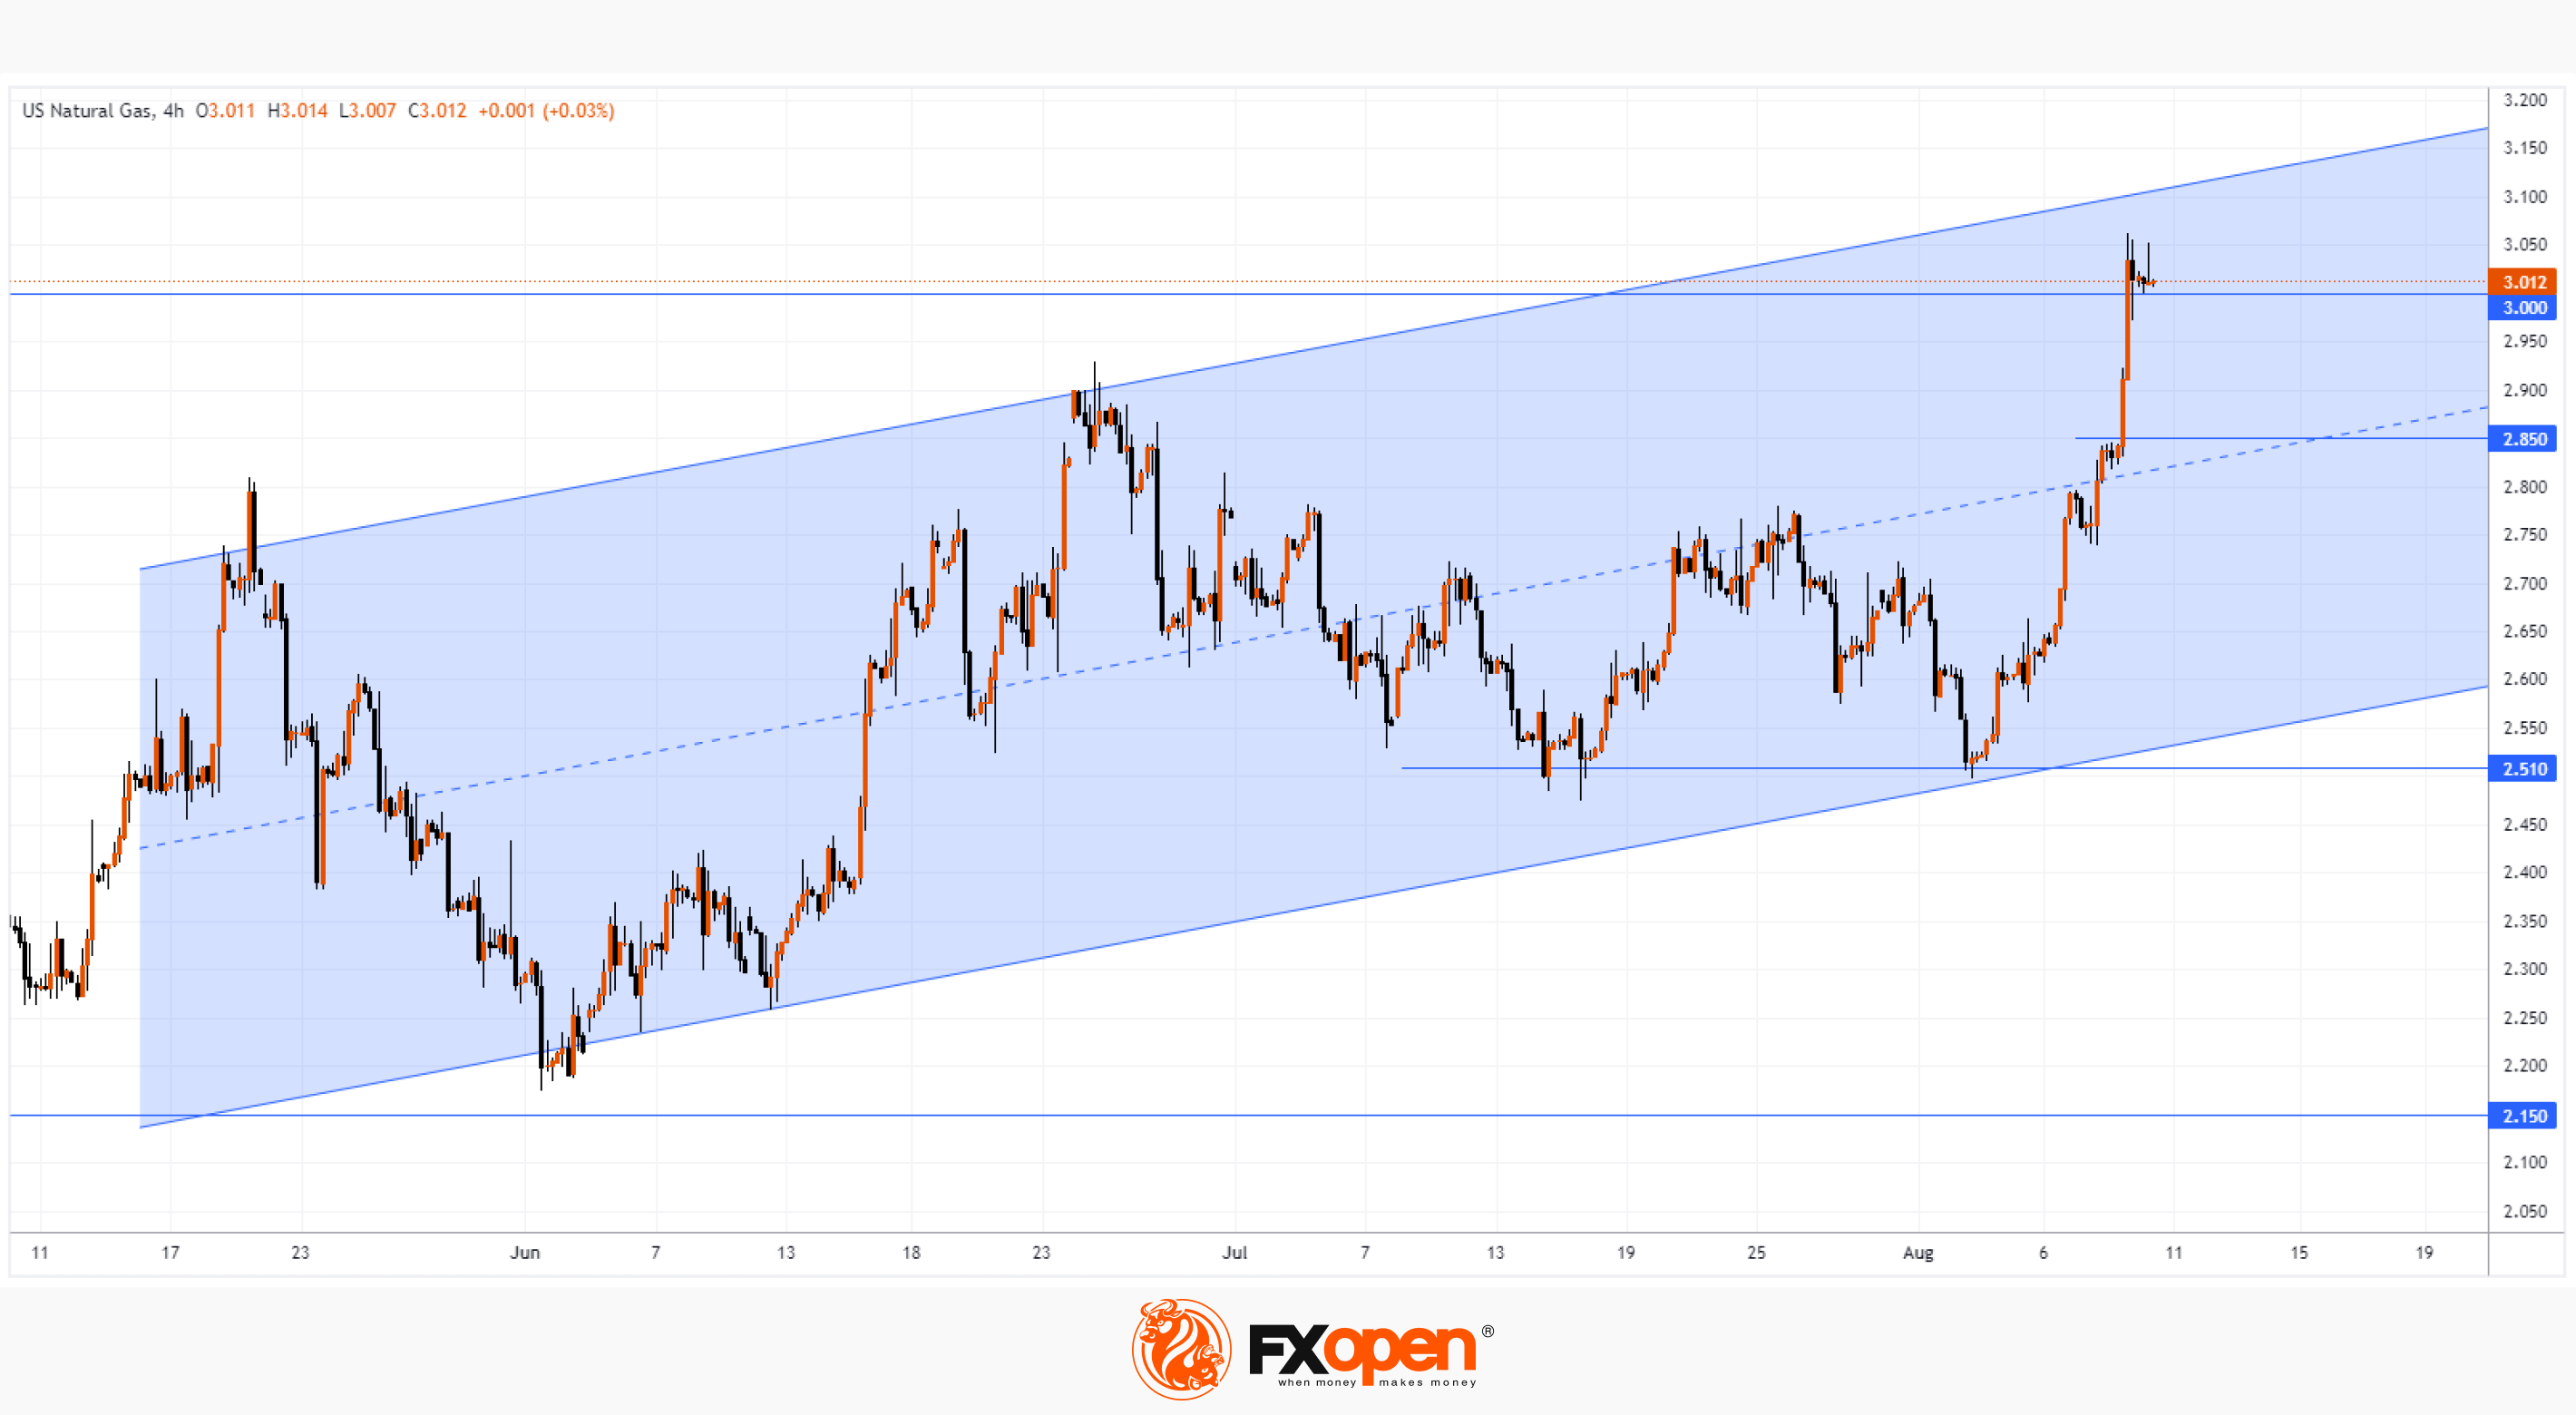
Important lines on the XNG/USD chart:
→ resistance from the upper border of the channel;
→ support from the median line of the channel;
→ support at USD 2.51;
→ support at USD 2.85 – yesterday this level near the June maximum acted as resistance, but was broken.
Market volatility is likely to continue today as news on US natural gas reserves is scheduled to be released at 17:30 GMT+3.
Start trading commodity CFDs with tight spreads (additional fees may apply). Open your trading account now or learn more about trading commodity CFDs with FXOpen.
This article represents the opinion of the Companies operating under the FXOpen brand only. It is not to be construed as an offer, solicitation, or recommendation with respect to products and services provided by the Companies operating under the FXOpen brand, nor is it to be considered financial advice.
Stay ahead of the market!
Subscribe now to our mailing list and receive the latest market news and insights delivered directly to your inbox.


Latest articles

AI Valuations Are Back in the Spotlight
Artificial intelligence remains the dominant investment theme of 2026, but investors are increasingly questioning whether AI stock valuations are keeping pace with reality.
💰 Big Tech continues to invest at an unprecedented scale, with hyperscaler AI spending projected to exceed $800

AUD/CAD: Months of Indecision — Is a Breakout Finally Coming?
The Australian dollar has clawed back most of its end-of-June losses, when it touched three-month lows against the greenback amid escalating Middle East tensions. Since then, sentiment has improved: the RBA's Assistant Governor Sarah Hunter signalled the board stands ready

USD/JPY: Battling at the Top of the Triangle
On 3 July, Japan's Finance Minister, Satsuki Katayama, stated that the Ministry of Finance remains in close contact with US authorities regarding developments in USD/JPY as the yen traded near its weakest level in almost 40 years. Similar verbal