


Renko Trading Strategies: How To Trade With Renko Charts
FXOpen

Renko charts stand out in the trading world for their unique ability to filter market noise and highlight significant price movements, offering a clearer view of market trends. This FXOpen article delves into the synergy between Renko charts and various trading indicators, unveiling four strategies designed to navigate the complexities of the financial markets.
Understanding Renko Charts
Renko charts, derived from the Japanese word 'renga' meaning 'brick', offer a distinctive approach to charting price movements in the financial markets. Unlike traditional candlestick charts that plot price changes over time, Renko charts focus solely on price movement, disregarding time and volume. This method is known for its simplicity and effectiveness in identifying market trends and reducing noise.
Renko charts consist of Renko bars (or bricks), where each bar represents a fixed price movement. Each new Renko bar is plotted at a 45-degree angle from the previous one to the right. The size of the movement, known as the "box size", is predetermined by the trader.
There are two primary methods for setting the box size: the standard method, where the box size is a set number of pips or points, and the Average True Range (ATR)-based Renko, which dynamically adjusts the box size based on the market's volatility. The ATR-based Renko allows for more flexibility, adapting to changing market conditions by altering the brick size to reflect the current average price movement.
We’ll use ATR-based Renko charts throughout this article, though you’ll find the strategies discussed can also be used for standard Renko charts.
Advantages of Using Renko Charts in Trading
Renko charts offer traders a streamlined and effective way to view price movements. Here are the key advantages of using Renko charts in trading:
- Trend Identification: Renko charts simplify the process of identifying market trends by filtering out minor fluctuations and focusing solely on significant price movements.
- Noise Reduction: By eliminating insignificant price changes, Renko charts help traders focus on relevant trends, reducing the likelihood of being misled by market "noise."
- Support and Resistance Clarity: The clear structure of Renko bars makes it easier to spot and analyse support and resistance levels, providing valuable insights for entry and exit decisions.
- Disciplined Trading: The fixed size of Renko bars enforces a consistent approach to market analysis, encouraging traders to focus on substantial price moves and avoid overreacting to minor market fluctuations.
Renko Trading Strategies
Now, let’s take a look at four Renko trading strategies. To gain a deeper insight into how the indicators discussed work, consider trading with FXOpen on the TradingView platform to experiment and see what settings best suit your trading style.
Renko With Bollinger Bands Strategy
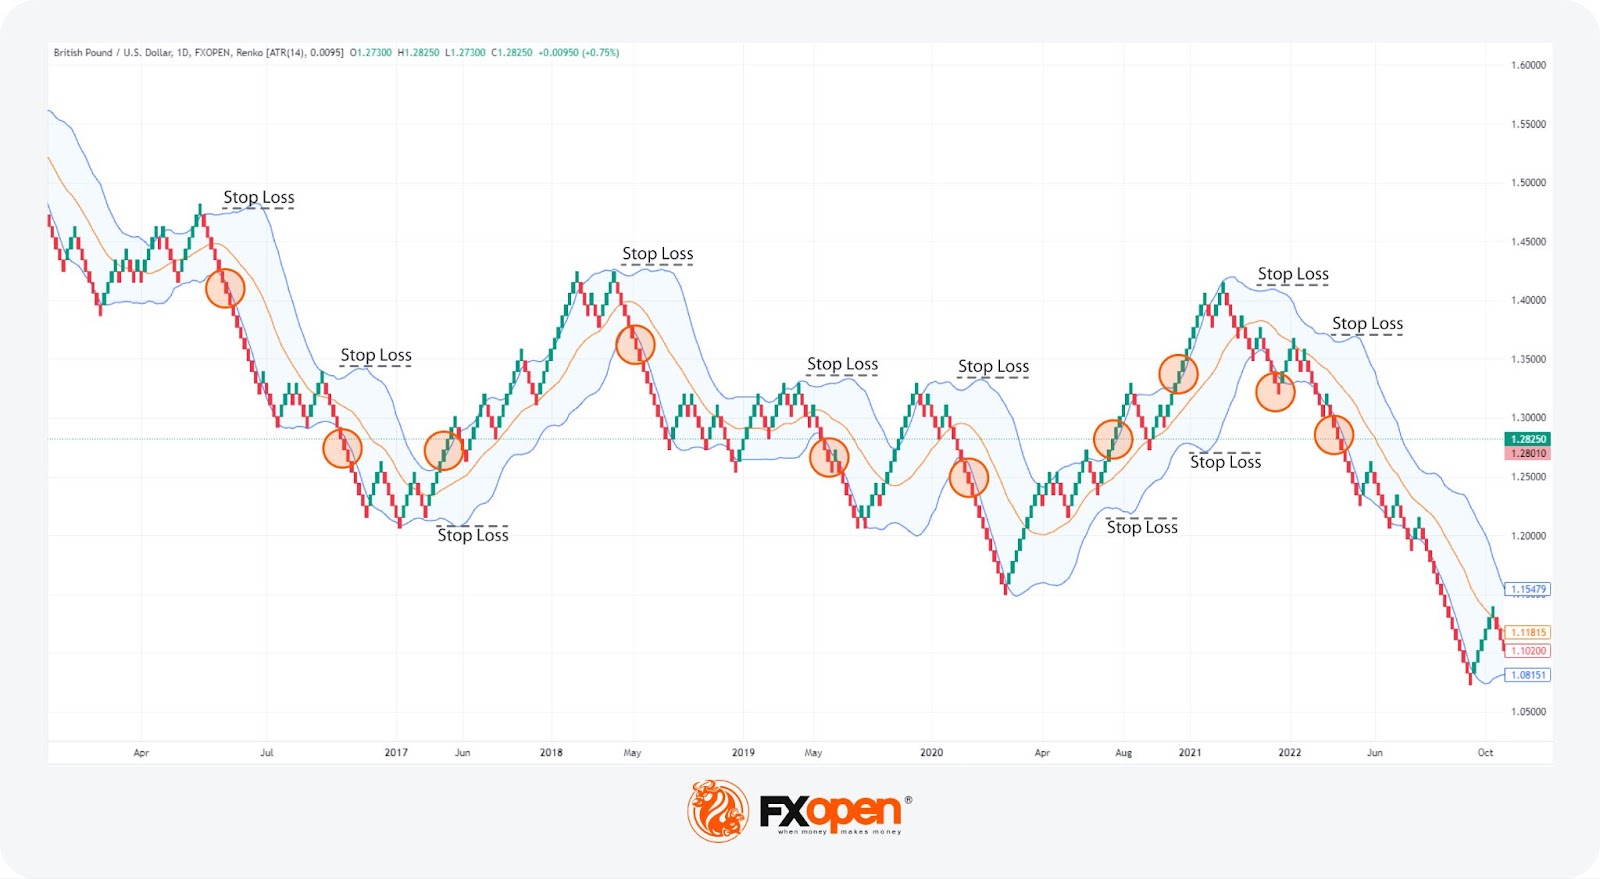
Combining Renko charts with Bollinger Bands presents a unique Renko trading strategy, especially effective in trending markets. This method allows traders to potentially capitalise on the clarity of Renko charts in identifying strong price trends that are likely to continue and the dynamic nature of Bollinger Bands to gauge market volatility. Traditionally set to 2 standard deviations, adjusting Bollinger Bands to 1.5 standard deviations in this strategy sharpens the focus on volatility shifts, offering potentially timely signals for traders.
Entry
- Traders often wait for the Bollinger Bands to widen, indicating increased volatility.
- The strategy typically calls for observing two (or three for a more conservative approach) consecutive Renko brick closes outside the Bollinger Bands.
Stop Loss
- A stop loss may be placed on the opposite side of the Bollinger Band from the entry point or the Bands’ midpoint.
- For a much tighter entry, some traders might put a stop loss above or below the first brick to close outside of the Bands.
Take Profit
- Traders might take profit after one or two bricks of the opposite colour appear, indicating a potential reversal.
- Some traders prefer to use another indicator to identify potential reversal points for taking profits.
- Alternatively, traders may forgo a set take-profit point and instead trail a stop loss on the other side of the band.
Renko and Parabolic SAR Trend Following Strategy
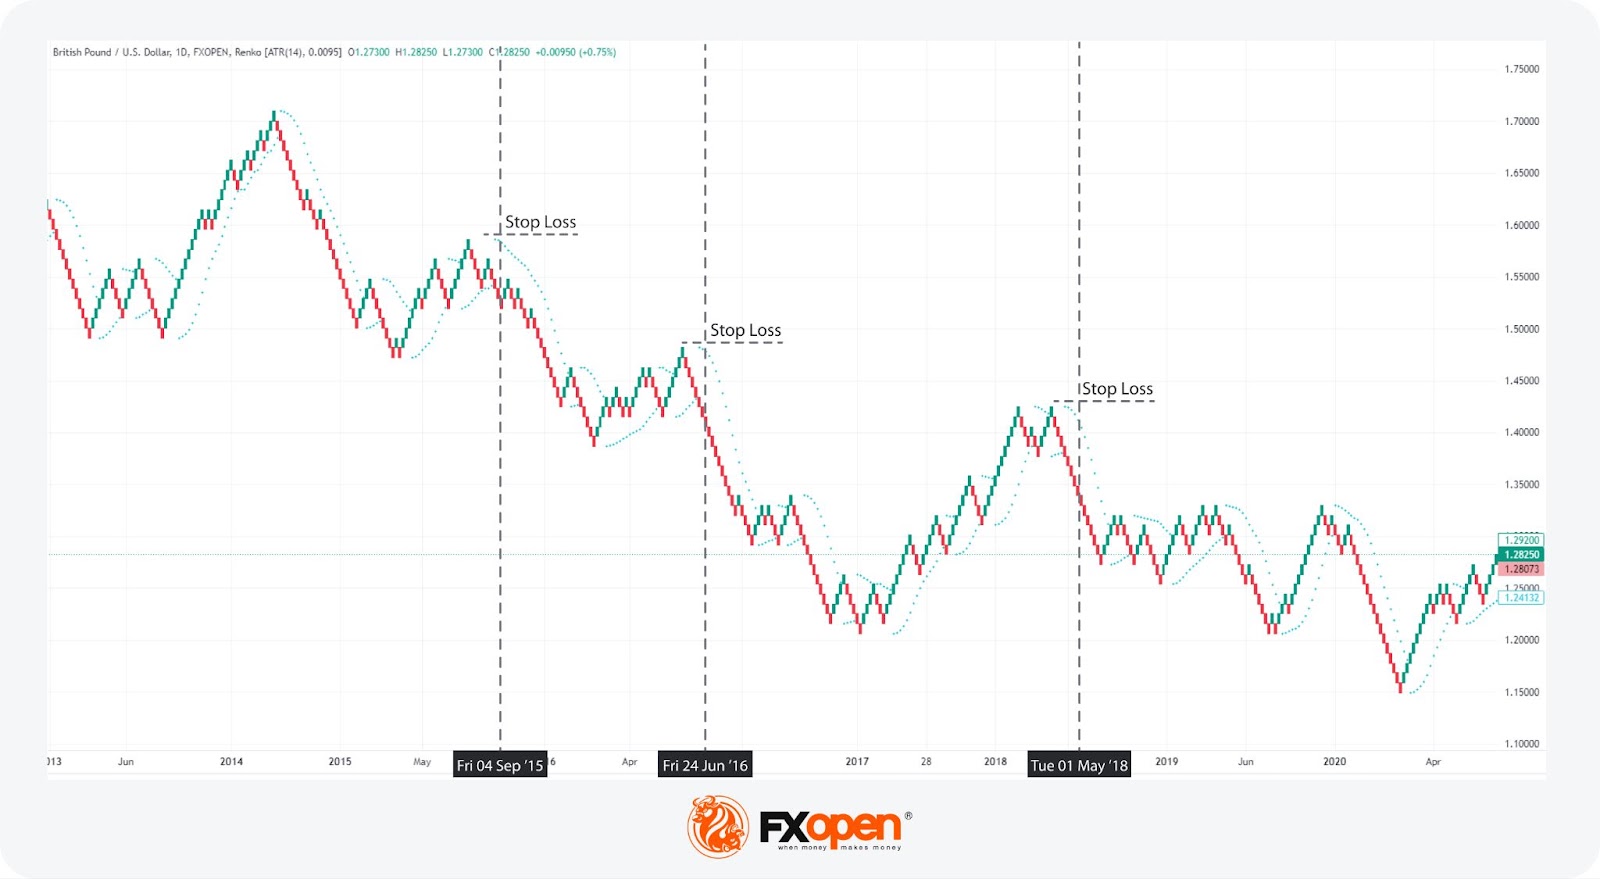
Using Renko charts in tandem with the Parabolic SAR indicator can form the foundation of a strong trend-following strategy that thrives on the principle of timing entries during pullbacks in an established trend. This method harnesses the simplicity and effectiveness of Renko charts to filter out minor price movements and employs the Parabolic SAR to pinpoint potential trend continuations after pullbacks.
Entry
- Traders typically wait for the Parabolic SAR to indicate a new trend direction during a relatively deep pullback, usually to a prior area of support or resistance. They observe at least two dots appearing below the Renko bricks for bullish signals and above for bearish signals.
- Confirmation of two consecutive Renko bricks in the direction of the trend is often awaited before making an entry, potentially verifying the continuation of the broader trend.
Stop Loss
- Stop losses may be strategically placed at the swing high or low of the current trend, offering a potential safeguard against significant reversals.
- Another common approach traders use is to set the stop loss above or below the first signal brick, providing tighter control of potential losses but with increased risk.
Take Profit
- Profits may be considered when an opposite signal is observed, such as the Parabolic SAR switching positions and two opposing bricks appearing, signalling a potential trend reversal.
- Utilising another indicator or analysis method to find a suitable exit point may also be a viable strategy for securing gains.
- Trailing a stop loss above/below swing points as the trend progresses could also be a way for traders to potentially maximise their returns using this strategy.
Renko RSI Bull/Bear Identification With Moving Average Confirmation
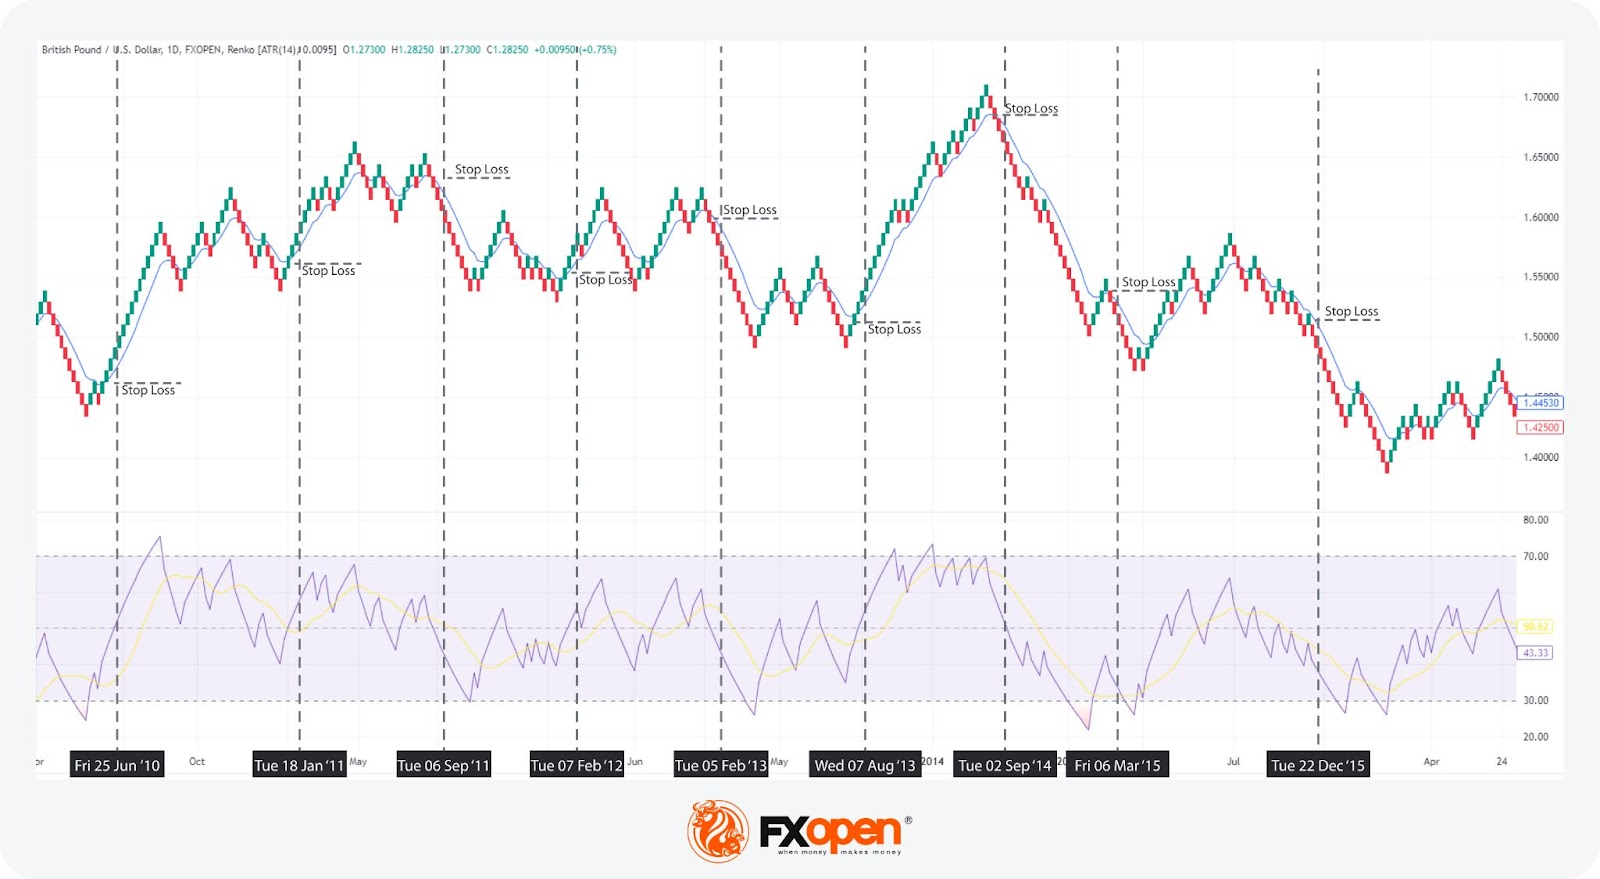
Combining Renko charts with the Relative Strength Index (RSI) and a Moving Average (MA) creates a nuanced approach to identifying bull or bear markets. This strategy utilises the RSI's midpoint of 50 as a primary indicator of market sentiment, with readings above 50 signalling bullish conditions and below 50 indicating bearish ones.
To refine entry signals, a short-term Exponential Moving Average (EMA), typically set to between 9-12 periods for responsiveness, acts as an additional filter. The ideal MA should swiftly reflect price movements. Hence a short-term MA is supposed to be the best, though traders are free to choose their preferred MA type.
Entry
- The strategy dictates entry when both the RSI is on the correct side of 50 (above for bullish, below for bearish) and Renko bricks are plotted on the corresponding side of the MA (above for long positions, below for short positions).
- An entry is considered after witnessing two or three consecutive bricks of the same colour that align with the indicated market direction.
- Entries are usually avoided if the MA is relatively flat, suggesting potential consolidation, and sought after when the MA slopes distinctly up or down.
Stop Loss
- Stop losses might be placed above or below a nearby swing point for more room or just above/below the moving average for a tighter stop.
Take Profit
- According to the theory, several methods are utilised by traders: waiting for the RSI to reach overbought (>70) or oversold (<30) levels, indicating a possible reversal; exiting when the price closes back over the moving average; or employing another form of technical analysis to determine an exit point.
This strategy's strength lies in its dual filter system, leveraging the RSI for market sentiment and the MA's directionality for confirmation, aiming to optimise entry points while potentially minimising risks associated with flat or consolidating markets.
RSI Divergence and Renko
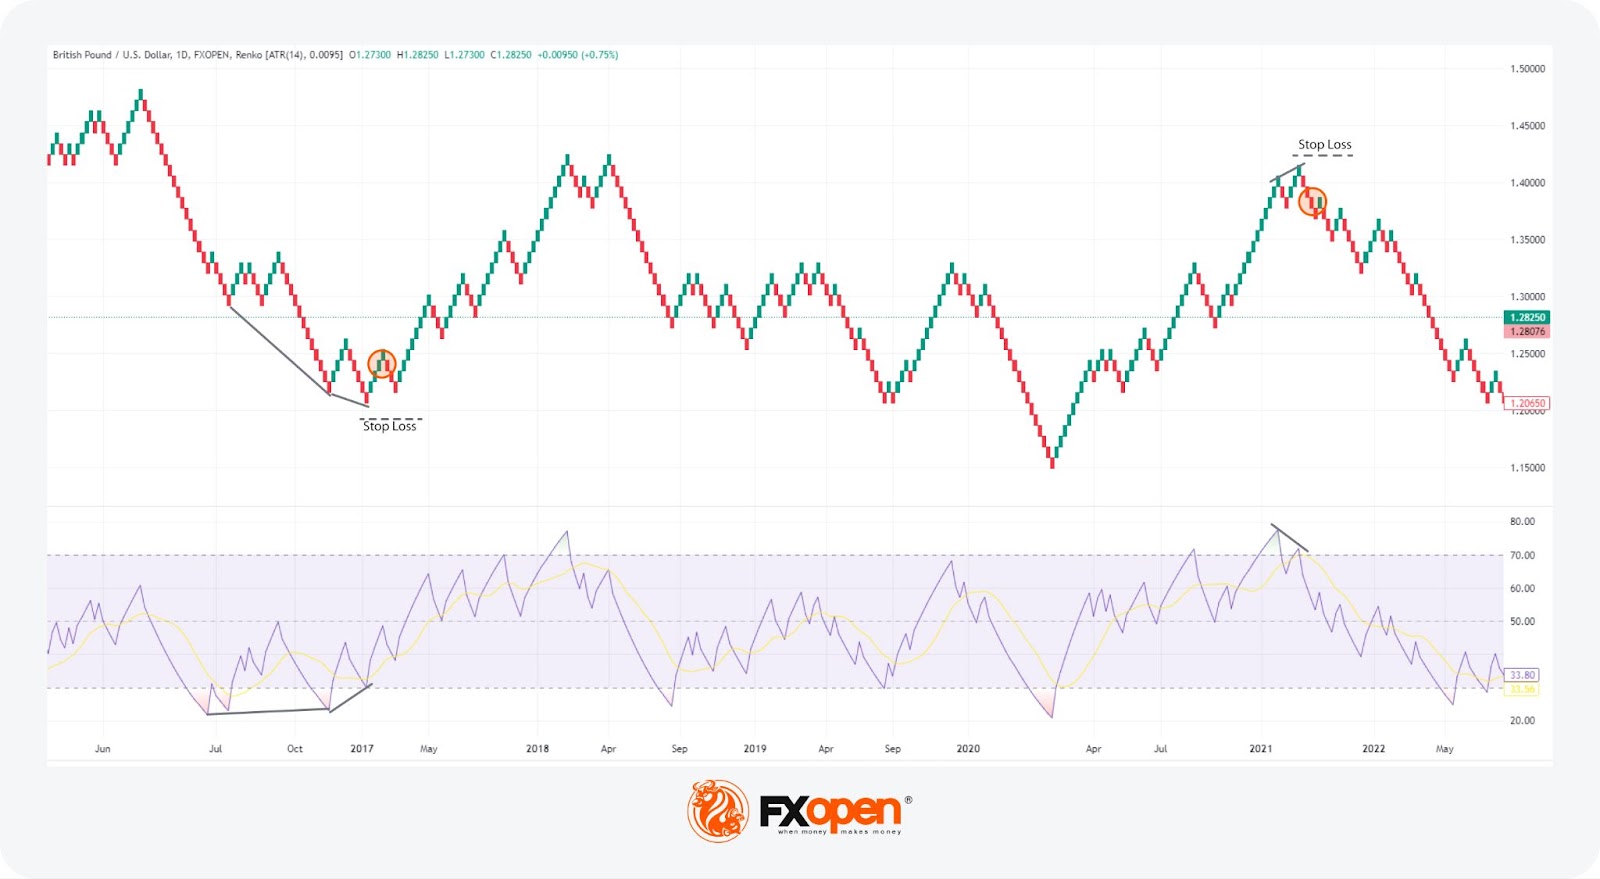
The RSI Divergence and Renko trading strategy combines the insight of the RSI with the clarity of Renko charts to identify potential reversal points in the market. Divergence occurs when the RSI moves in the opposite direction to price, indicating potential weakness in the current trend. For instance, if the price hits a new high but the RSI fails to do the same, it suggests a loss of momentum.
Entry
- Traders typically monitor the RSI for signs of overbought (>70) or oversold (<30) conditions alongside divergence with price action.
- The first trigger is seen when the price crosses back into the normal RSI range or the RSI makes a sustained move higher/lower, indicating that the divergence’s reversal is likely underway.
- Entries are often considered after two or three Renko blocks move in the direction of the projected reversal, especially if this aligns with the broader market trend.
Stop Loss
- According to the theory, placing stop losses above the nearest swing high (for bearish setups) or below the nearest swing low (for bullish setups) is most common here.
Take Profit
- Profits may be considered when the RSI reaches the opposite overbought/oversold territory, signalling a potential end to the reversal.
- Alternatively, a suitable exit point may be determined through other forms of technical analysis or indicators.
Key Considerations Before Using Renko Charts
Before incorporating Renko charts into trading strategies, there are several critical considerations many traders account for to utilise them effectively:
- Box Size Selection: The choice of box size is paramount. A smaller box size can lead to more sensitivity to price movements, potentially increasing the noise, while a larger box size may filter out significant market activity. Traders try to find a balance that aligns with their trading style.
- Delayed Signals: Due to the nature of Renko charts focusing on price movement and not time, signals may appear more slowly than in time-based charts. This characteristic can lead to delayed entries and exits in rapidly moving markets.
- Complementary Tools Requirement: Renko charts do not incorporate volume or time, aspects that can be crucial in understanding market dynamics. Hence, it may be useful to pair Renko charts with other indicators or analysis tools to gain a comprehensive view of the market.
- Understanding Market Context: Traders should be aware that Renko charts might oversimplify market conditions. A thorough analysis of the broader market context is essential to interpret Renko charts accurately and make informed trading decisions.
- Availability: Not all trading platforms offer Renko charting. In Metatrader, Renko charts are only available via third-party indicators. However, they are found in TradingView, though a subscription is required for intraday Renko charting.
The Bottom Line
Exploring Renko charts and their integration with various indicators unfolds a realm of potential trading opportunities. Each strategy detailed offers a pathway to potential market entries and trend following and reversal identifications.
As traders embark on this journey, experimenting with these strategies using a demo account can be invaluable. Likewise, for those looking to apply these insights in live markets, opening an FXOpen account could serve as a gateway to harnessing the potential of Renko chart-based trading strategies with a reputable broker.
FAQs
What Is a Renko Chart?
A Renko chart is a type of trading chart that represents price movements with bricks (or blocks) instead of traditional lines or bars. Each brick represents a predefined price movement, and these bricks are only added to the chart when the price moves by that amount, effectively filtering out minor fluctuations and highlighting significant trends.
How Do Renko Charts Work?
Renko charts focus solely on price changes, disregarding time and volume. A new brick is added to the chart only when the price moves by a predetermined amount in any direction. Consecutive bricks of the same colour indicate a trend, while a change in brick colour suggests a potential reversal or shift in market direction.
How to Trade Renko Charts?
Trading with Renko charts involves identifying trend directions, support and resistance levels, and potential reversals. Traders often combine Renko charts with other indicators to confirm trends and signals before entering or exiting trades, aiming for a more informed and strategic approach to trading.
How to Install Renko Charts on MT4 (MT5)?
Renko charts are not natively supported in MT4 or MT5 but can be added through custom indicators or Expert Advisors (EAs). To install, download a Renko chart indicator or EA, copy it to the 'Indicators' or 'Experts' folder in your MT4/MT5 directory, and then restart the platform. Finally, attach the Renko indicator to a chart from the 'Navigator' pane to begin using Renko charts for analysis.
This article represents the opinion of the Companies operating under the FXOpen brand only. It is not to be construed as an offer, solicitation, or recommendation with respect to products and services provided by the Companies operating under the FXOpen brand, nor is it to be considered financial advice.
Stay ahead of the market!
Subscribe now to our mailing list and receive the latest market news and insights delivered directly to your inbox.


Latest articles

USD/CAD: One Trendline Away From Deciding the Next Move
After several strongly positive weeks, USD/CAD has stalled over the past few sessions, entering a phase of uncertainty.
On the dollar side, Fed Chair Kevin Warsh has struck a firm tone, reaffirming the 2% inflation target and pushing back

Amazon: New Bond Issuance to Fund AI Infrastructure
On 7 July, Amazon announced an eight-tranche bond offering worth at least $25 billion, with the proceeds expected to finance the construction of data centres and the expansion of its artificial intelligence infrastructure. Investor demand peaked at $62 billion, highlighting

Weekly Market Insights with Gary Thomson: US Inflation, UK GDP, Chair Warsh Testimony, and Earnings
In this video, we’ll explore the key economic events and market trends, shaping the financial landscape. Get ready for insights into financial markets to help you navigate the week ahead. Let’s dive in!
In this episode of Market