


FXOpen

The three outside up and three outside down candlestick patterns offer traders a powerful way to analyse potential market reversals. Formed by 3 consecutive candlesticks they can signal key shifts in market sentiment, providing valuable insights into future price movements. In this article, we’ll break down how traders identify, trade, and confirm these patterns.
What Are the Three Outside Up and Down Patterns?
The three outside candlestick patterns are powerful tools in technical analysis that can help traders analyse potential market reversals. These patterns are made up of three consecutive candlesticks that reveal shifts in market sentiment. There are two variations: the three outside up and three outside down formations, each signalling opposite directions.
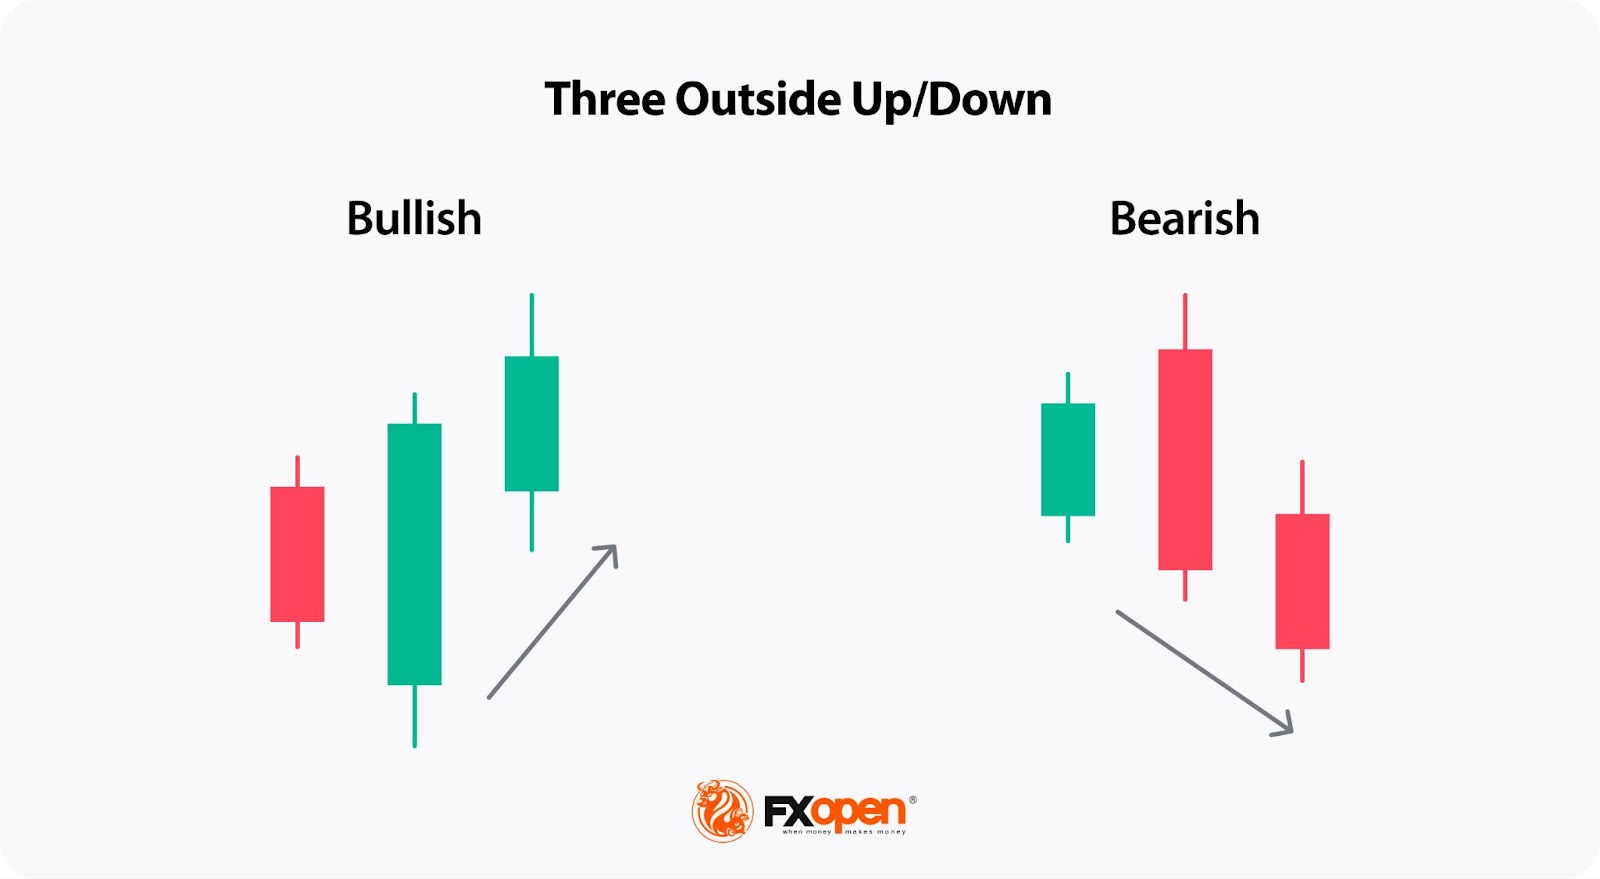
In a three outside up pattern, the first candle is a small bearish one, followed by a second, larger bullish candle that completely engulfs the first. The third candle is another bullish one, confirming the momentum shift toward a potential upward trend. This type typically forms after a downtrend, hinting that the market could be turning bullish.
On the flip side, the three outside down candlestick pattern starts with a small bullish candle. The second candle is a larger bearish one that engulfs the first, and the third is another bearish bar, signalling that sellers are gaining control. This formation usually appears after an uptrend and suggests a possible bearish reversal.
Three outside candle patterns are particularly useful because they provide multiple points of confirmation—first, the engulfing candle, and then the third which further solidifies the trend. They often appear on various asset classes, from stocks to forex, and can be a valuable part of a trader's analysis.
The Psychology Behind The Three Outside Patterns
Understanding the psychology driving these patterns can give traders better insight into market dynamics. With the three outside up candlestick pattern, the initial small bearish candle shows hesitation, but the large bullish candle that follows reflects a surge in buyer confidence. The final bullish candle confirms that buyers have taken control, possibly signalling a shift from bearish to bullish sentiment.
In contrast, the three outside down reflects a change from bullish optimism to bearish caution. The first candle shows a continuation of buying pressure, but the second, larger bearish bar reveals that sellers are stepping in with strength. The third bearish candle reinforces this shift in market sentiment.

Identification Steps
Identifying the three outside candle patterns is straightforward once you know what to look for. The key is focusing on the structure and order of the three candlesticks.
Want to have a go at spotting the formation for yourself? Head over to FXOpen’s advanced TickTrader trading platform to access hundreds of real-time charts.
Three Outside Up Pattern
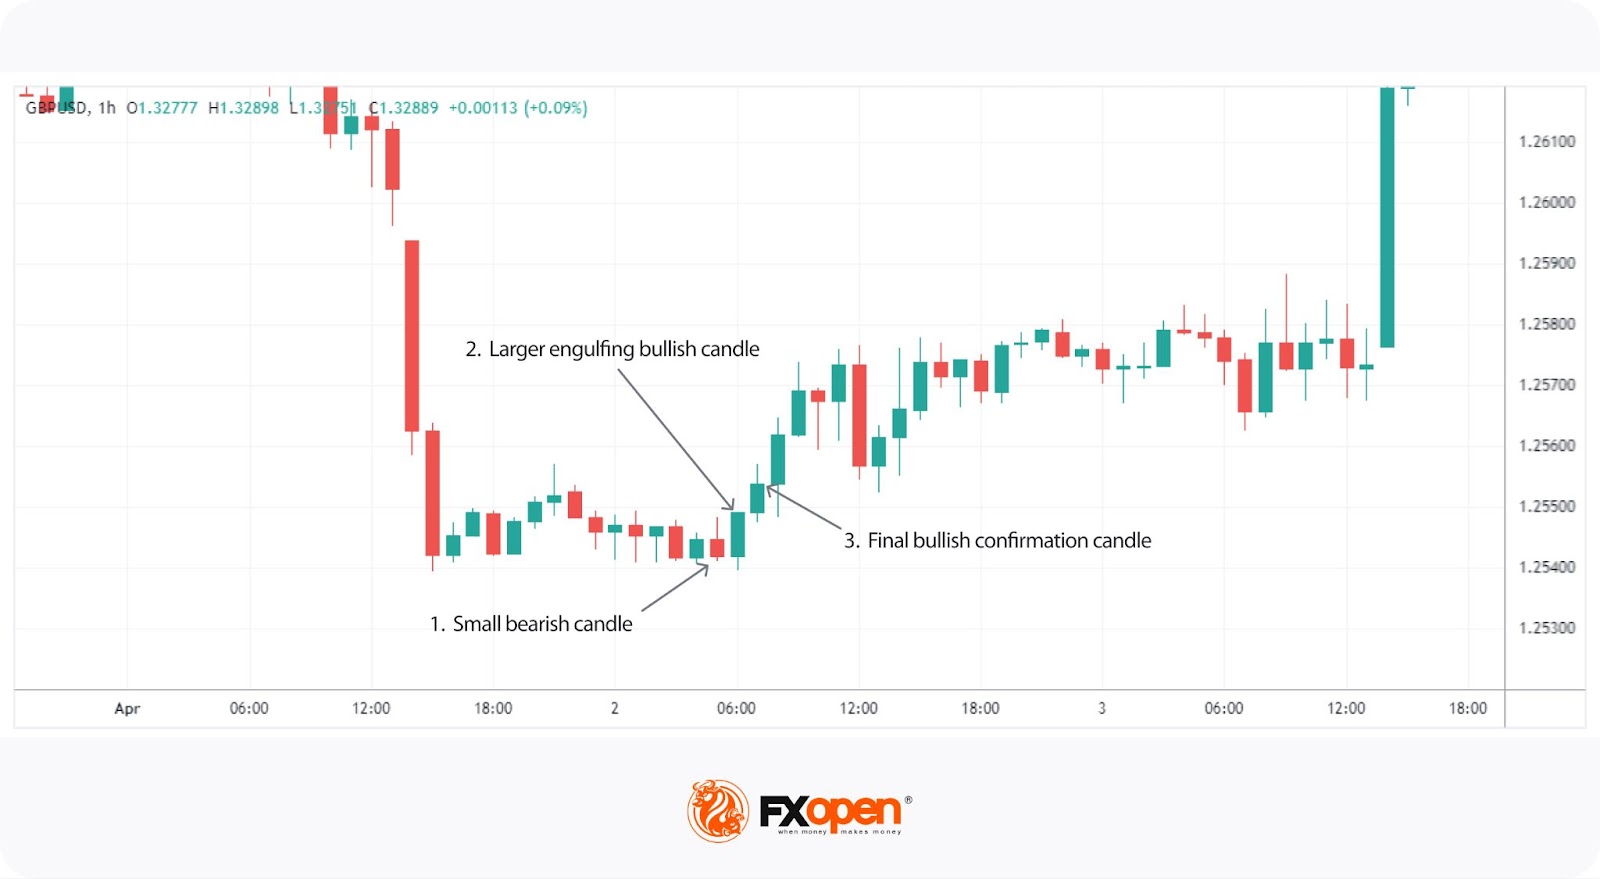
- First Candle: This is a small bearish candlestick that occurs within a downtrend. It suggests that the market still favours sellers, but it’s weak.
- Second Candle: The crucial point of the formation. The second candle is a much larger bullish one that engulfs the entire body of the first one.
- Third Candle: Another bullish candle that confirms the pattern. Its close is above the second’s close, solidifying the upward momentum.
Three Outside Down Pattern
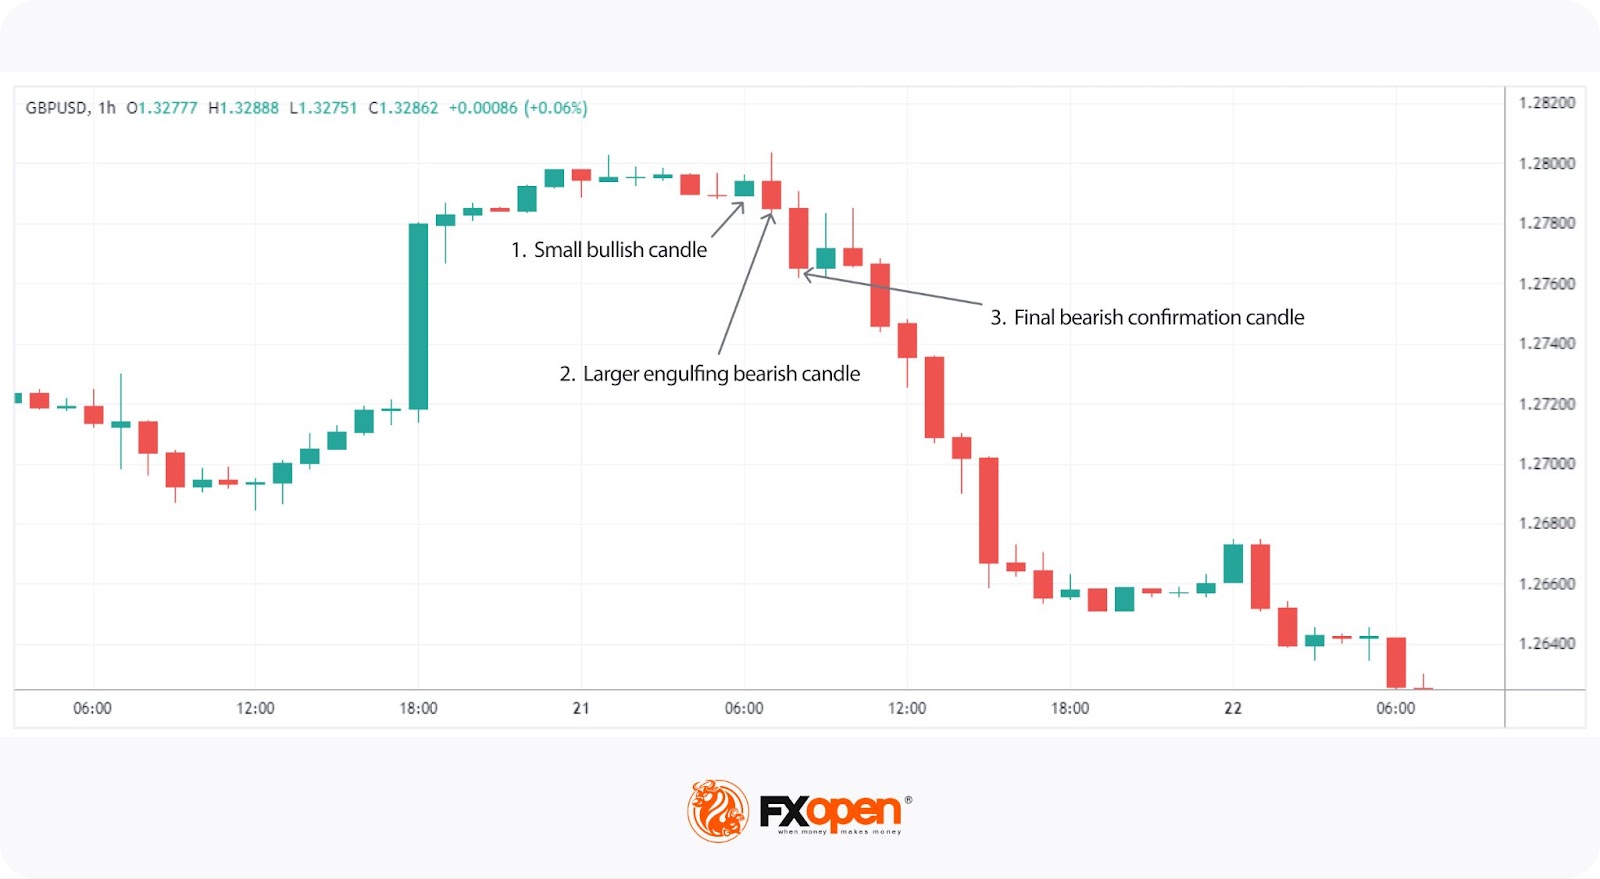
- First Candle: This is a small bullish candle within an uptrend, reflecting weaker buying interest.
- Second Candle: The key feature. A larger bearish bar fully engulfs the first one.
- Third Candle: A second bearish candle follows, closing lower than the second and reinforcing the shift in sentiment toward selling pressure.
Other Considerations
- Engulfing Candle Size: The bigger the second candle in relation to the first, the stronger the signal. It indicates a more decisive shift in market sentiment.
- Timeframe: They can appear across various timeframes, but they're expected to be more reliable on longer ones, such as daily or weekly charts. Lower timeframes can lead to wrong trade decisions.
- Context: While the formation itself is important, it’s key to consider the broader market environment. Combining it with other forms of analysis, like trendlines or indicators, can increase the reliability of your trade decisions.
Three Outside Candle Pattern: a Trading Strategy
Trading the three outside up and three outside down patterns requires understanding both how to spot the signal and how to manage the trade. Here’s a step-by-step approach to using these patterns in real-world scenarios.
Entering a Trade
For both types, traders typically wait for the close of the third candle to confirm the pattern before making any moves. For the three outside up, a trader may analyse the close of the third bullish bar as confirmation of potential upward momentum. In contrast, for the three outside down, the third bearish candle indicates potential downward momentum.
It’s common to enter trades at the open of the next candlestick, following the pattern, but waiting for a slight pullback or additional confirmation from another technical indicator (e.g., RSI or moving averages) is also a prudent strategy.
Stop Loss Placement
To potentially manage risk, traders often place stop losses at strategic points on the chart. In the case of a three outside up, it’s typical to place a stop loss just below the low of the engulfing (second) candle. This allows some breathing room but potentially protects against the risk of a reversal.
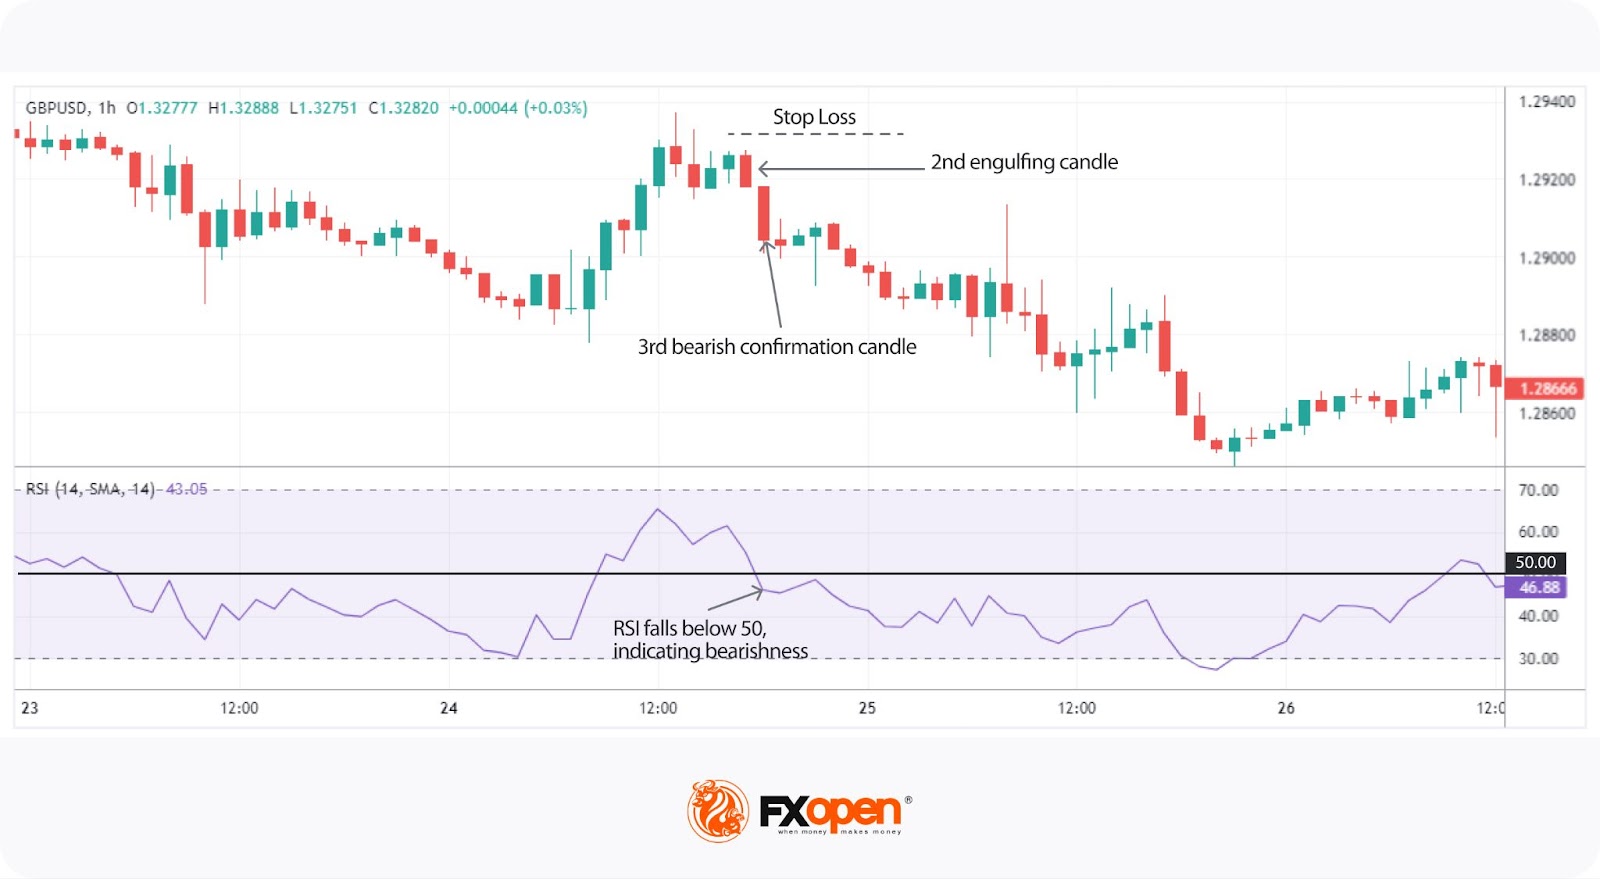
For the three outside down, a stop loss is commonly set just above the high of the engulfing candlestick.
Take Profit Strategy
Setting a take-profit target usually involves identifying potential resistance or support levels. For a three outside up, traders often target the next key resistance level. It’s also common to use a risk-reward ratio of 1:2 or higher, ensuring that the potential returns justify the risk taken.
In the case of a three outside down pattern, traders aim for the next support level as a potential area to take returns. Again, maintaining a favourable risk-reward ratio is crucial in preserving long-term trades.
How Traders Confirm Three Outside Candlestick Patterns
Confirming the three outside up and three outside down patterns is crucial for potentially avoiding false signals and increasing the reliability of your analysis. While the formation can signal a potential reversal, using additional tools to verify the move can help traders make more accurate decisions.
Here are a few ways traders typically confirm the pattern:
- Momentum Indicators: Traders often use momentum tools like the relative strength index, moving average convergence divergence, or stochastic oscillator to gauge whether the pattern aligns with market momentum. If these indicators show overbought or oversold conditions, it can confirm the strength of the signal.
- Volume Analysis: An increase in volume on the second and third candlesticks adds weight to the analysis, suggesting that more market participants are involved in the move. Higher volume often indicates stronger conviction behind the shift.
- Trendlines and Moving Averages: Many traders use trendlines or moving averages to confirm the pattern’s validity. For a three outside up, a breakout above a downtrend line or crossing above a key moving average reinforces the bullish signal. For a three outside down, a break below a trendline or drop under a moving average strengthens the bearish case.
Common Mistakes to Avoid
While these patterns can provide useful insights, there are common mistakes traders make when using them. Understanding them can help improve analysis and decision-making.
- Ignoring Volume: One of the key signs of a strong formation is the higher volume on the second and third candles. Without this, it may lack the strength needed to suggest a real market shift.
- Use in Isolation: Relying solely on the candlestick pattern without considering other indicators or market conditions often leads to misleading signals. It’s important to incorporate other technical tools to build a stronger case.
- Forcing the Pattern: Traders sometimes try to identify the pattern even when it doesn’t meet the criteria, leading to poor decisions. Both the engulfing and confirmation bars need to be clear and distinct for the formation to be valid.
- Overlooking Trend Context: They are more reliable when they occur after a clear uptrend or downtrend. Attempting to trade them in a range-bound market or against the prevailing trend can reduce their effectiveness.
The Bottom Line
The three outside patterns are valuable tools for identifying potential market reversals when combined with other technical analysis methods. In combination with sound risk management, these formations can offer traders a boost in their strategies.
To put what you’ve learned into practice across more than 700 markets, consider opening an FXOpen account. FXOpen offers several advanced trading platforms, low costs, and blazing-fast trade execution speeds designed to upgrade your trading experience.
FAQ
What Is the Pattern of Three Outside Candlesticks?
The three outside candlesticks pattern is a reversal formation made up of three consecutive candles. In the three outside up, a small bearish candle is followed by a larger bullish one that engulfs it. A third bullish candle confirms the upward move. The three outside down is the opposite, starting with a small bullish candlestick engulfed by a larger bearish one, with a final bearish candle confirming the potential downtrend.
What Happens After Three Outside Up?
After a three outside up, the market may experience a bullish reversal. The formation suggests that buyers are gaining momentum, and traders may see upward price movement following the confirmation of the third candle.
What Is the Success Rate of the Three Outside Up?
The success rate of the three outside up pattern varies depending on market conditions and timeframe. While it can be an effective reversal signal, it’s expected to be more reliable when combined with other indicators like volume or trendlines.
What Do Three Candlesticks Mean?
Three candlesticks refer to a specific pattern where three consecutive candles form a signal, often indicating potential reversals or trend confirmations in technical analysis.
What Is 3 Candlestick Strategy?
The 3 candlestick strategy involves identifying patterns like three outside up or three outside down, where 3 candles signal potential market reversals or continuations. It’s often used to analyse future price movements.
This article represents the opinion of the Companies operating under the FXOpen brand only. It is not to be construed as an offer, solicitation, or recommendation with respect to products and services provided by the Companies operating under the FXOpen brand, nor is it to be considered financial advice.
Stay ahead of the market!
Subscribe now to our mailing list and receive the latest market news and insights delivered directly to your inbox.


Latest articles

Market Analysis: GBP/USD Dips Further As EUR/GBP Regains Traction
GBP/USD failed to climb above 1.3500 and corrected some gains. EUR/GBP started a decent increase and might aim for more gains above 0.8700.
Important Takeaways for GBP/USD and EUR/GBP Analysis Today
· The British Pound


Market Insights with Gary Thomson: Oil, US Retail Sales & NFP in Focus
In this video, we’ll explore the key economic events and market trends, shaping the financial landscape. Get ready for insights into financial markets to help you navigate the week ahead. Let’s dive in!
In this episode of Market