


Trading With the Three Drives Pattern
FXOpen
Harmonic patterns are known for their ability to provide effective trade setups. The Three Drives pattern is no different, and in this FXOpen article, we’ll delve into what this pattern is, how to identify it, and explore some of the best strategies for trading it.
Introduction to the Three Drives
The Three Drives pattern, sometimes referred to as the 3 Drives pattern, is a technical analysis tool used to identify potential reversal points in price movements. Traders look for three consecutive, symmetrical bullish or bearish legs, known as drives, with the third point marking the completion of the formation.
The Three Drives is classified as a harmonic pattern and is closely related to the ABCD pattern. However, whereas the ABCD is made up of two legs and one pullback, the Three Drives consists of three legs and two pullbacks.
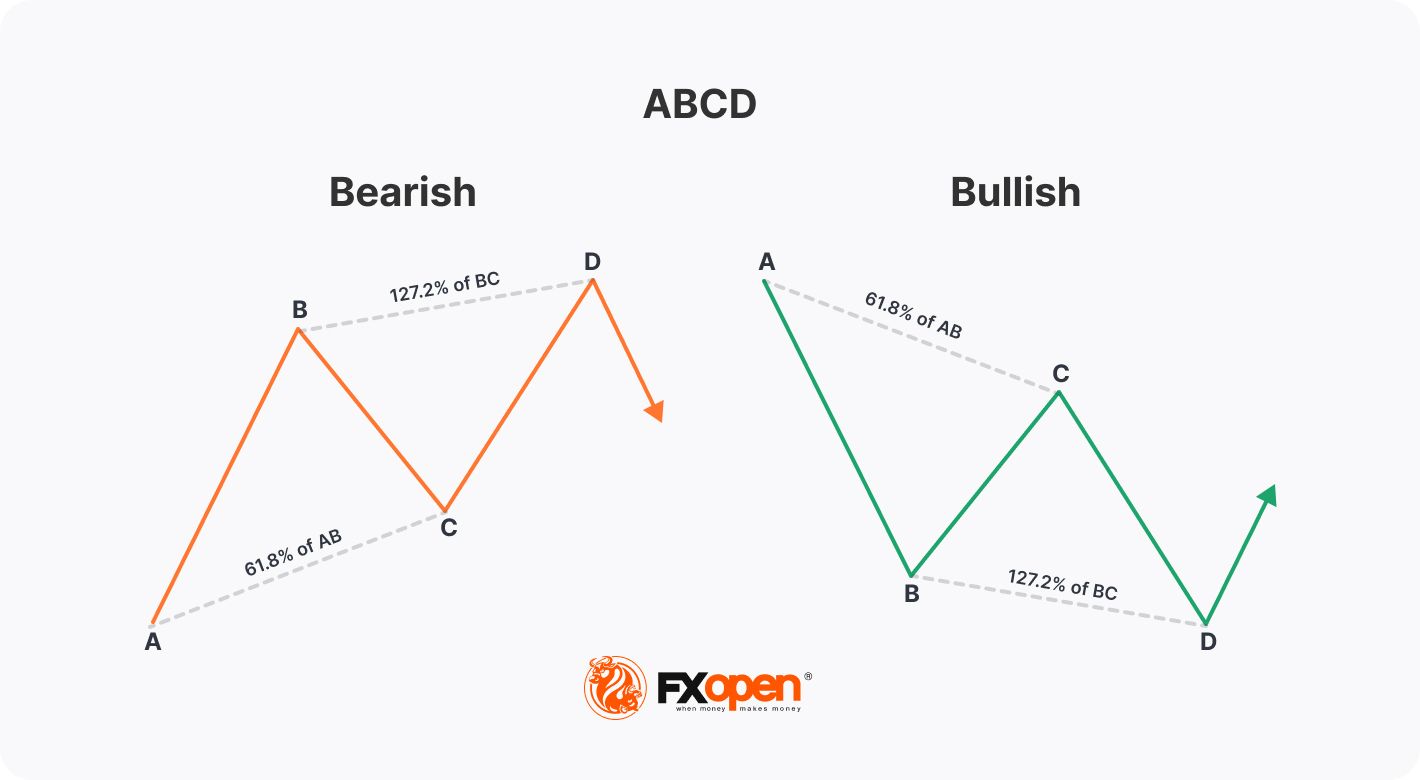
As a result, it can be slightly trickier to find than the regular ABCD chart formation. Still, many traders consider it to have a higher degree of accuracy when predicting trend reversals, so it’s worth learning how to recognise this pattern.
Identifying the Three Drives
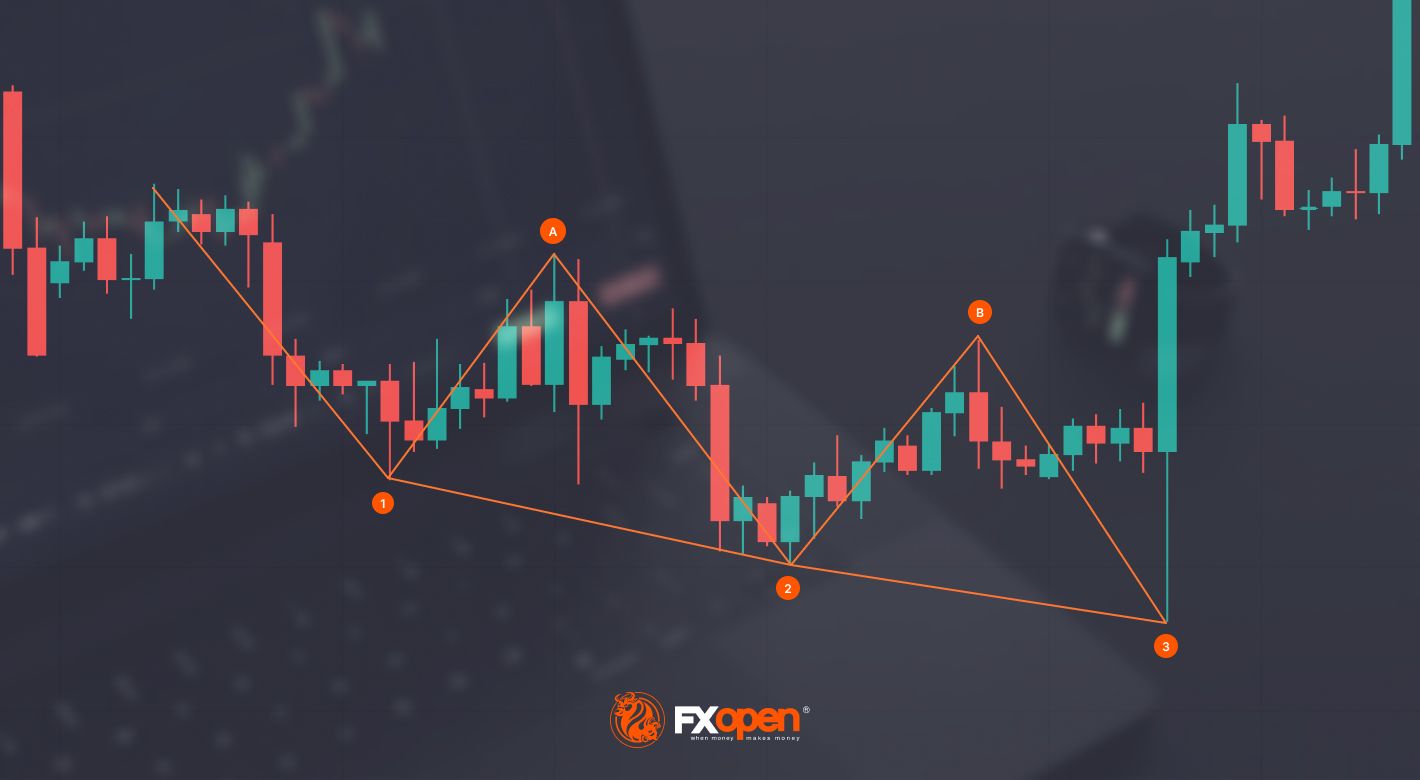
At its most basic, the pattern is identified by a series of higher highs and higher lows (bearish) or lower highs and lower lows (bullish). Specifically, it features three consecutive, symmetrical drives and two retracements. The drives are typically marked 1, 2, and 3, and the retracements are noted as A and B.
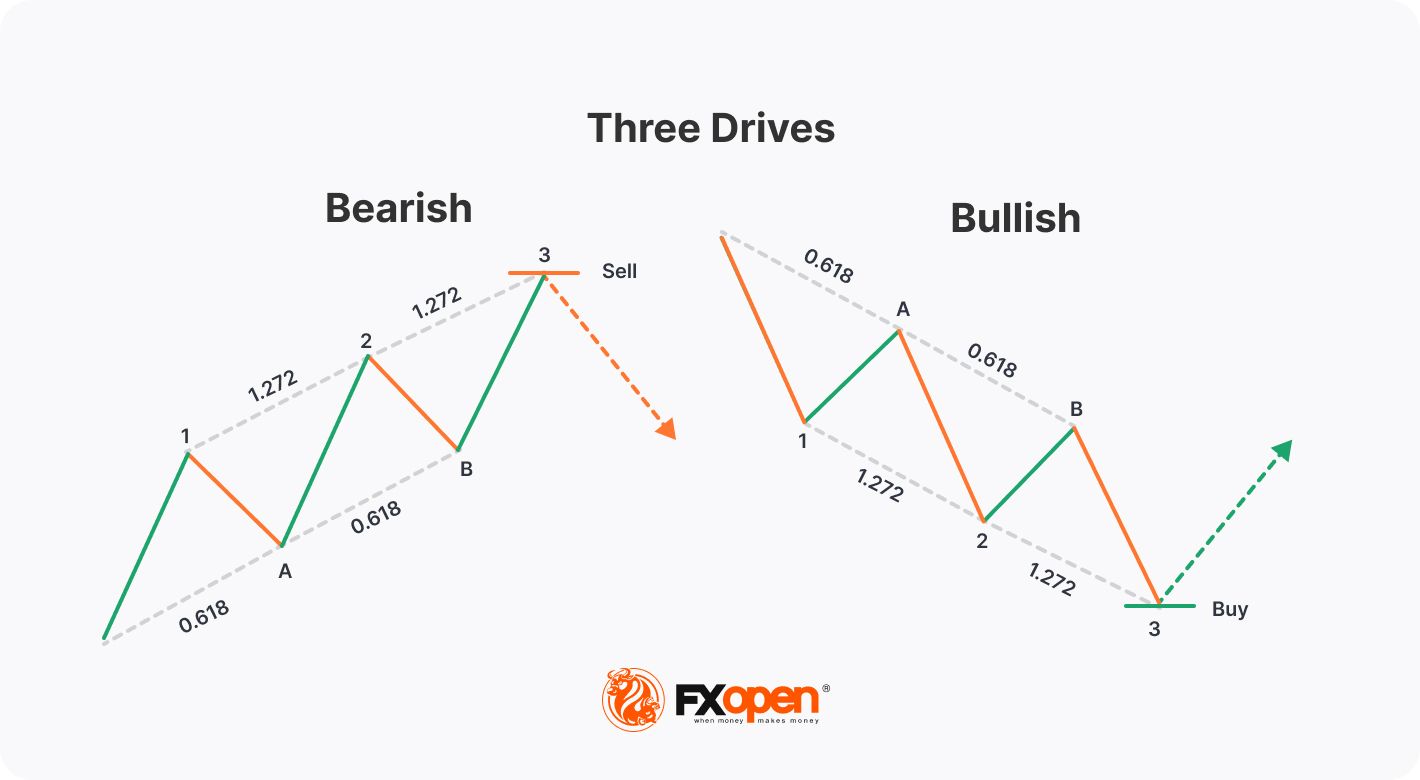
Like other harmonic patterns, the Three Drives is confirmed using Fibonacci ratios. Thankfully, its rules are fairly simple. They are:
- A retraces drive 1 by 61.8% or 78.6%
- B retraces drive 2 by 61.8% or 78.6%
- Drive 2 is a 127.2% to 161.8% extension of retracement A
- Drive 3 is a 127.2% to 161.8% extension of retracement B
Additionally, for best results, the pattern calls for the time each drive takes to form to be roughly the same. This also applies to the corrective phases.
As with many harmonics, being flexible with the rules may help you distinguish more opportunities. Often, the Three Drives will work without perfect symmetry or the ratios lining up exactly. That’s not to say you shouldn’t aim for it to meet the rules as precisely as possible, but you can allow a bit of leeway if the overall formation looks correct.
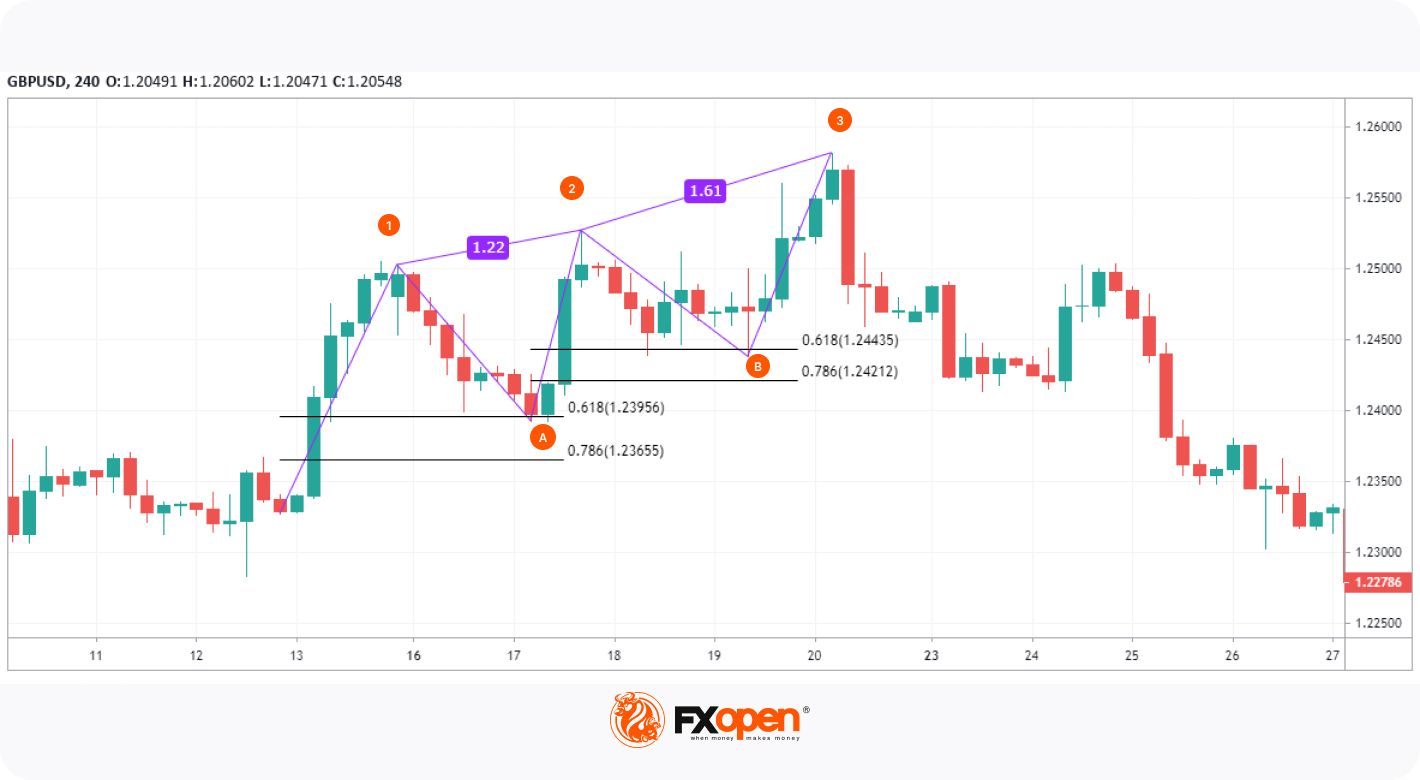
If you want to try your hand at finding the Three Drives, you can use the TickTrader platform. It’s free to use, and you’ll find built-in Three Drives and Fibonacci retracement tools that’ll help you plot the formation, just like we’ve used in the bearish Three Drives forex example above.
Using the Three Drives Pattern for Trading
Once you have identified the pattern, it’s time to put it into action. Note that these steps don’t just apply to forex trading; you can use them with whatever asset you prefer to trade.
Entries
You have two options for making an entry here: with a market order or a limit order. Some traders set a limit order at the 127.2% or 161.8% extension of B, where the third drive is expected to begin reversing. However, while this strategy may result in pinpoint entries, it also makes setting stop losses difficult, as you’re entering before the price has started to reverse.
Waiting for price action confirmation might make setting stops much easier but can result in a worse risk/reward ratio. You could try waiting for signs of reversal with candlestick patterns like shooting stars, hammers, or engulfing candles before entering with a market order.
Stop Loss
If you choose to wait for confirmation, you can just set your stop above the highest point for a bearish Three Drives or beneath the lowest point for a bullish setup.
If you’re using a limit order at 161.8%, you could try setting a stop beyond the 170% or 175% extension of B, which would invalidate the setup. You could do something similar if entering at 127.2%.
Take Profits
Your profit target here is quite flexible. You could choose to exit at a specific risk/reward ratio, like 1:2 or 1:3. Some look to take profit at the 61.8% retracement of the whole pattern, i.e., using the Fibonacci retracement tool from the start of the first drive and the end of the third drive.
Alternatively, you could also use the Fibonacci extension tool to find the 127.2% or 161.8% extensions of the entire formation and set a profit target at either level.
Bullish Example
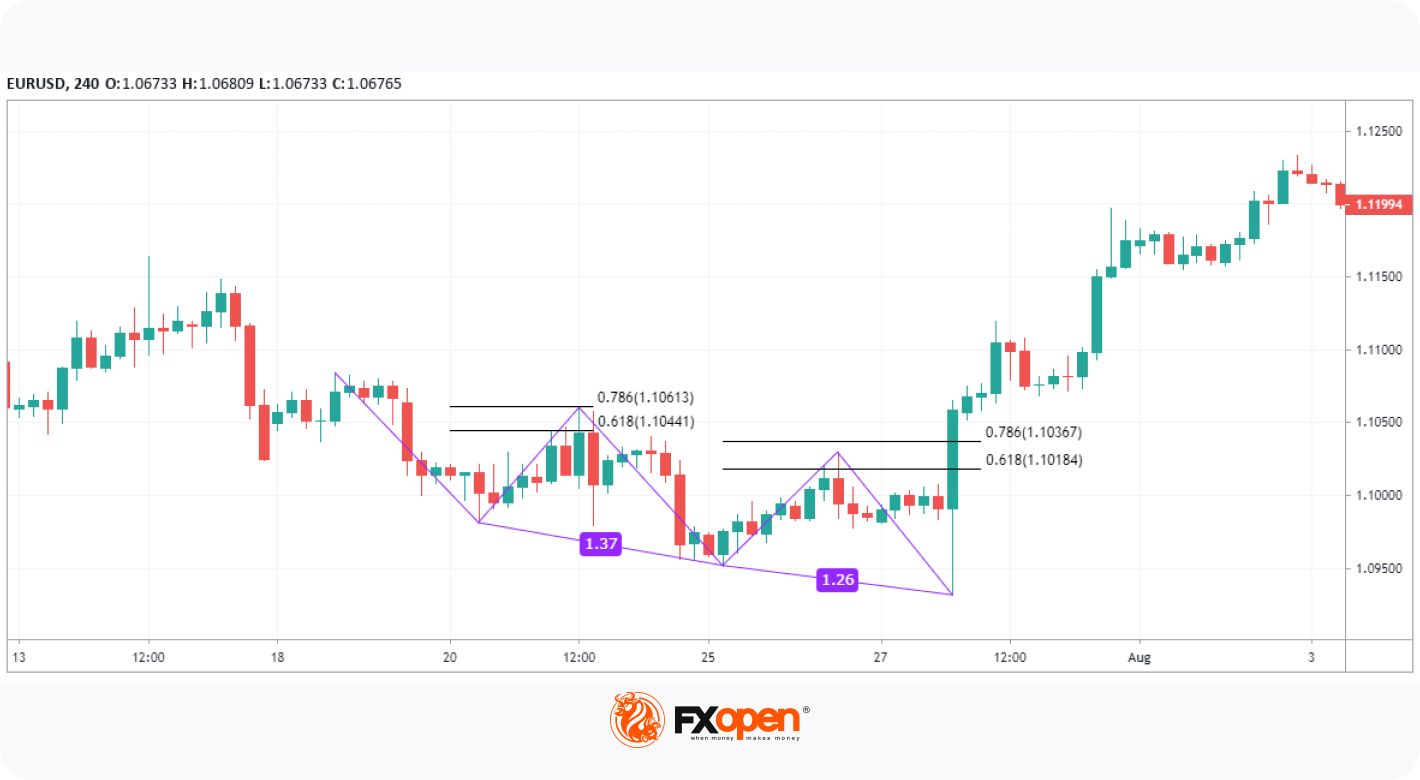
Here, we can see the roughly symmetrical 3 Drives pattern in the forex market that prompted a significant reversal. Following the massive engulfing candle, a market order would’ve gotten traders into a decent trade.
Bearish Example
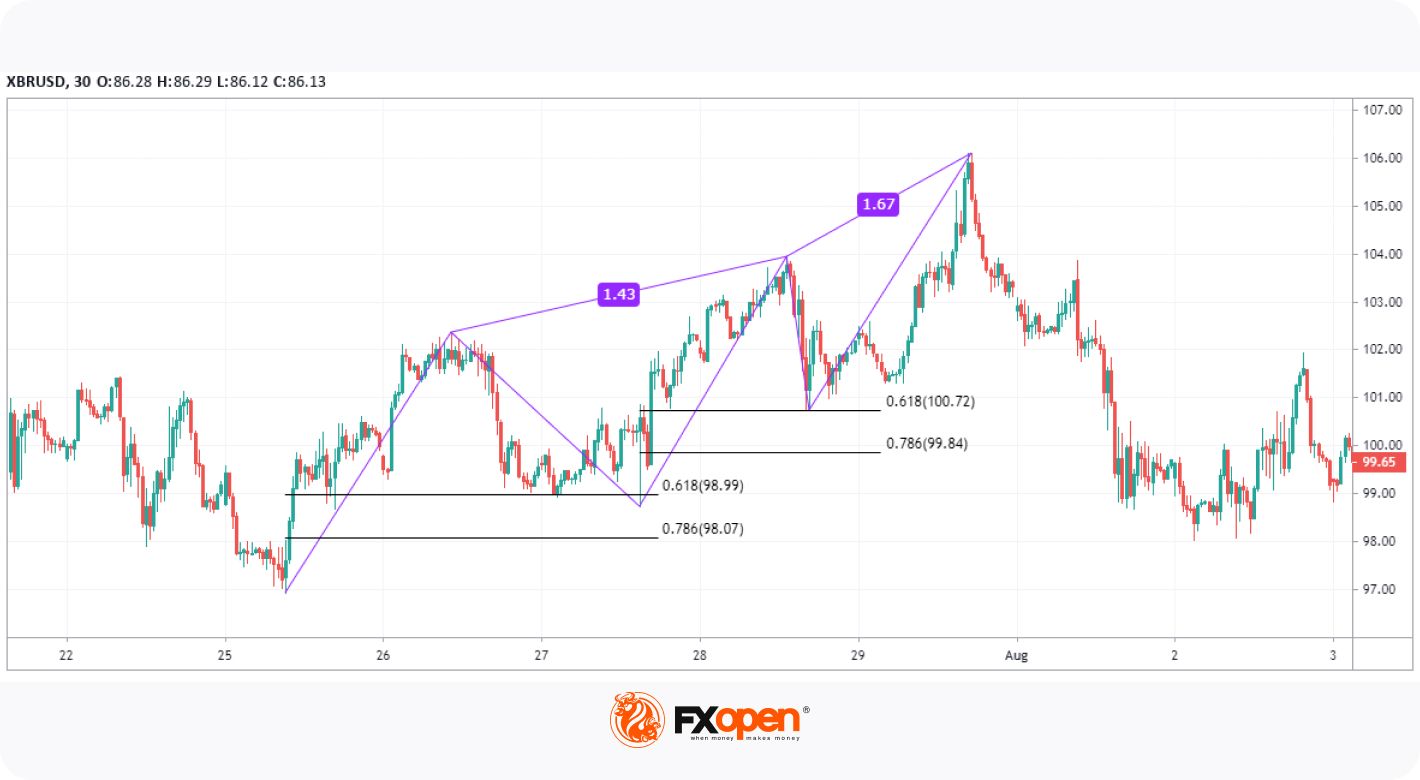
In this example, we see a much larger pattern. While the final drive ended up slightly beyond the 161.8% area, the symmetry and almost perfect retracements to the 61.8% levels indicate that the pattern was likely to play out as expected. Traders could’ve entered at the projected 161.8% extension of the second retracement with a stop above the 170% level to secure an excellent risk/reward ratio.
Your Next Steps
By now, you should have an understanding of the Three Drives pattern and how to recognise it. If you’re wondering what to do next, you can try following these steps:
- Practice identifying the formation on historical charts. You can use TickTrader to help with this.
- Once you become more familiar with the pattern, start formulating a strategy. You could try backtesting a few setups to see how well your system works.
- You can open an FXOpen account and test your strategy in live markets to refine your approach.
- Read up on related topics, like harmonic patterns and Fibonacci retracements, to expand your knowledge.
These four steps may put you in good stead when it comes to trading the Three Drives chart formation for real. Happy trading!
This article represents the opinion of the Companies operating under the FXOpen brand only. It is not to be construed as an offer, solicitation, or recommendation with respect to products and services provided by the Companies operating under the FXOpen brand, nor is it to be considered financial advice.
Stay ahead of the market!
Subscribe now to our mailing list and receive the latest market news and insights delivered directly to your inbox.


Latest articles

AI Valuations Are Back in the Spotlight
Artificial intelligence remains the dominant investment theme of 2026, but investors are increasingly questioning whether AI stock valuations are keeping pace with reality.
💰 Big Tech continues to invest at an unprecedented scale, with hyperscaler AI spending projected to exceed $800

AUD/CAD: Months of Indecision — Is a Breakout Finally Coming?
The Australian dollar has clawed back most of its end-of-June losses, when it touched three-month lows against the greenback amid escalating Middle East tensions. Since then, sentiment has improved: the RBA's Assistant Governor Sarah Hunter signalled the board stands ready

USD/JPY: Battling at the Top of the Triangle
On 3 July, Japan's Finance Minister, Satsuki Katayama, stated that the Ministry of Finance remains in close contact with US authorities regarding developments in USD/JPY as the yen traded near its weakest level in almost 40 years. Similar verbal