


FXOpen

Cross currency forex trading has emerged as an intriguing segment that presents unique opportunities and challenges. In this article, we discuss commonly traded pairs, liquidity challenges, and the factors influencing cross exchange rates. Additionally, we present three trading strategies to help traders navigate the dynamic scene of forex cross currency pairs.
Understanding Cross Currency Trading
Knowing the basic concept of cross currency trading and considering the most frequently traded pairs can open a new realm of opportunities for traders.
Excluding the US Dollar Offers Opportunities
Cross currency pairs, also known as "crosses," involve currencies that are not paired with the US dollar (USD). For instance, if the euro (EUR) is traded against the Japanese yen (JPY), it forms a cross currency pair. Cross currency pairs introduce diversification opportunities and allow traders to gain exposure to specific economies and their interconnections.
Cross Currency Examples
Traditionally, the best forex cross pairs to trade are those that involve currencies from major global economies other than the USA. Here are a few popular and widely traded forex cross pairs:
- EUR/JPY (Euro/Japanese Yen): Known for its liquidity and considerable volatility, this pair attracts traders looking for opportunities in the Eurozone and Japan.
- GBP/AUD (British Pound/Australian Dollar): This cross offers a mix of major currencies, providing exposure to two economically significant regions.
- EUR/AUD (Euro/Australian Dollar): Combining the euro and Australian dollar, this pair is favoured for its liquidity and potential trend movements.
- GBP/JPY (British Pound/Japanese Yen): Renowned for its volatility, this pair is favoured by traders seeking the potential for substantial price movements.
Cross Currency Pairs May Have Liquidity Issues
While cross currency pairs provide diversification benefits, traders need to navigate potential liquidity challenges. Less popular crosses often exhibit wider spreads, diminishing their attractiveness due to the increased transaction costs. The lower liquidity in these pairs can result in slippage, where the execution price deviates from the expected price at the time of order placement. To mitigate these challenges, traders implement advanced order types, like limit orders, which can further enhance precision in trade execution, and stop-loss orders, which can help limit potential losses.
Key Factors Affecting Cross Currency Rates
When considering major cross currency pairs, traders focus on the specific conditions of the countries involved in the pair.
- Interest Rates: Variances in interest rates between the two countries can significantly impact cross currency rates. Traders often monitor central bank decisions to anticipate interest rate changes.
- Economic Indicators: Economic data, such as GDP growth, employment figures, and inflation rates, play a crucial role in influencing cross currency exchange rates.
- Political Stability: Political events and stability in each country can impact investor confidence, leading to fluctuations in cross currency rates.
Trading Strategies for Forex Cross Currency Pairs
Effective forex strategies that exploit cross rate exchange discrepancies involve some of the most popular technical indicators.
Price Divergence Strategy: EUR/AUD
In this example for the EUR/AUD cross currency pair, traders use the divergence between the price and the On-Balance Volume (OBV) indicator to decide on taking long or short positions. Additionally, the MACD indicator is used to identify precise entry and exit points.

Entry
Traders look for a bearish/bullish divergence between the price and the OBV: the price is moving up/down, while the OBV is moving lower/higher, signalling a potential reversal of price momentum. The MACD line crossing below/above the signal line confirms a potential short or a long entry.
Stop Loss
Stop loss may be placed above/below the recent swing high or low for short and long positions, respectively.
Take Profit
Traders may set a take-profit target at a predefined support/resistance level or when the MACD line shows signs of a potential reversal.
You can visit FXOpen and try out the available technical analysis tools on our free TickTrader trading platform.
Bollinger Bands, Stochastic, and ADX Strategy: GBP/JPY
This strategy is effective in ranging markets. Bollinger Bands help identify price volatility, and the Stochastic Oscillator assists in pinpointing potential reversal points within the range. Traders often include the Average Directional Index (ADX) to assess the strength of the range-bound market.
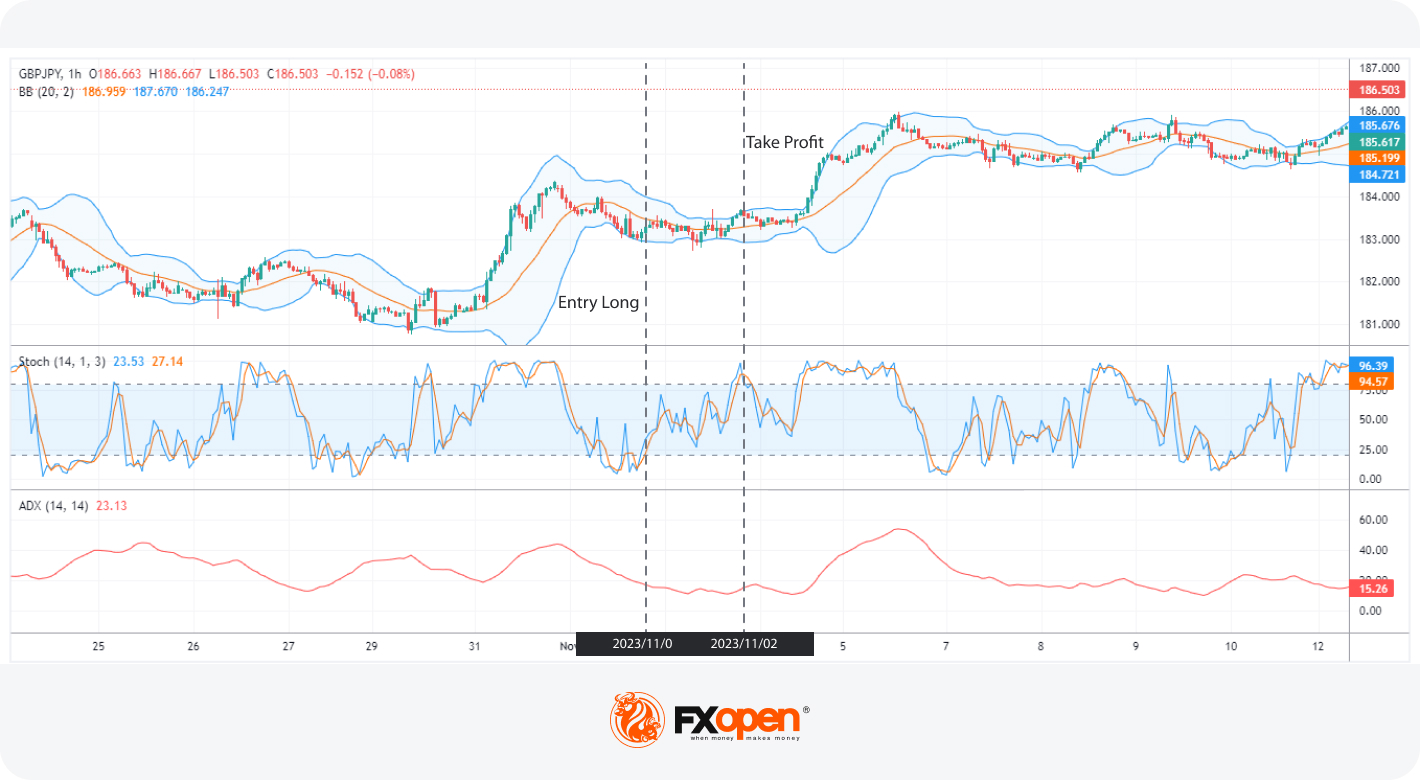
Entry
Traders may consider a long/short position when the price touches the lower/upper Bollinger Band and then reverses. The signal should be confirmed by the Stochastic Oscillator moving above/below the oversold/overbought level, while the ADX should have low values, which confirms the weakness of the current trend.
Stop Loss
Traders may consider placing a stop loss just outside the Bollinger Bands for both long and short positions, taking into account their risk preference.
Take Profit
For long/short positions, traders might take profit when the price touches the opposite Bollinger Band and the Stochastic Oscillator makes a bearish/bullish reversal.
Price Reversal Strategy: EUR/JPY
This strategy aims to identify potential trend reversals based on overbought or oversold conditions as indicated by the Relative Strength Index (RSI) and the Money Flow Index (MFI).
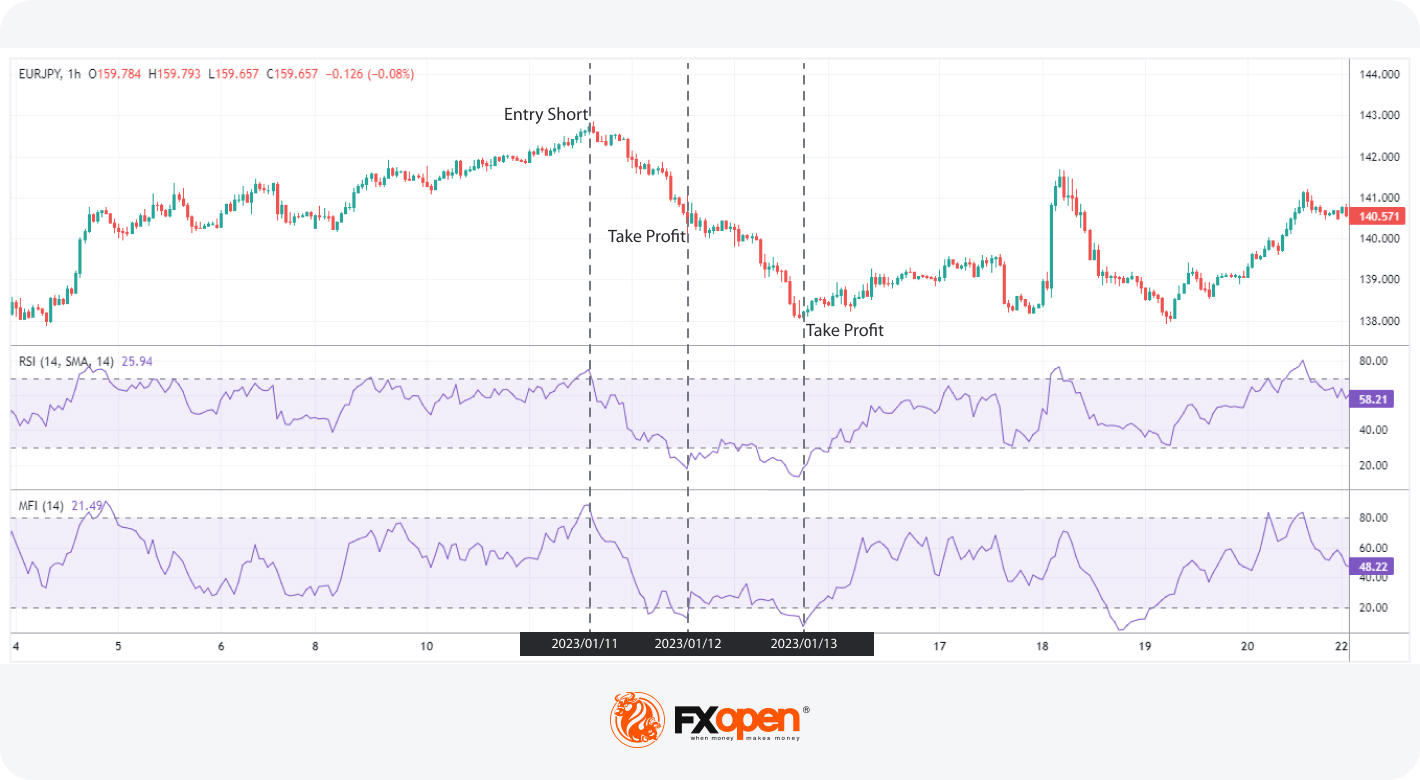
Entry
Traders may consider entering a long/short position when both RSI and MFI indicate oversold/overbought conditions, typically below 30 and above 70 for RSI and below 20 and above 80 for MFI.
Stop Loss
The theory states that a stop loss may be placed just below/above the recent swing low/high or a significant support/resistance level, depending on the trader’s risk management goals.
Take Profit
Take-profit targets might be based on potential reversals in the opposite direction of the trade, signalled by both RSI and MFI being in the overbought/oversold area.
Final Thoughts
Cross currency trading provides a unique avenue for diversification and strategic opportunities. Understanding the challenges and employing effective strategies involving multiple indicators can empower traders to deal with this complex but rewarding segment of the forex market. You can open an FXOpen account and try your advanced cross currency pairs trading strategies.
This article represents the opinion of the Companies operating under the FXOpen brand only. It is not to be construed as an offer, solicitation, or recommendation with respect to products and services provided by the Companies operating under the FXOpen brand, nor is it to be considered financial advice.
Stay ahead of the market!
Subscribe now to our mailing list and receive the latest market news and insights delivered directly to your inbox.


Latest articles

Nvidia (NVDA) Shares Surpass $200 in After-Hours Trading Following Earnings Report
Yesterday, the world’s most valuable company, Nvidia, released its quarterly earnings, which exceeded expectations:
→ Earnings per share: actual = $1.62 (forecast = $1.53);
→ Revenue: actual = $68.13 billion (forecast = $66.13 billion).
Sentiment was further supported by the chipmaker’

USD/JPY Pulls Back After a Period of Gains
As the USD/JPY chart shows, the pair posted solid bullish momentum in the second half of February. This move was driven by a combination of fundamental factors, including:
→ The appointment of two academics to the central bank’s board,

USD/JPY and USD/CAD at Key Levels Awaiting News Catalysts
The dollar is trading mixed against the major currencies as investors await important macroeconomic releases and foreign policy signals. Market participants remain cautious ahead of upcoming US data, as well as potential statements following contacts between Washington and Beijing. The