


Economic calendar: NASDAQ 100 May Keep Falling, High Volatility in Oil Markets, Potential Appreciation of the US Dollar
FXOpen

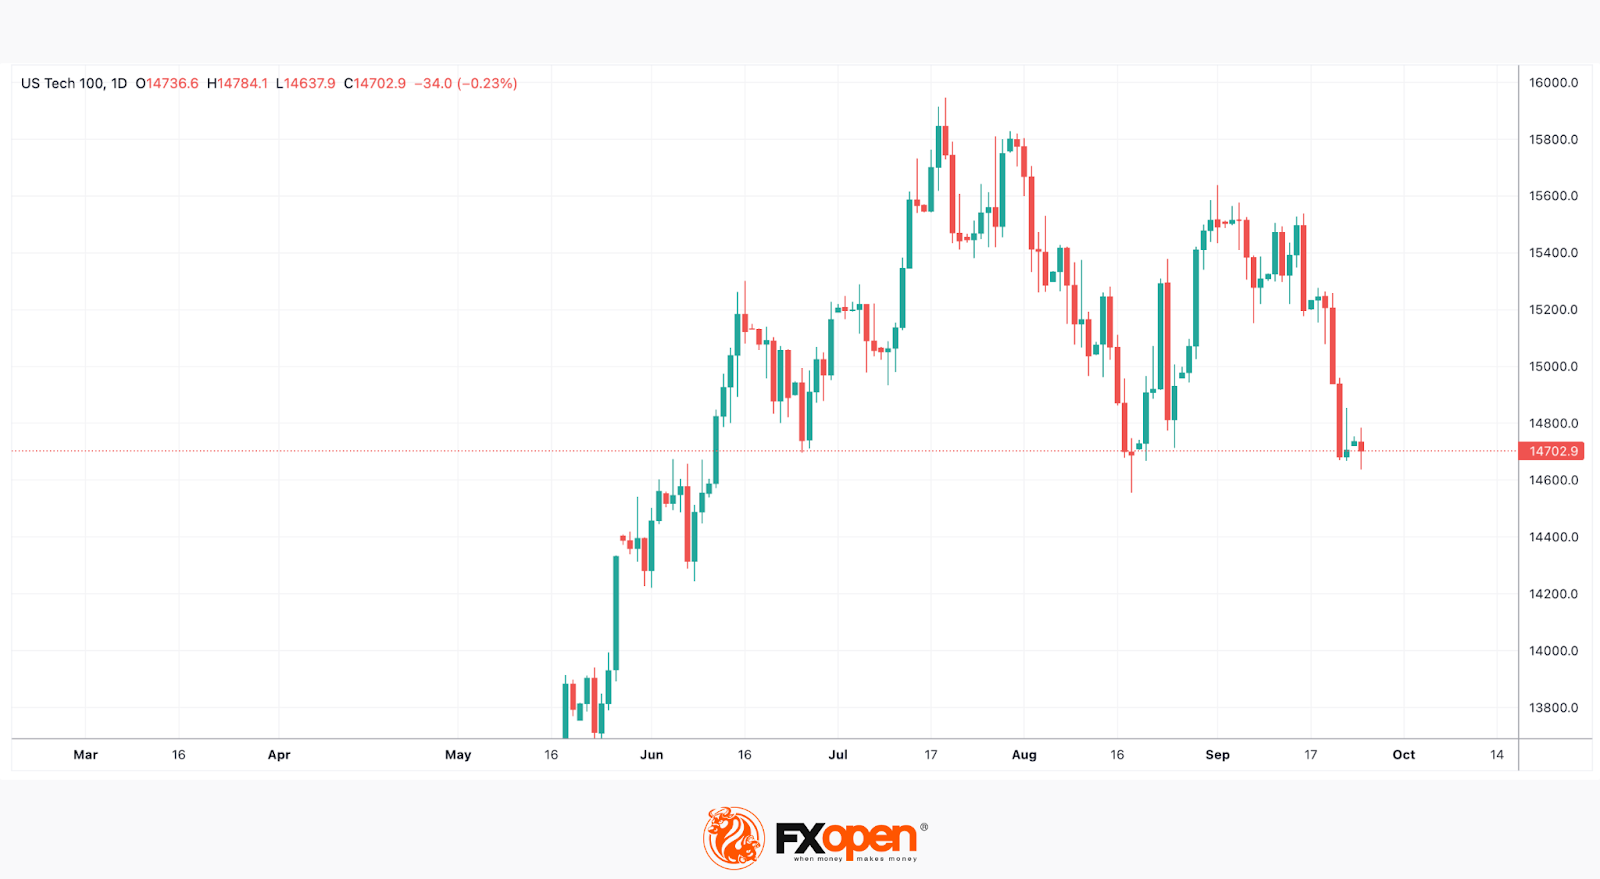
The US, Japan and the UK may have kept interest rates on hold last week, but with the Federal Reserve indicating that rates will stay higher for longer, there is turmoil in the equity markets. The NASDAQ 100 fell 500 points last week, and with weakness continuing into this morning's trading session, the volatility looks like it will continue throughout the week.
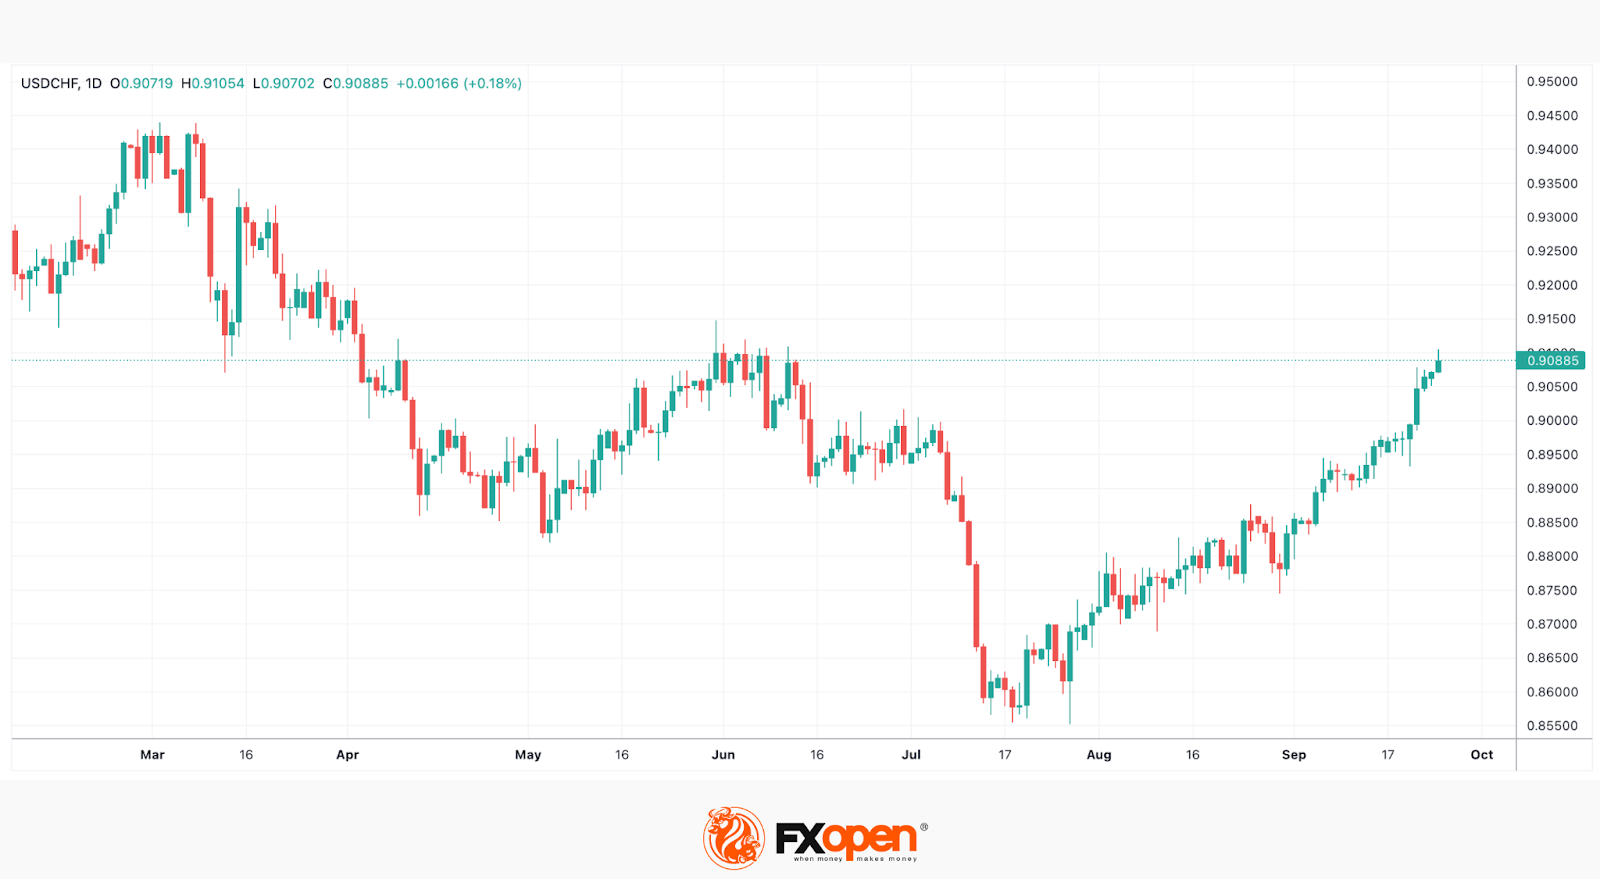
US durable goods orders (15:30 Wednesday) is the first meaningful economic release of the week. After a terrible -5.2% in July, analysts are expecting a modest decline of -0.4% for August. The final reading of US Q2 GDP is expected to show an increase to 2.2% when it is released on Thursday (15:30), as the US economy continues to tick over at a steady rate. This could give the US dollar a further boost.
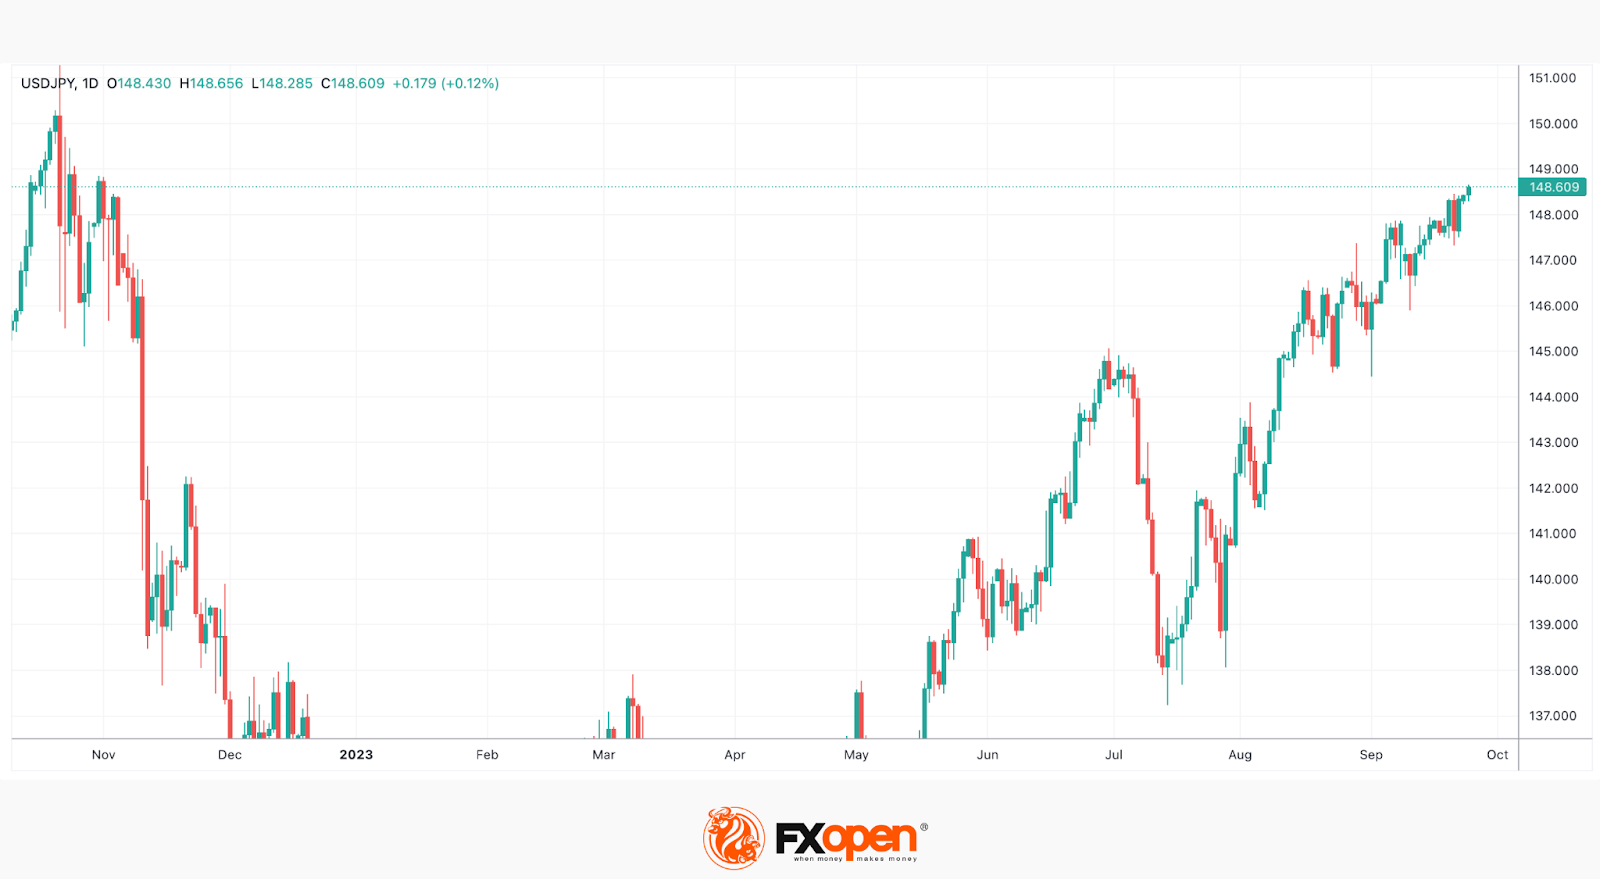
Friday brings two key inflation readings. Firstly, from the Euro Area (12:00) where the ECB will be hoping the analysts have got it right with their predictions of a further drop to 4.5%. At 15:30, the Core PCE Price Index (which is the Federal Reserve's preferred measure of inflation) is released. A 0.2% increase is expected for August, but anything above this could ramp up the rhetoric about more Fed hikes in the coming months and further appreciation of the US dollar.
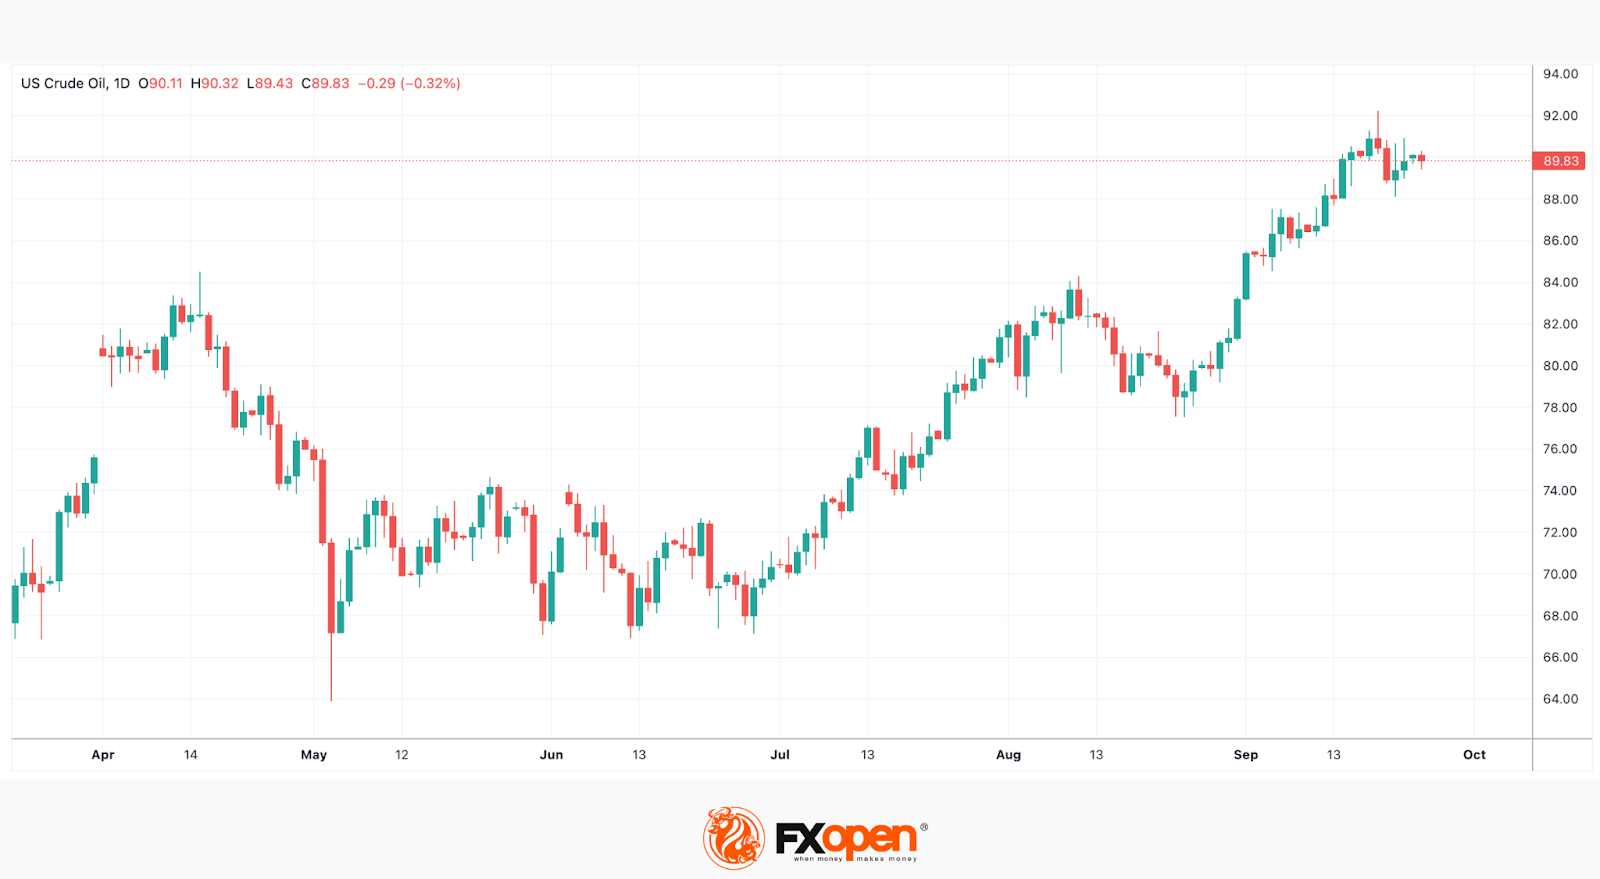
The oil markets continue to provide a fascinating mix of politics and market forces. Russia and Saudi continue with their supply restrictions whilst the biggest buyer, China, struggles with a stalling economy. Throw in the US trying to replenish the Strategic Petroleum Reserve, and the bulls are currently in the ascendancy, with WTI hitting $92 and Brent $95 before profit taking took the edge off the price. The medium-term trend is still positive, but with so many factors at play, the only guarantee is further volatility.
This article represents the opinion of the Companies operating under the FXOpen brand only. It is not to be construed as an offer, solicitation, or recommendation with respect to products and services provided by the Companies operating under the FXOpen brand, nor is it to be considered financial advice.
Stay ahead of the market!
Subscribe now to our mailing list and receive the latest market news and insights delivered directly to your inbox.


Latest articles
DAX 40: Can the Index Print Fresh Record Highs Once Again?
The DAX 40 has shed more than 2% over the past several sessions, breaking a rally that had pushed the index to record highs on the back of Germany's fiscal pivot toward defence, infrastructure and climate spending. The pullback raises

US Dollar Consolidates Ahead of FOMC Minutes Release
The US dollar has entered a period of consolidation following last week's sharp price swings, as market participants turn their attention to the release of the Federal Reserve's latest meeting minutes. Investors are looking for additional guidance on the future

EUR/USD Analysis: Who Is in Control?
Two central banks, two hawkish tones — but only one dollar just took a hit. The ECB delivered a 25bp hike in June, its first since 2023, lifting the deposit rate to 2.25% as Middle East-driven energy costs pushed headline