


FXOpen

Trendline breakouts play an important role in price chart analysis. However, not every break of a trendline carries the same weight. Some may signal genuine shifts, while others prove temporary. In this article, we will explore how to assess, confirm, and trade trendline breakouts while trying to keep risk under control.
Understanding Trendlines
Although you know what trendlines are, let’s briefly go over the subject. Trendlines are tools used in technical analysis to visualise the direction of price movements. Drawing accurate trendlines involves selecting the appropriate highs and lows to connect, so they provide a clear representation of the prevailing trend. According to the established rules, there should be at least two highs/lows to draw a strong trendline. The more points you connect, the more solid the line is supposed to be.
There are trendlines in forex, stock, commodity, index, and cryptocurrency* charts. Still, trendlines on charts of assets experiencing less price volatility may be more solid.
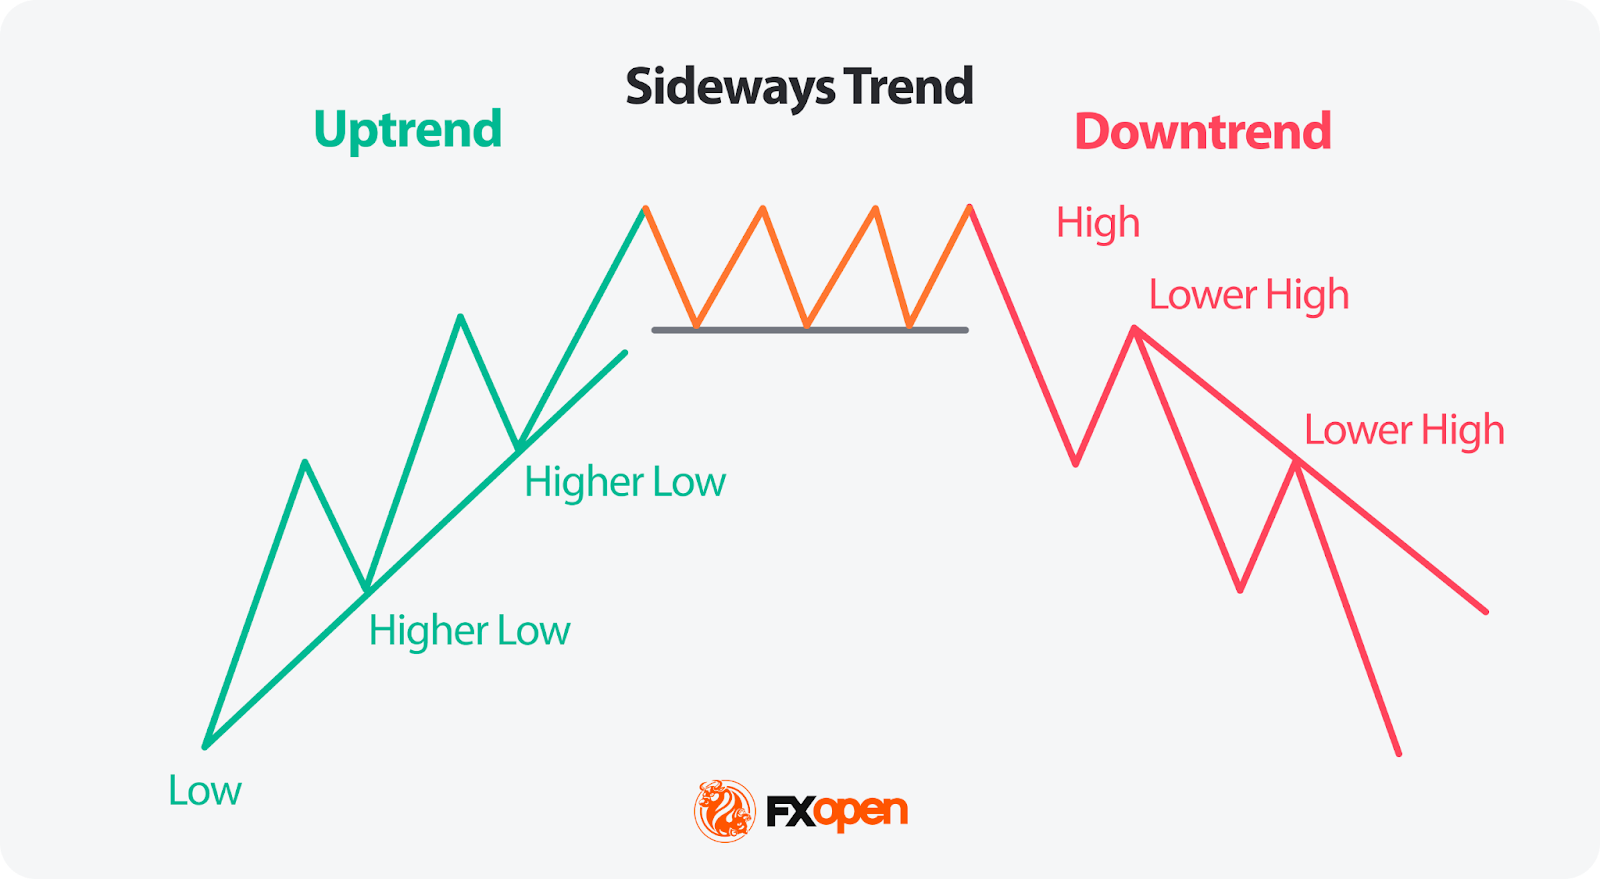
The three primary types of trendlines are:
1. Uptrend lines connect higher lows and act as support levels. They represent bullish market conditions.
2. Downtrend lines connect lower highs and serve as resistance levels. They depict bearish market conditions.
3. Sideways or Range-Bound lines connect comparable highs and lows, indicating a range-bound or consolidating market.
What Is a Trendline Breakout?
A trendline breakout occurs when the price moves decisively above or below a drawn trendline that has been acting as support or resistance. A breakout above a downward trendline may suggest growing bullish pressure, while a break below an upward trendline can point to weakening demand and possible bearish sentiment. Traders often view these moves as signals for potential entries or exits, but they typically confirm them with additional tools to reduce the risk of false signals.
Significance of Broken Trendlines
Broken trendlines can be applied across different trading styles and risk levels. Traders may use a variety of strategies based on trendline breaks to determine trends, confirm other analysis tools like indicators and chart patterns, and identify market sentiment.
Identification of Trend Reversals
Perhaps the main advantage of broken trendlines is their role in identifying potential trend reversals. When an established trendline is decisively broken, it often signifies a shift in market sentiment. This break indicates that the previous trend's momentum has weakened or reversed, which can be a vital turning point for traders.
In an uptrend, the break of an uptrend line can suggest a potential reversal to a downtrend, and conversely, the break of a downtrend line in a downtrend may signal a potential reversal to an uptrend. If the price breaks the sideways trendline, it usually reflects the end of consolidation and the formation of a new trend, either upward or downward.
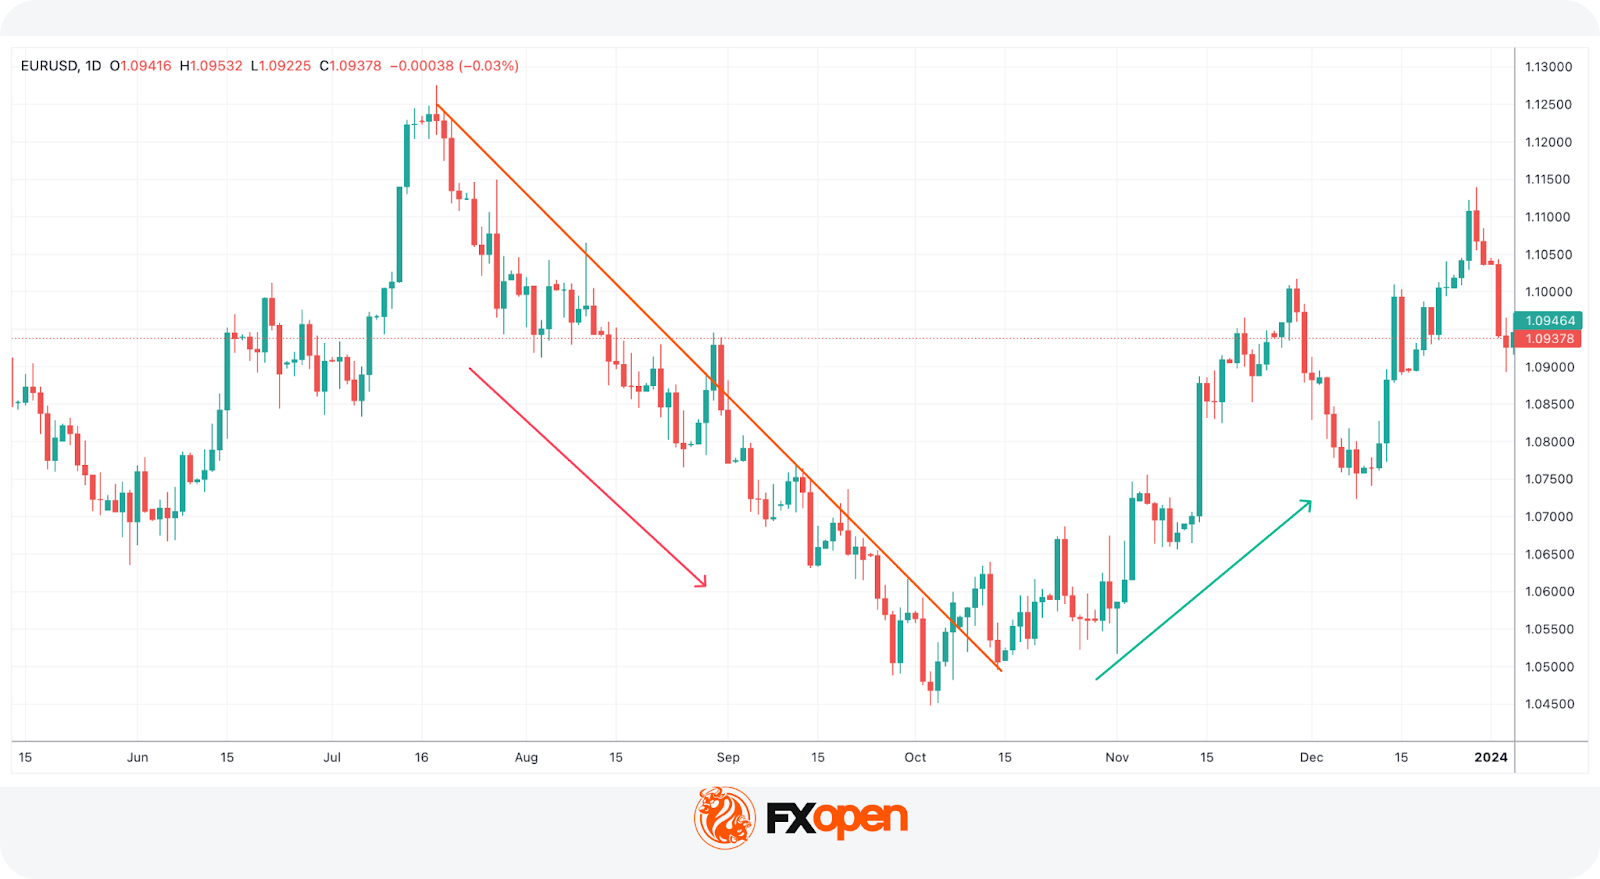
In the chart above, the price broke above the downward trendline, after which a new uptrend was formed.
Confirmation of Price Movements
Broken trendlines can act as confirmation signals for other technical analysis tools and patterns. For example, when a trendline break aligns with the formation of chart patterns like head and shoulders or double top and double bottom, it may reinforce the validity of these patterns and their associated price projections.
Market Sentiment
Broken trendlines can also provide insights into market sentiment and psychology. Traders' reactions to trendline breaks can reveal their beliefs and expectations regarding future price movements, which can impact market dynamics.
If you are ready to trade with trendlines and their breakouts, you may consider using the TickTrader trading platform that provides over 1,200 tools for technical analysis.
How May Traders Trade Trendline Breakouts?
One of the most popular ways to trade trendline breakouts is the break and retest approach. Rather than entering the moment price pierces a trendline, traders often wait for confirmation that the breakout will hold.
After the initial break above a downtrend line or below an uptrend line, price will frequently pull back to retest the line. This retest acts as a validation point: what was once resistance may turn into support, or former support may become resistance.
When the retest holds and price rejects the level, it suggests that market sentiment has shifted in line with the breakout. Traders may then look for entry signals, such as bullish or bearish candlestick patterns, and confirm with momentum indicators on a lower timeframe to enter their position. Stops could be placed just beyond the retest level once considered confirmed.
Example
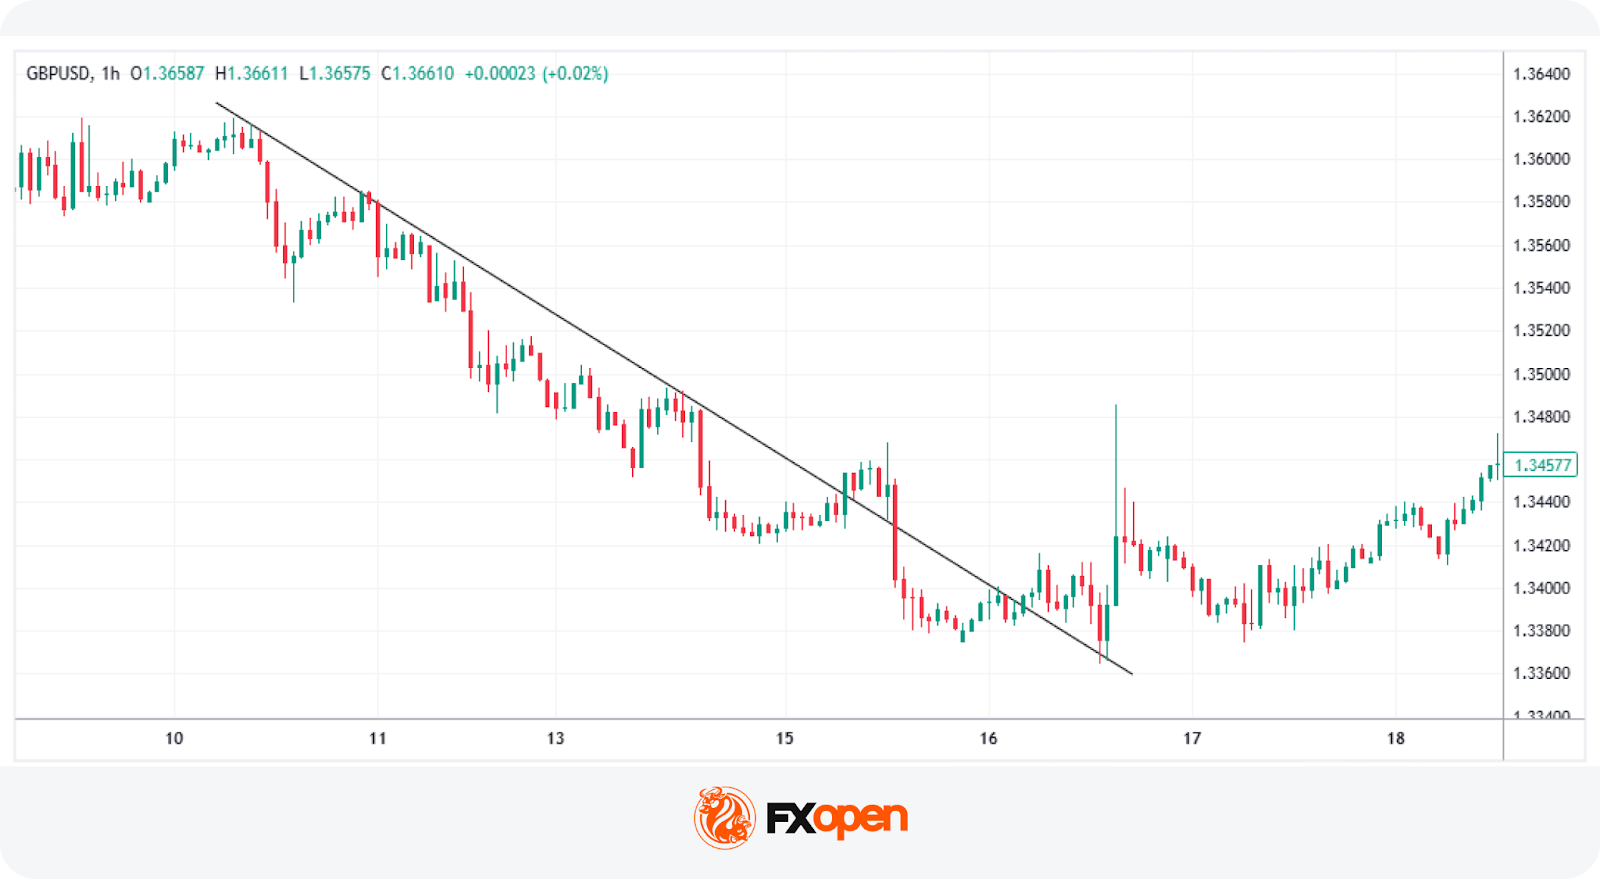
In the example above, GBP/USD is observed on the hourly chart in a multi-day downward trend contained by a bearish trendline.
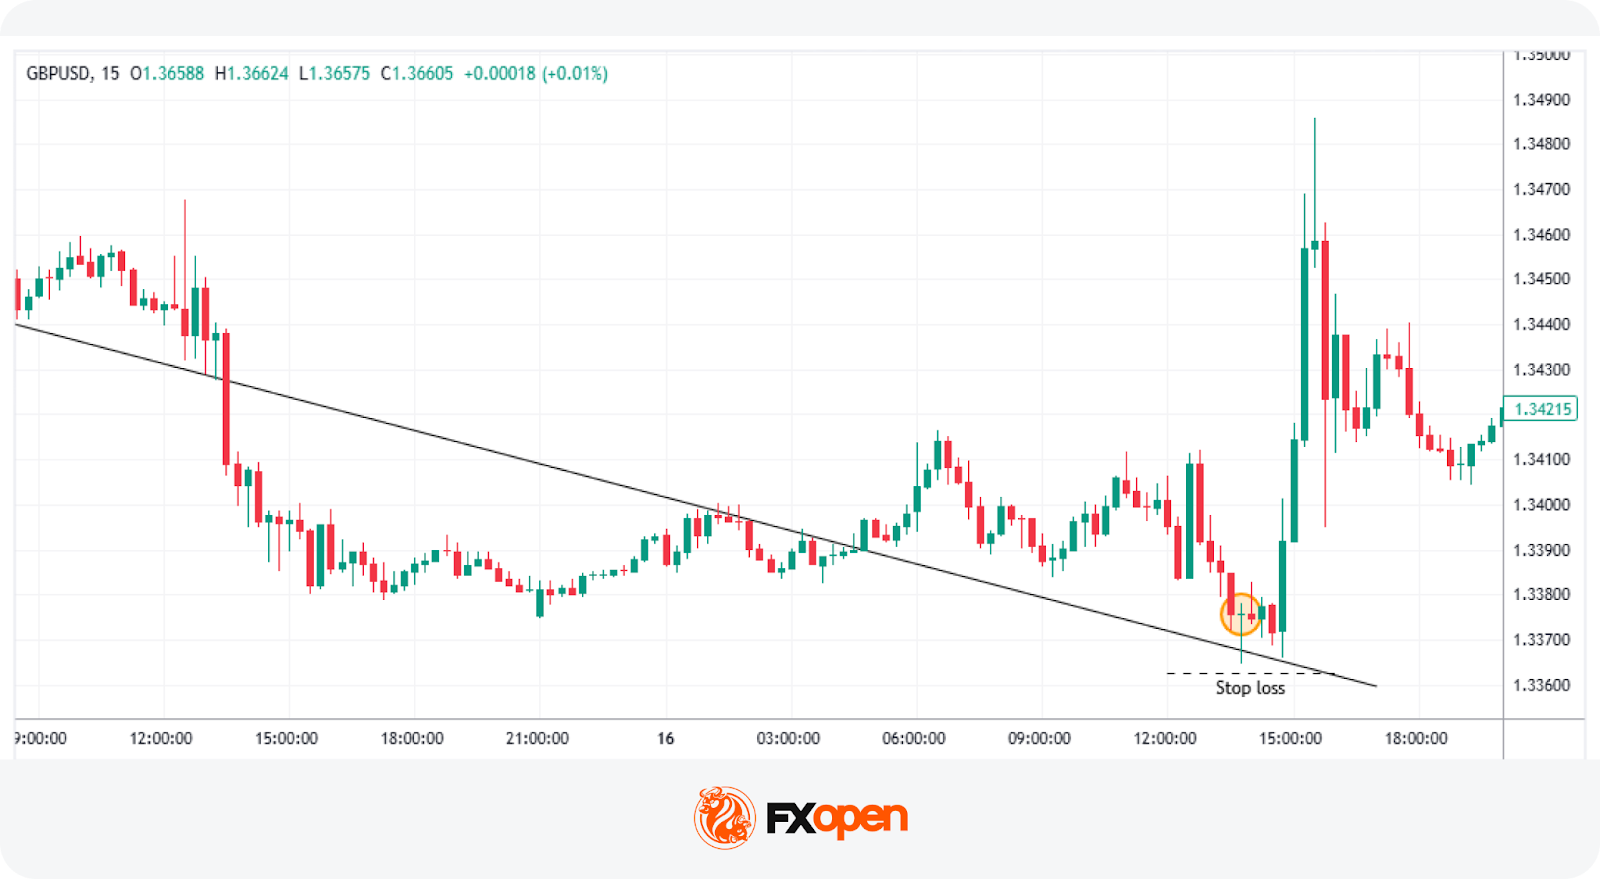
While the first breakout and retest fails on this 15-minute chart, the second produces a strong reaction. A trader could observe the test of the trendline that now acts as support, where a bullish pin bar forms and offers an entry. A stop loss could be set below the pattern and the trendline.
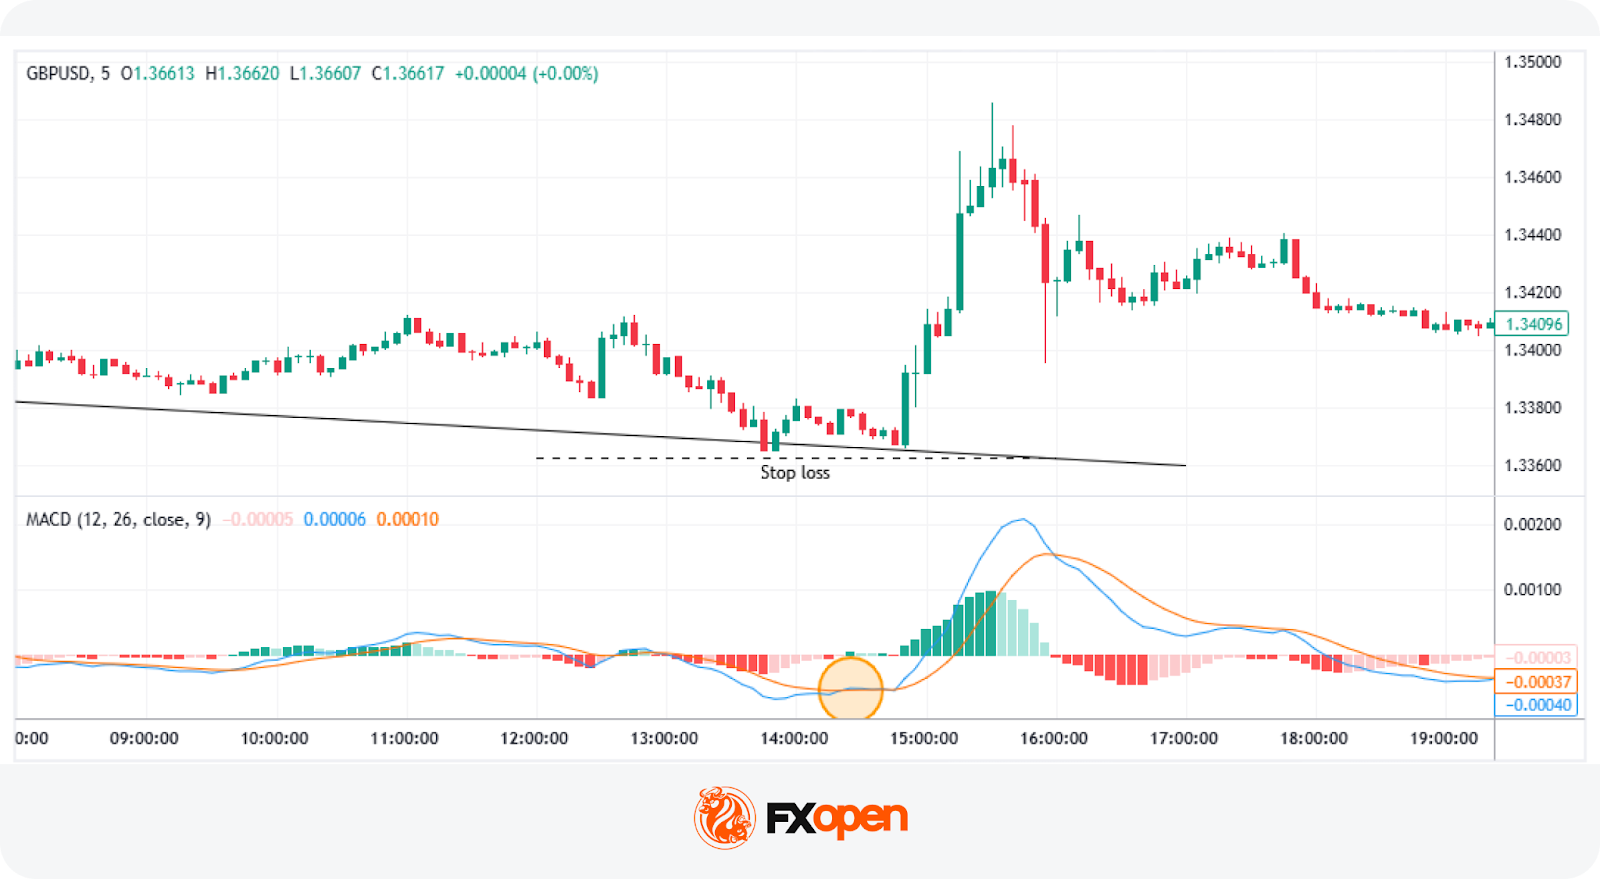
If a trader had chosen to be more conservative, the 5-minute chart would have shown a MACD crossover that confirmed the pin bar and added additional confluence.
False Trendline Breakouts
A false trendline breakout, also known as a fakeout or failed breakout, occurs when the price of an asset breaks a trendline but then reverses direction, often moving back within the trendline's boundaries. False breakouts can mislead traders and result in losses for those who initiate trades based on the initial breakout signal.
Here's a breakdown of the key characteristics of a false trendline breakout:
- Initial Breakout. Initially, the price of the asset appears to break above or below a trendline. This break may even be accompanied by increased trading volume, which can provide confirmation of the breakout.
- Traders' Reactions. Many traders may interpret the breakout as a significant move and initiate trades in that direction. For example, if a downtrend line is seemingly broken to the upside, traders may start buying, expecting a trend reversal.
- Reversal. However, instead of continuing in the direction of the breakout, the price reverses course and moves back within the boundaries of the trendline. This reversal negates the initial breakout signal and can catch traders off guard.
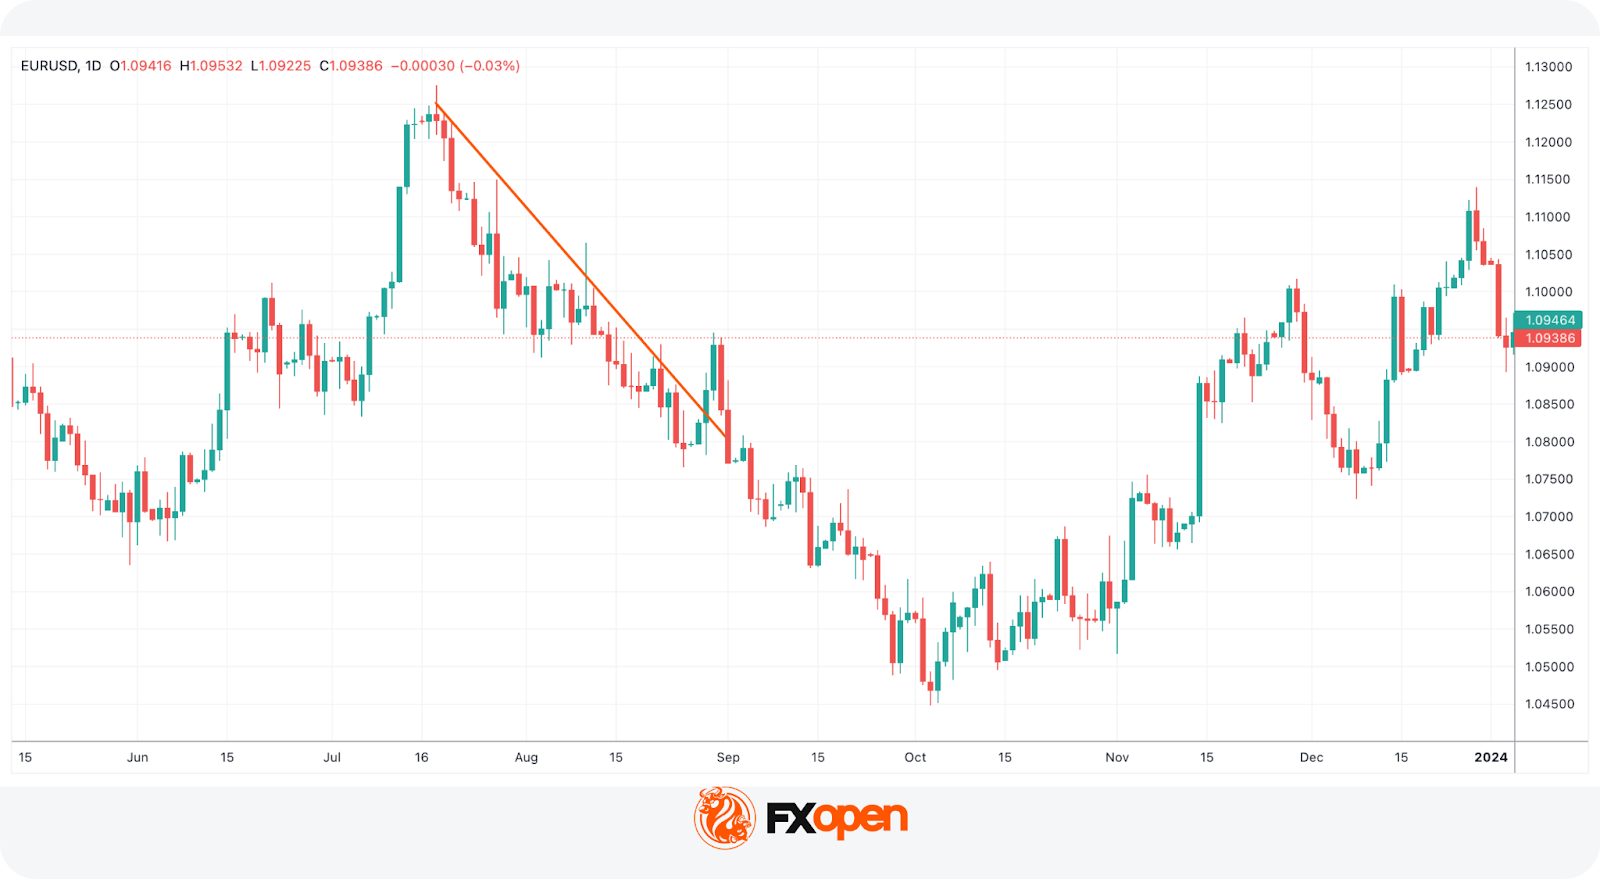
Look at the chart above. The price broke above the falling trendline, but the uptrend didn’t form, so the downtrend resumed.
There are several reasons for false trendline breakouts, including:
- Market Manipulation: In some cases, market participants with substantial resources may deliberately manipulate prices to trigger breakouts and then reverse the market's direction to take advantage of the price swings.
- Lack of Confirmation: Fakeouts often occur when there is a lack of confirmation from other technical indicators or factors. Therefore, experienced traders look for multiple signals aligning to increase the validity of a breakout.
- Whipsawing Markets: In volatile or indecisive markets, prices can frequently whipsaw above and below trendlines, making it challenging to distinguish between genuine and fakeouts.
Factors to Consider When Trading Trendlines
While it's impossible to completely eliminate the risk of falling victim to false trendline breakouts, traders often use additional technical analysis tools and confirmation signals. These may include waiting for reversal signals from other indicators, monitoring price action after the breakout, and setting stop-loss orders to potentially reduce losses in case of a reversal.
Confirmation Signals
Confirmation signals can come from various technical indicators and patterns, including but not limited to:
- Candlestick Patterns. Traders look for candlestick patterns that support the direction of the breakout, such as bullish engulfing patterns for an upside breakout and bearish engulfing patterns for a downside breakout.
- Oscillators. Oscillators like the Relative Strength Index (RSI) or the Stochastic can provide overbought or oversold conditions, which may help traders confirm the strength of the move.
- Chart Patterns. Aside from candlestick patterns, chart formations, such as flags, triangles, or pennants, that coincide with the trendline break may provide additional confirmation.
Volume Analysis
Analysing trading volume is a crucial component of evaluating broken trendlines. Volume can provide insights into the significance of the breakout and whether it is more likely to be genuine or a false signal.
When a breakout occurs alongside higher volume, it shows that traders are actively supporting the move, which can lead to a more sustained trend.
Conversely, a breakout with decreasing volume may be less reliable, as it indicates a lack of enthusiasm among traders and raises the possibility of a false breakout.
Timeframes
Considering multiple timeframes may be helpful when trading broken trendlines. Different periods may provide different perspectives on the trendline break, and using a combination of them may support traders when making decisions. Here's how traders approach timeframes:
- Higher Timeframes. They start by analysing higher timeframes (e.g., daily or weekly) to identify the primary trend direction. This provides context for the trendline break observed on shorter timeframes.
- Lower Timeframes. Market participants use lower timeframes (e.g., hourly or 15-minute charts) for entry and exit points.
- Confluence. Traders seek confluence between different timeframes. When a trendline break aligns with a breakout on higher timeframes, it adds strength to the trade signal.
Support and Resistance Levels
When trading broken trendlines, it's crucial to consider nearby support and resistance levels. These levels can influence price movements and provide valuable context for trade management.
Fibonacci Retracement and Extension Tools
Fibonacci retracement and extension levels can complement trendline analysis. If the price breaks the Fibo level after a trendline breakout, this may confirm the strength of the newly forming trend.
Risk Management and Position Sizing for Trendline Trading
Risk management is paramount when trading trendline breakouts. The following techniques are typically used when managing risks:
- Setting Stop Losses. Setting appropriate stop-loss orders is a crucial component of risk management strategies.
- Proper Position Sizing. Position sizing is a critical aspect of risk management, especially when trading trendline breakouts. It determines the amount of capital allocated to each trade and may help control exposure to potential losses.
- Risk-Reward Ratios. Risk-reward ratios are commonly used for assessing the potential outcome of a trade relative to the risk involved.
Common Mistakes to Avoid when Trading Trendline Breakouts
Common mistakes when trading trendline breakouts include making decisions based on insufficient confirmation signals, ignoring fundamental factors, and being guided by emotions. By implementing a disciplined approach and being aware of these pitfalls, traders may increase their chances of making informed trading decisions.
Ignoring Confirmation Signals
One of the most common mistakes traders make when trading trendline breakouts is ignoring confirmation signals. Relying solely on the trendline break itself can lead to premature or misguided trades.
Overlooking Fundamentals
While technical analysis plays a significant role in trading trendline breakouts, overlooking fundamental factors can be a costly mistake. Traders consider the broader market context and macroeconomic factors that may impact the assets they trade. Fundamental events like economic releases, earnings reports, or geopolitical developments can influence market sentiment and override technical signals.
Emotional Trading
Emotional trading is a common pitfall for traders, and it becomes particularly pronounced when trading trendline breakouts. Emotions such as fear and greed can lead to impulsive decisions and erode trading discipline.
Final Thoughts
A trendline breakout can mark an important point on the price chart, but it should be weighed against other factors before taking action. When combined with confirmation techniques and strict risk management, trendline analysis becomes a useful tool in navigating changing market conditions.
If you have a trendline strategy, you may consider opening an FXOpen account with low commissions and tight spreads. Good luck!
FAQ
How to Draw a Breakout Trendline?
To draw a breakout trendline, traders first identify at least two significant swing highs or swing lows on a chart. For an uptrend, a trendline is drawn by connecting the rising lows, while in a downtrend, it is drawn by connecting the falling highs. The line should touch as many points as possible without forcing the fit. Once the trendline is in place, traders watch for the price to move decisively above it in a downtrend or below it in an uptrend. A clear break beyond the line, often supported by higher volume or a retest of the level, can indicate a potential breakout.
How May Traders Confirm Trendline Breakouts?
One common approach to confirm trendline breakouts is to check trading volume—an increase in volume during the breakout often signals stronger market participation. Another method is waiting for the price to retest the broken trendline but still hold above or below it, which can reinforce the validity of the move. Many traders also use technical indicators, such as moving averages, RSI, or MACD, to confirm momentum in the direction of the breakout.
*Important: At FXOpen UK, Cryptocurrency trading via CFDs is only available to our Professional clients. They are not available for trading by Retail clients. To find out more information about how this may affect you, please get in touch with our team.
This article represents the opinion of the Companies operating under the FXOpen brand only. It is not to be construed as an offer, solicitation, or recommendation with respect to products and services provided by the Companies operating under the FXOpen brand, nor is it to be considered financial advice.
Stay ahead of the market!
Subscribe now to our mailing list and receive the latest market news and insights delivered directly to your inbox.


Latest articles

Dollar Index (DXY) Hits Yearly High
Today, the dollar index rose above last week’s peak around the 99.68 level, setting a new high for 2026. This movement is supported by a tense fundamental backdrop:
→ Inflationary pressures from rising oil prices. Markets may be pricing

WTI Oil Price Rises Above $100
Another shocking Monday for the energy market. Last week’s start was remembered for a bullish gap of more than 10% (which was later followed by a pullback), but today’s market open proved even more volatile (as reflected by

Market Analysis: AUD/USD and NZD/USD Struggle as Market Jitters Shake Risk Sentiment
AUD/USD failed to stay in a positive zone and declined below 0.7000. NZD/USD is also moving lower and might extend losses below 0.5850.
Important Takeaways for AUD/USD and NZD/USD Analysis Today
· The Aussie Dollar