


How To Trade the Shark Harmonic Pattern
FXOpen
Discovered by renowned trader Scott Carney in 2011, the Shark harmonic pattern is a relatively new addition to the world of technical analysis. But don't let that deter you – the Shark is an effective tool that can help traders predict future market reversals. In this article, we’ll take a deep dive into the world of the Shark pattern, the steps you need to identify it, and how to trade it.
What Is the Shark Harmonic Pattern?
The Shark pattern is a harmonic pattern used to predict potential reversal points in the markets. It’s a relatively new pattern, discovered by Scott Carney in 2011, and is a variation of the more common Gartley, Bat, and Butterfly patterns. It’s also a key component of the 5-0 harmonic pattern.
The structure itself is made up of five distinct swing points and four legs. While other patterns typically use X, A, B, C, and D to identify the points, Scott opted to use O, X, A, B, and C to mark them. This means that traders look to enter at C rather than D.

As with all harmonic patterns, the Shark requires that specific Fibonacci ratios must be met to be considered valid to trade. However, the Shark is unique in that it uses the 88.6% and 113% ratios to identify potential reversal points.
Many traders, including Scott himself, believe that the Shark precedes sharp price movements that can be easily missed. This means that trading the Shark pattern requires a more active approach to have the best chances of success, making it well-suited to day traders.
Identifying the Shark Pattern
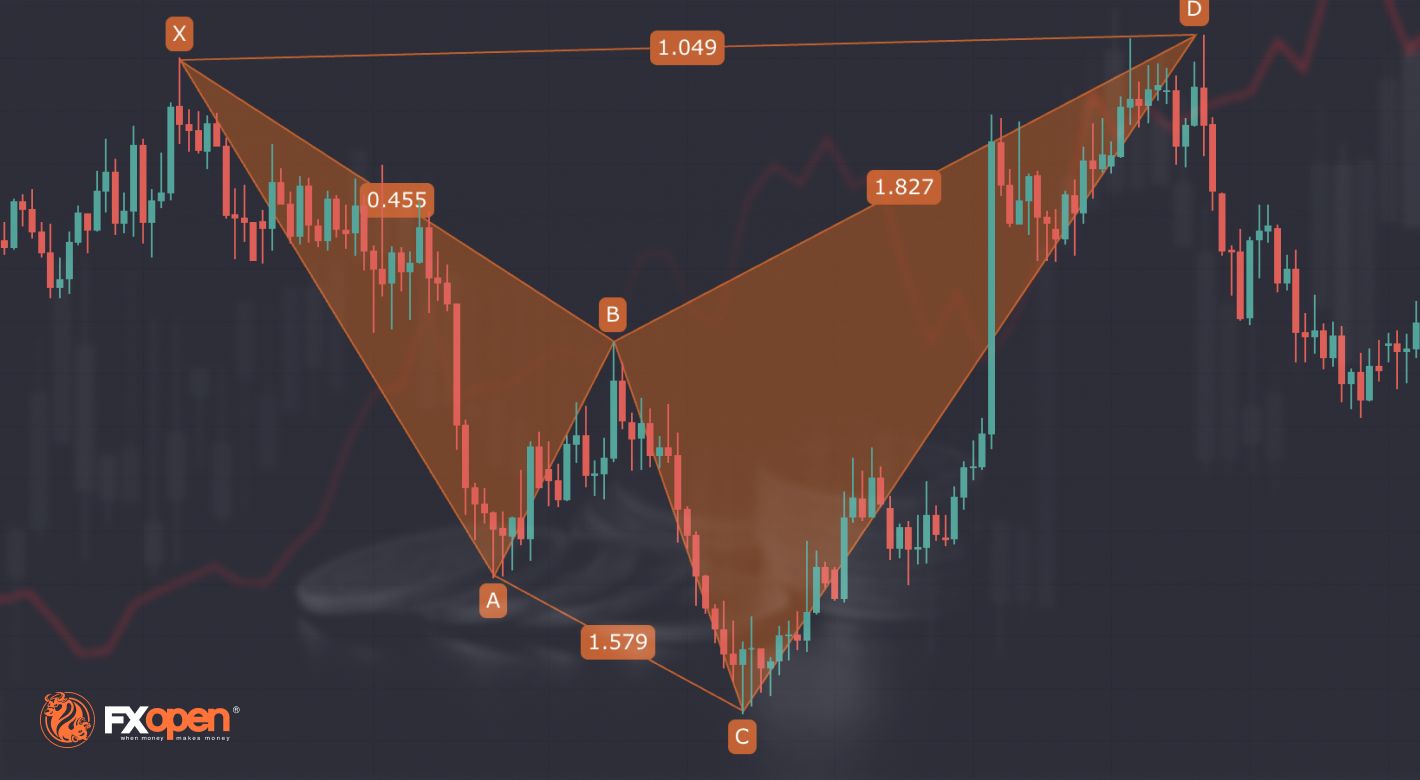
As mentioned, the pattern features five key swing points (O, X, A, B, and C) connected by four legs (OX, XA, AB, BC). Specifically, OX is an impulsive leg, and XA is a retracement. AB then moves beyond X with another impulse, sometimes appearing as a double top or bottom, before BC retraces near O to create the entry point, C.
The following Fibonacci ratios must also be present:
- The AB leg extends XA by 113% to 161.8%.
- The BC leg extends AB by 161.8% to 224%.
- The BC leg extends OX by 88.6% to 113%.
Additionally, A can retrace anywhere between O and X but can’t move beyond O.
Like other harmonic patterns, it’s best practice to use your judgement when applying these ratios to live charts. You might find that a pattern extends slightly beyond the specified rules, like 163% instead of 161.8%. If the other ratios are within the boundaries and you think the direction is correct, as determined by other technical analysis tools, then don’t let that deter you from considering an entry.
Bullish and Bearish Shark Pattern Rules
The pattern itself doesn’t change whether the projected direction is bullish or bearish, so you can apply the same rules above for both. The only real difference is that the formation is flipped horizontally.
For a bullish Shark, price will appear to make a higher high with the AB leg above X and usually follows a larger downtrend. Bearish Sharks are the opposite: the AB leg will make a lower low beneath X and is typically part of a more significant uptrend.
Drawing the Shark Pattern
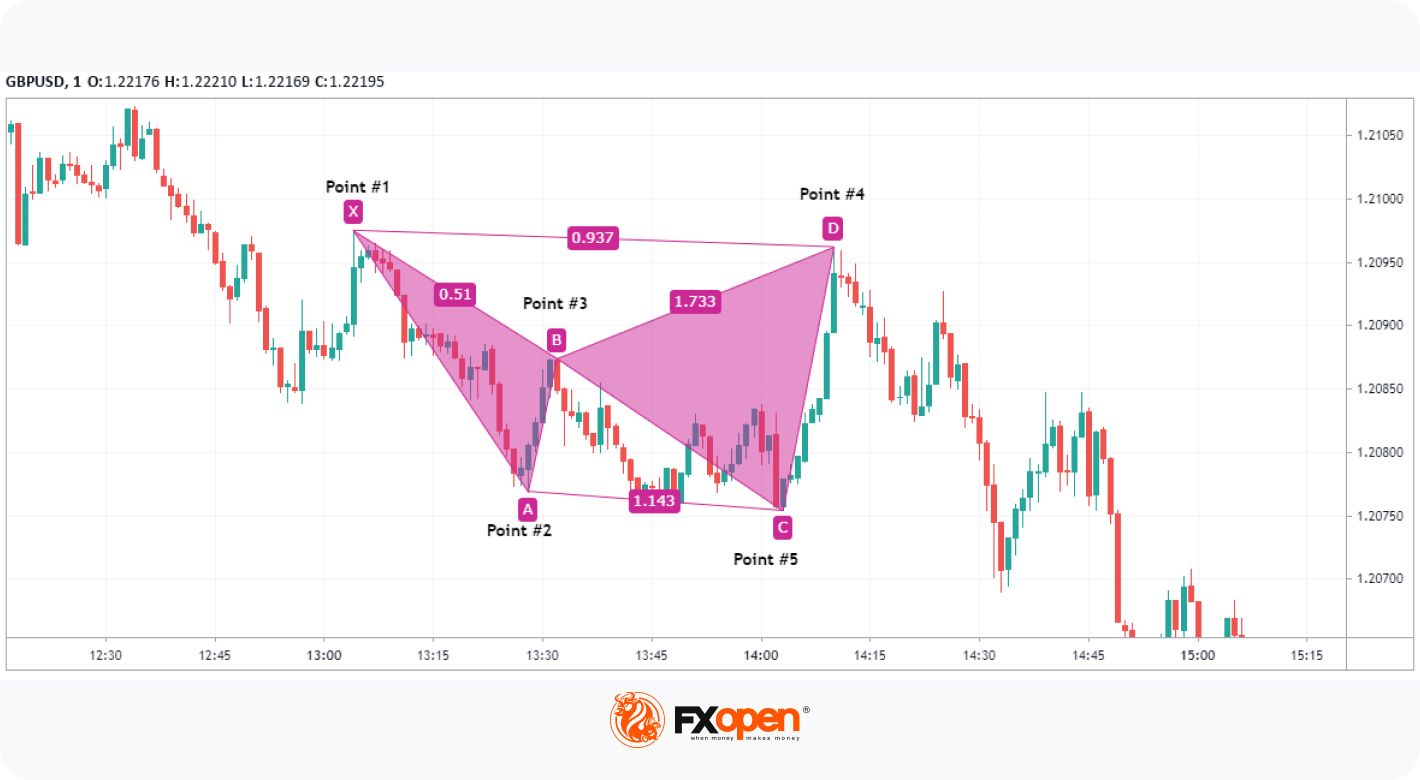
To better understand the Shark, you can try your hand at drawing the pattern using this guide. You can follow along with the TickTrader platform offered by us at FXOpen, which we’ve used to draw the diagrams in this article. You’ll need to use the XABCD drawing tool, found in the sidebar. Just remember that X is actually O, A is X, and so on.
- Select the XABCD drawing tool, found under ‘Patterns’.
- Identify the starting swing point, X.
- Plot the corresponding A, B, and C points, making sure the ratios align with the rules.
- Set D at 88.6% and adjust as price moves into the area.
It’s important to note that the ratios using the tool will appear as numbers rather than percentages. You can multiply the number by 100 to get the percentage, e.g., 0.886 = 88.6% or 1.618 = 161.8%.
Trading the Shark Pattern
Now that we know how to identify and draw the Shark, let’s look at how to trade it. You can apply the Shark pattern to forex trading or whichever asset you prefer to trade on any timeframe.
Entry
If a prospective Shark is forming, traders will often either set a limit order or wait for confirmation and enter with a market order. Since C will fall between 88.6% and 113%, you could place a limit order at either point. Alternatively, you might prefer to wait for a confirmation candle (e.g., a bearish reversal candle, like a shooting star) to close before using a market order to make an entry. If you use additional indicators, like RSI or MACD, you could also look for confirmation with these tools, such as a MACD crossover.
Stop Loss
You can set a stop loss just above (bearish Shark) or below (bullish Shark) the projected 113% mark. Or, you can pick a suitable figure, like 115%, as the point at which the setup is invalid and set a stop above or below this level.
Take Profit
Many traders begin to take profits at the 50% or 61.8% retracement of the BC leg. Beyond that, taking profits at X or B is also common, while some look to close their position at a 1.618 extension of the BC leg.
Bullish Shark Harmonic Pattern Example
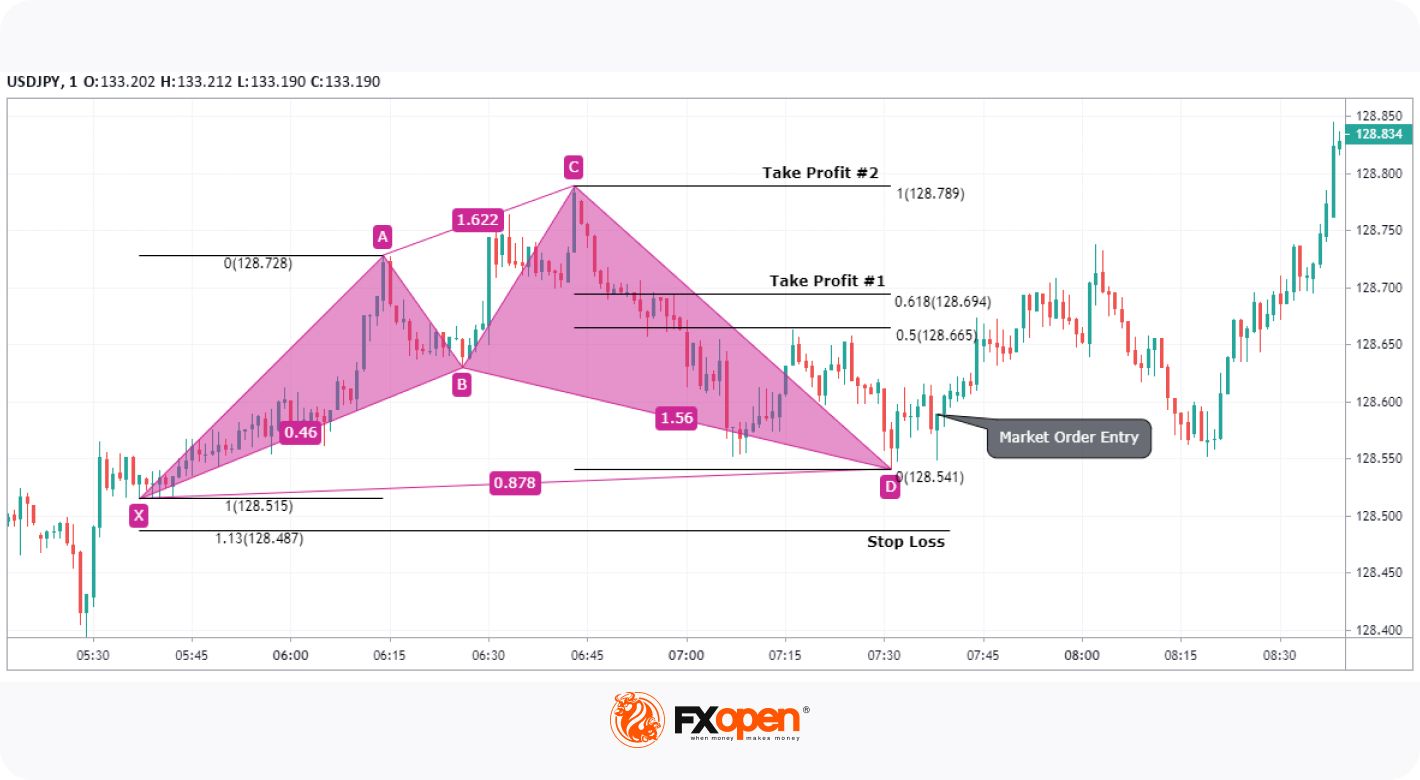
In this example, we see why allowing a little bit of flexibility with the ratios can be a good thing. The AB leg (BC on the chart) extended OX (XA here) by 1.622, almost a perfect 1.618 extension. Traders could’ve set a limit order at the 0.878 ratio.
You could’ve entered with a market order, given the long wick at C (D in the example), indicating a potential reversal, but price may have fallen further, potentially beyond the 1.13 level. Instead, waiting for another confirmation candle, like the hammer candlestick marked as ‘Market Order Entry’, gives us confidence that the pattern is playing out. We can then enter as the candle closes with a stop loss below the 1.13 extension of OX (XA in the example).
From there, you might prefer to start taking profits at the 0.618 level, given how close the entry was to the 0.5 level. You could then choose to close the trade at B (C on the chart) or take partial profits and trail your stop below swing lows that form along the way.
Bearish Shark Harmonic Pattern Example
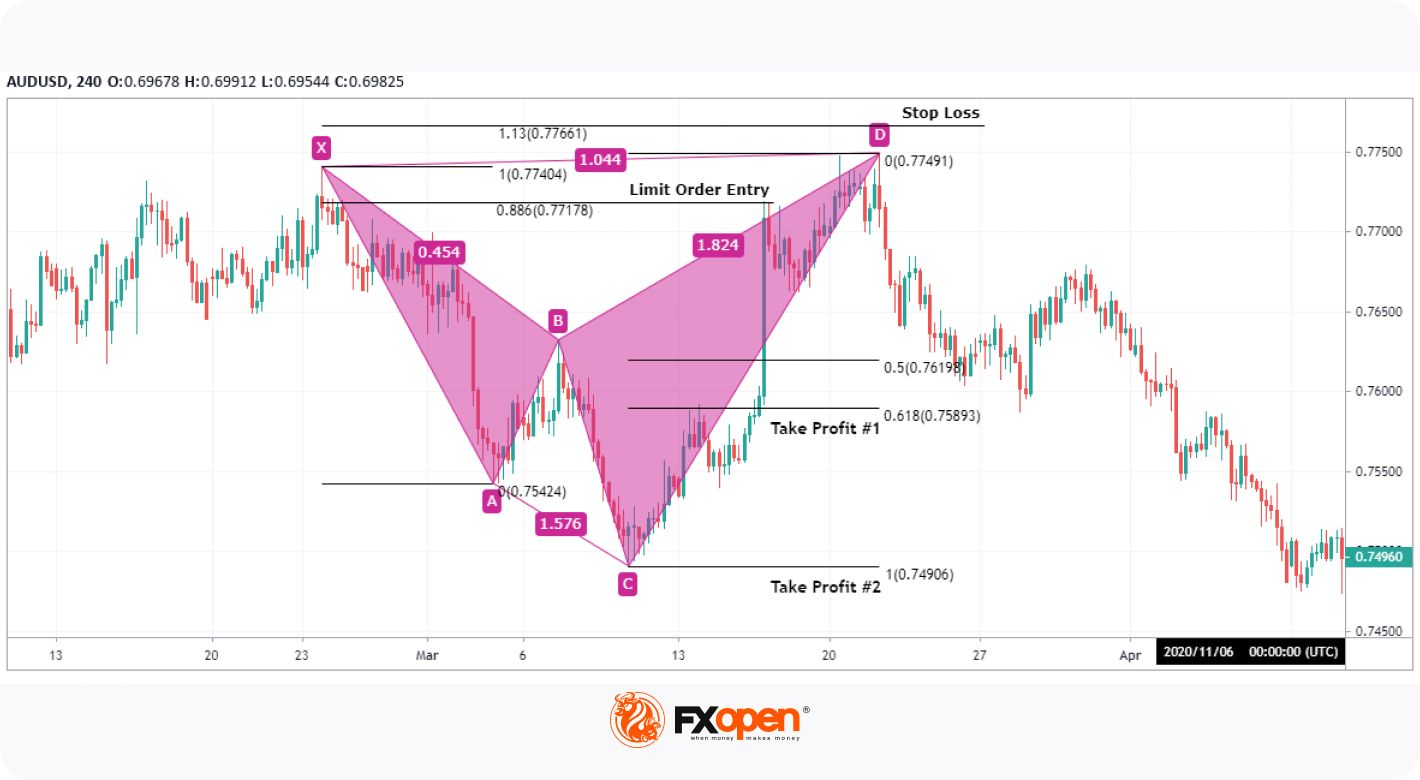
In this scenario, traders could’ve set a limit order at 0.886 and a stop loss above 1.13. Price did come slightly higher and offered two candles that closed with long wicks, giving traders looking for confirmation an opportunity to enter.
Notice that the bearish move that followed retraced almost perfectly to the 0.618 level before pulling back slightly. Price then continued to trend lower, hitting the second target. As with each of the examples shown, this trade demonstrates how good Sharks can be at offering effective entries before a significant reversal occurs.
Where To Go From Here
By now, you should have a comprehensive understanding of how to use the Shark pattern when trading. If you’re wondering what your next steps should be, try following this list:
- Use live charts to practise identifying Sharks. You can use the free TickTrader platform to help with this. Over time, you’ll be able to train your eyes to spot Sharks easily.
- Backtest a few Shark setups, working out where you would’ve entered, where you would’ve taken profits, and how you would manage your risk.
- Create a strategy using Sharks. You could incorporate them into an existing strategy or use other technical analysis tools, like trendlines, indicators, or candlestick patterns, to develop your own system.
- Once you feel ready, you can open an FXOpen account and put your skills to the test.
- Read up on other harmonic patterns and expand your knowledge. Learning about related patterns, like the Bat, Crab, or 5-0, can help you identify entries if the Shark isn’t forming as expected.
This article represents the opinion of the Companies operating under the FXOpen brand only. It is not to be construed as an offer, solicitation, or recommendation with respect to products and services provided by the Companies operating under the FXOpen brand, nor is it to be considered financial advice.
Stay ahead of the market!
Subscribe now to our mailing list and receive the latest market news and insights delivered directly to your inbox.


Latest articles

AI Valuations Are Back in the Spotlight
Artificial intelligence remains the dominant investment theme of 2026, but investors are increasingly questioning whether AI stock valuations are keeping pace with reality.
💰 Big Tech continues to invest at an unprecedented scale, with hyperscaler AI spending projected to exceed $800

AUD/CAD: Months of Indecision — Is a Breakout Finally Coming?
The Australian dollar has clawed back most of its end-of-June losses, when it touched three-month lows against the greenback amid escalating Middle East tensions. Since then, sentiment has improved: the RBA's Assistant Governor Sarah Hunter signalled the board stands ready

USD/JPY: Battling at the Top of the Triangle
On 3 July, Japan's Finance Minister, Satsuki Katayama, stated that the Ministry of Finance remains in close contact with US authorities regarding developments in USD/JPY as the yen traded near its weakest level in almost 40 years. Similar verbal