


FXOpen
Price charts contain patterns that reflect the collective sentiment and momentum of the market. For traders, these patterns offer a framework for making data-driven decisions. This article explores the most recognisable forex chart patterns, their technical significance, and methods to incorporate them into a disciplined trading strategy.
What Are the Chart Patterns?
Chart patterns are visual formations on a price chart that illustrate how market supply and demand interact over time. They represent the collective behaviour of traders and reflect key phases of accumulation, distribution, and trend continuation or reversal.
Patterns are used to anticipate potential future price movements based on historical market behaviour. These formations can be broadly divided into three categories:
- Continuation patterns, such as flags, pennants, and triangles, which suggest that the existing trend is likely to resume.
- Reversal patterns, including head and shoulders, double tops, and double bottoms, which may indicate a shift in trend direction.
- Bilateral patterns, like symmetrical triangles, which can lead to a breakout in either direction.
While chart patterns provide valuable insights into market psychology and momentum, they are usually confirmed with technical indicators, trend analysis, and risk management principles.
Triangles
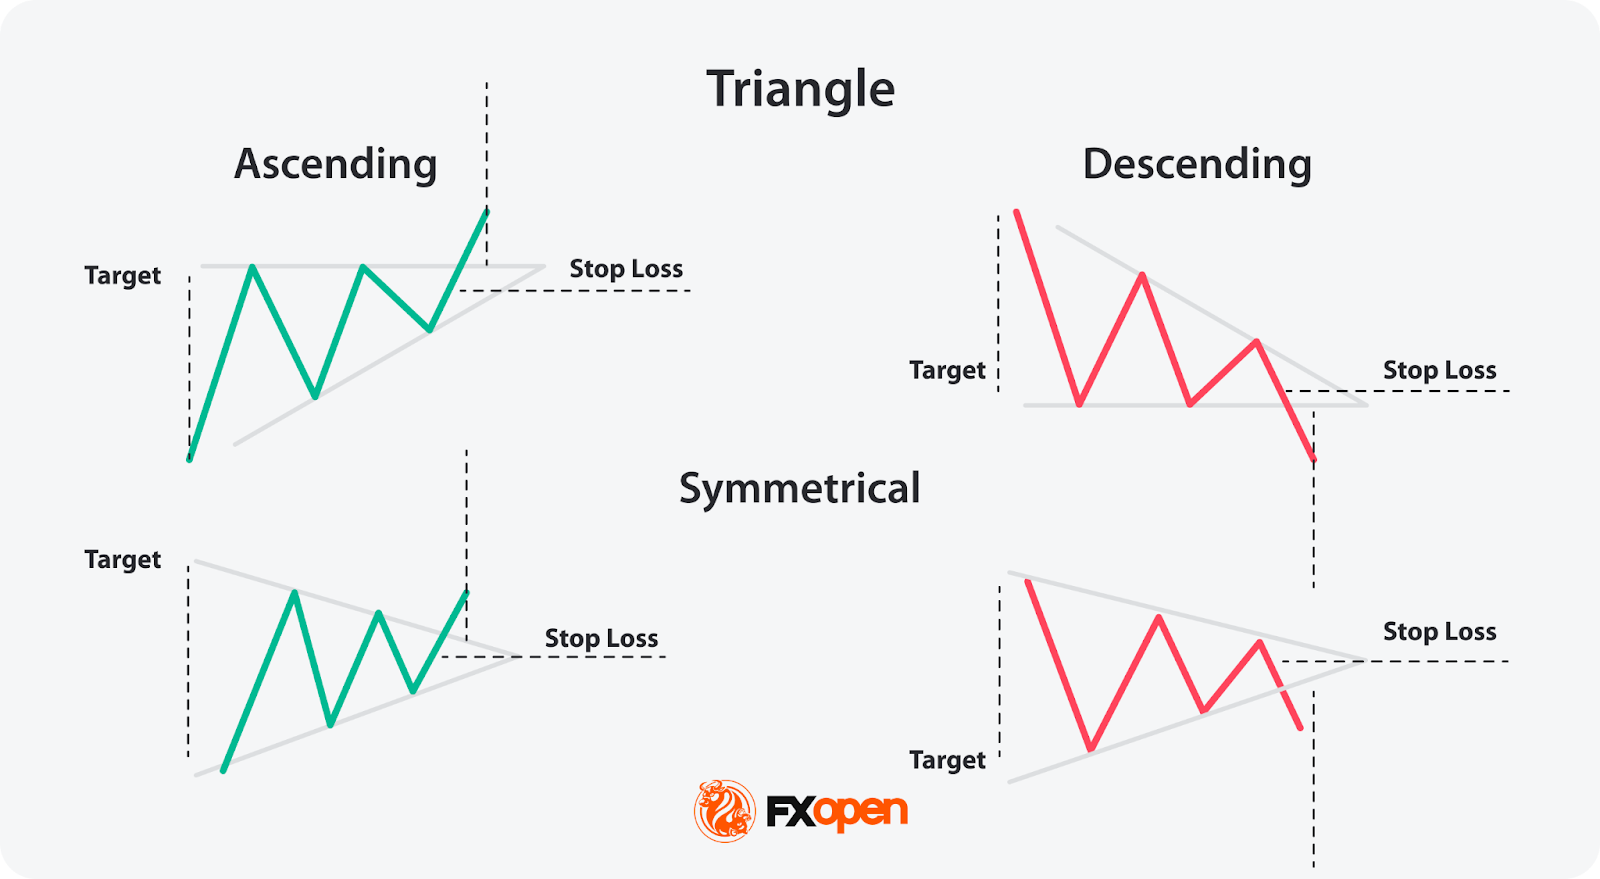
Ascending and descending triangles are common forex chart patterns that form during an uptrend and downtrend, respectively. Both are trend continuation chart patterns. There is also a symmetrical triangle, a neutral formation suggesting an imminent price breakout in either direction.
Ascending/Descending Triangle
The ascending/descending triangle consists of a horizontal line (resistance/support) and an ascending/descending line (support/resistance) that converge to create a triangle pattern. These patterns indicate that the price is likely to break to the upside or downside, respectively.
- Entry: Traders might enter a long/short position when the price breaks above/below the resistance/support level. This breakout is seen as a signal of further bullish/bearish momentum.
- Take Profit (TP): The profit target might be estimated by measuring the height of the triangle, the widest part of the formation, and adding/subtracting that value to/from the breakout point.
- Stop Loss (SL): A stop-loss order might be placed slightly below/above the ascending/descending support/resistance line.
Symmetrical Triangle
The symmetrical triangle consists of upper and lower sloping trendlines that converge to create a triangle pattern with equal angles. This pattern suggests that a significant price movement in either direction can be expected.
- Entry: A break above the upper trendline could lead to a long position, while a break below the lower trendline might result in a short position.
- Take Profit (TP): The profit target might be determined by measuring the height of the triangle at its widest point and adding/subtracting that value to/from the breakout point.
- Stop Loss (SL): A stop-loss in a long position might be placed below the lower trendline while in a short position – above the upper trendline.
Rectangles
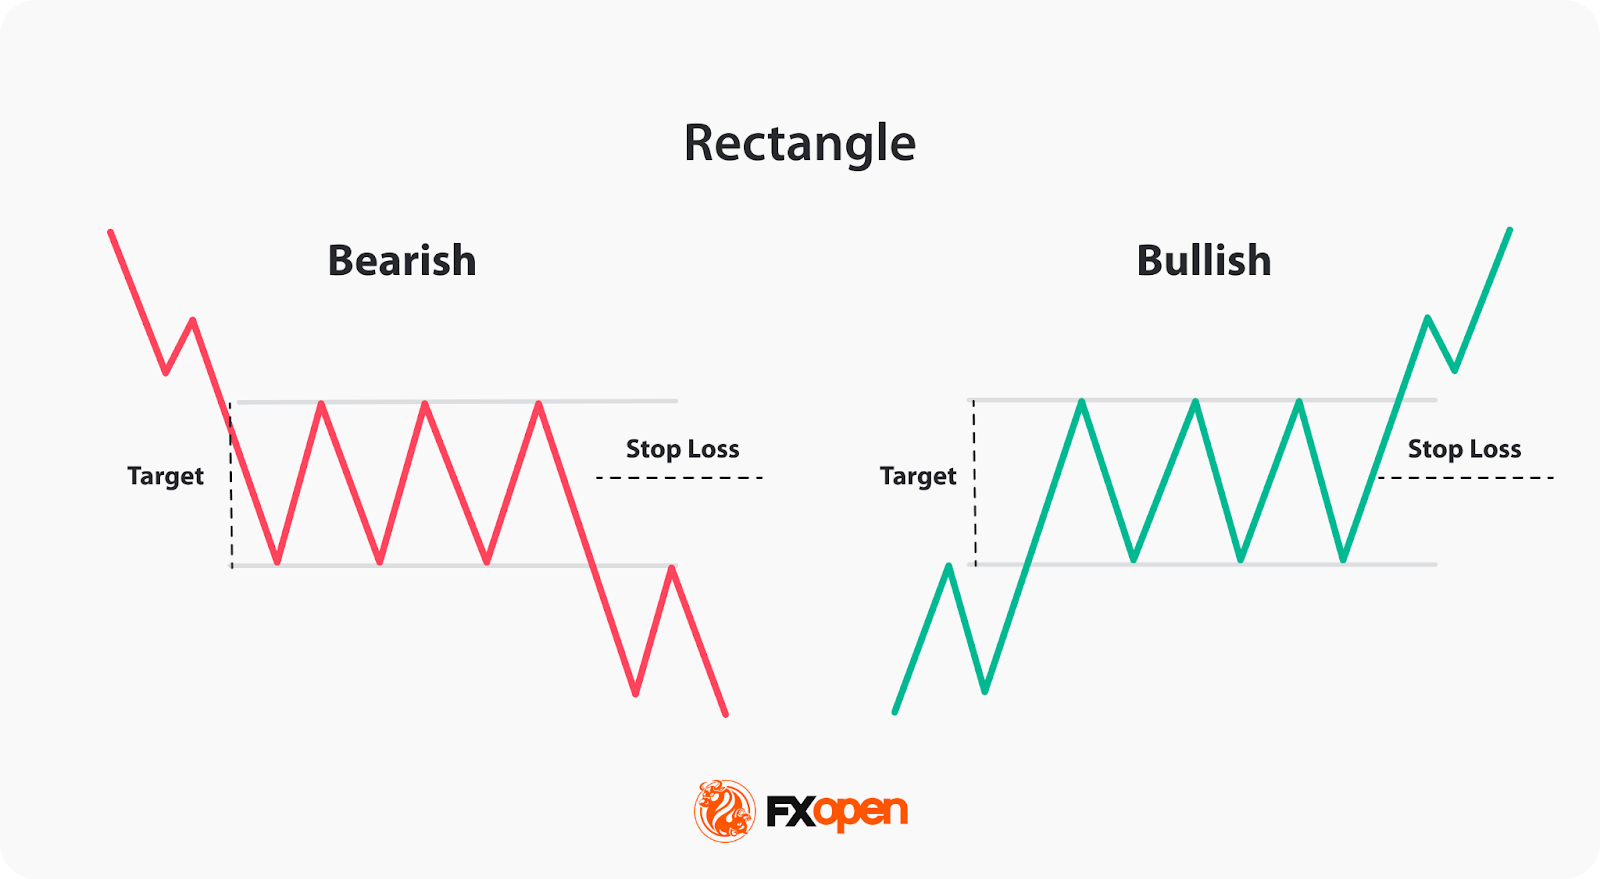
Bullish and bearish rectangles are continuation formations in pattern trading in forex that usually manifest during the midst of an uptrend or downtrend, respectively. They are characterised by two parallel horizontal lines that form a rectangle shape and serve as resistance and support lines depending on whether it's a bullish or bearish pattern. A price break above/below the resistance/support line suggests trend continuation.
- Entry: Traders may consider entering a long/short position when the price breaks above/below the resistance/support level within the rectangle.
- Take Profit (TP): The profit target might be determined by measuring the height of the rectangle and adding/subtracting that value to/from the breakout point. This gives an estimate of how far the price may move in the corresponding direction.
- Stop Loss (SL): A stop-loss order might be placed slightly above/below the support/resistance line within the rectangle.
Flags
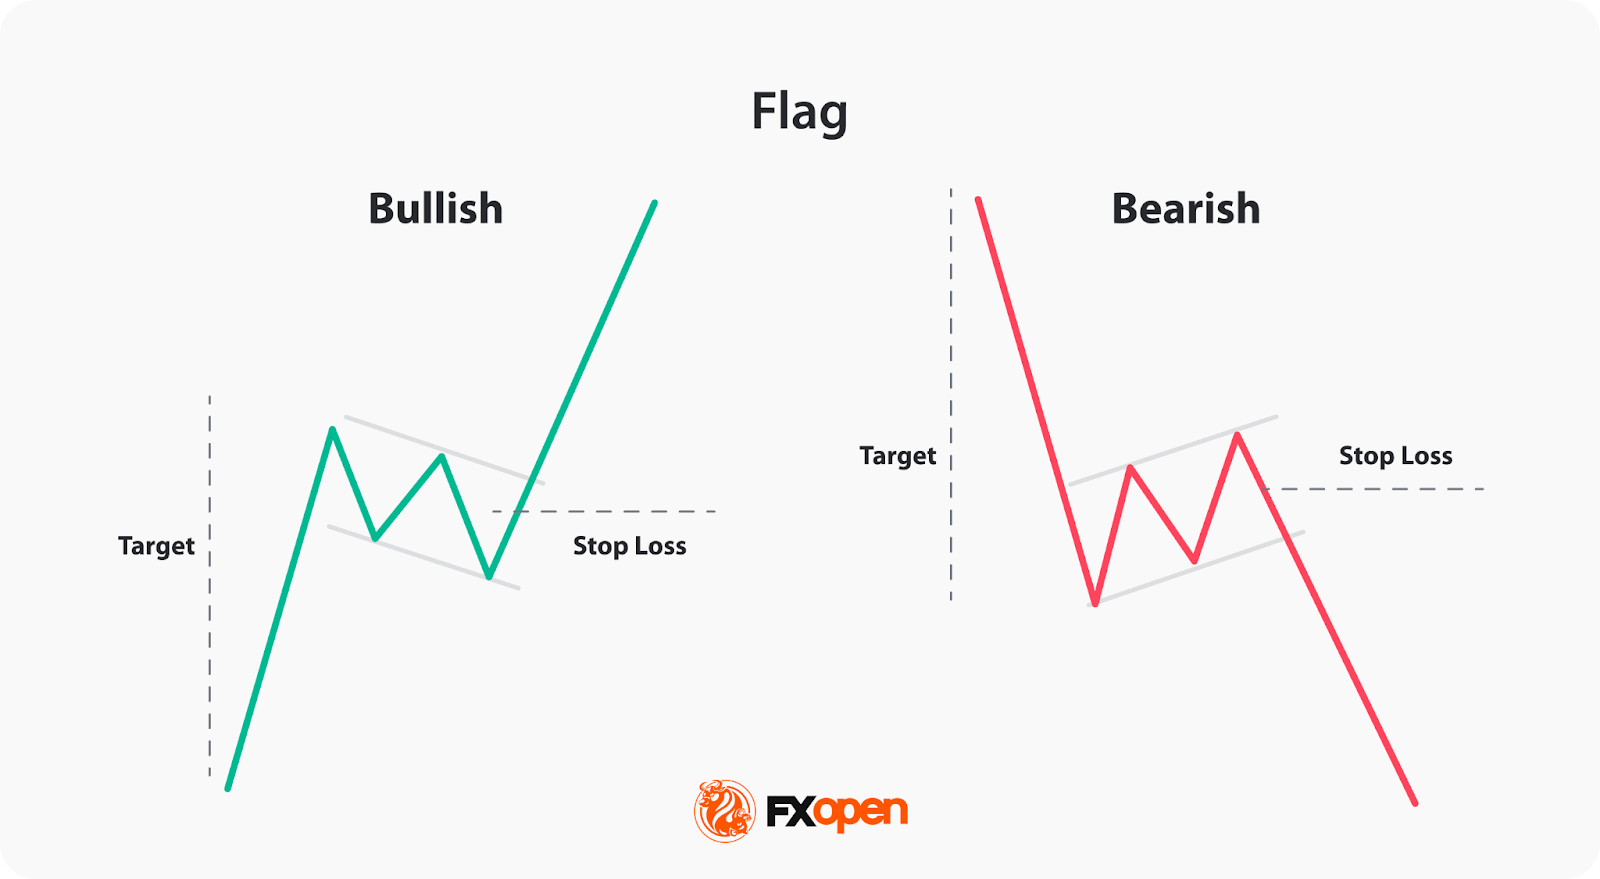
Bullish and bearish flags are important when learning how to read forex charts. These are continuation patterns appearing during an existing uptrend or downtrend, respectively. Flag patterns resemble a flag on a pole, with two parallel lines sloping downward/upward, acting as support or resistance.
- Entry: Traders may consider initiating long/short positions when the price breaks above/below the resistance/support level within the bullish/bearish flag.
- Take Profit (TP): For a take-profit level, traders might measure the height of the flag pattern and project that value upward/downward from the breakout point.
- Stop Loss (SL): Traders might place their stop-loss orders slightly below the resistance line and above the support line in bullish/bearish flags, respectively.
If you want to test different charting tools, you can consider using FXOpen’s trading platform, TickTrader.
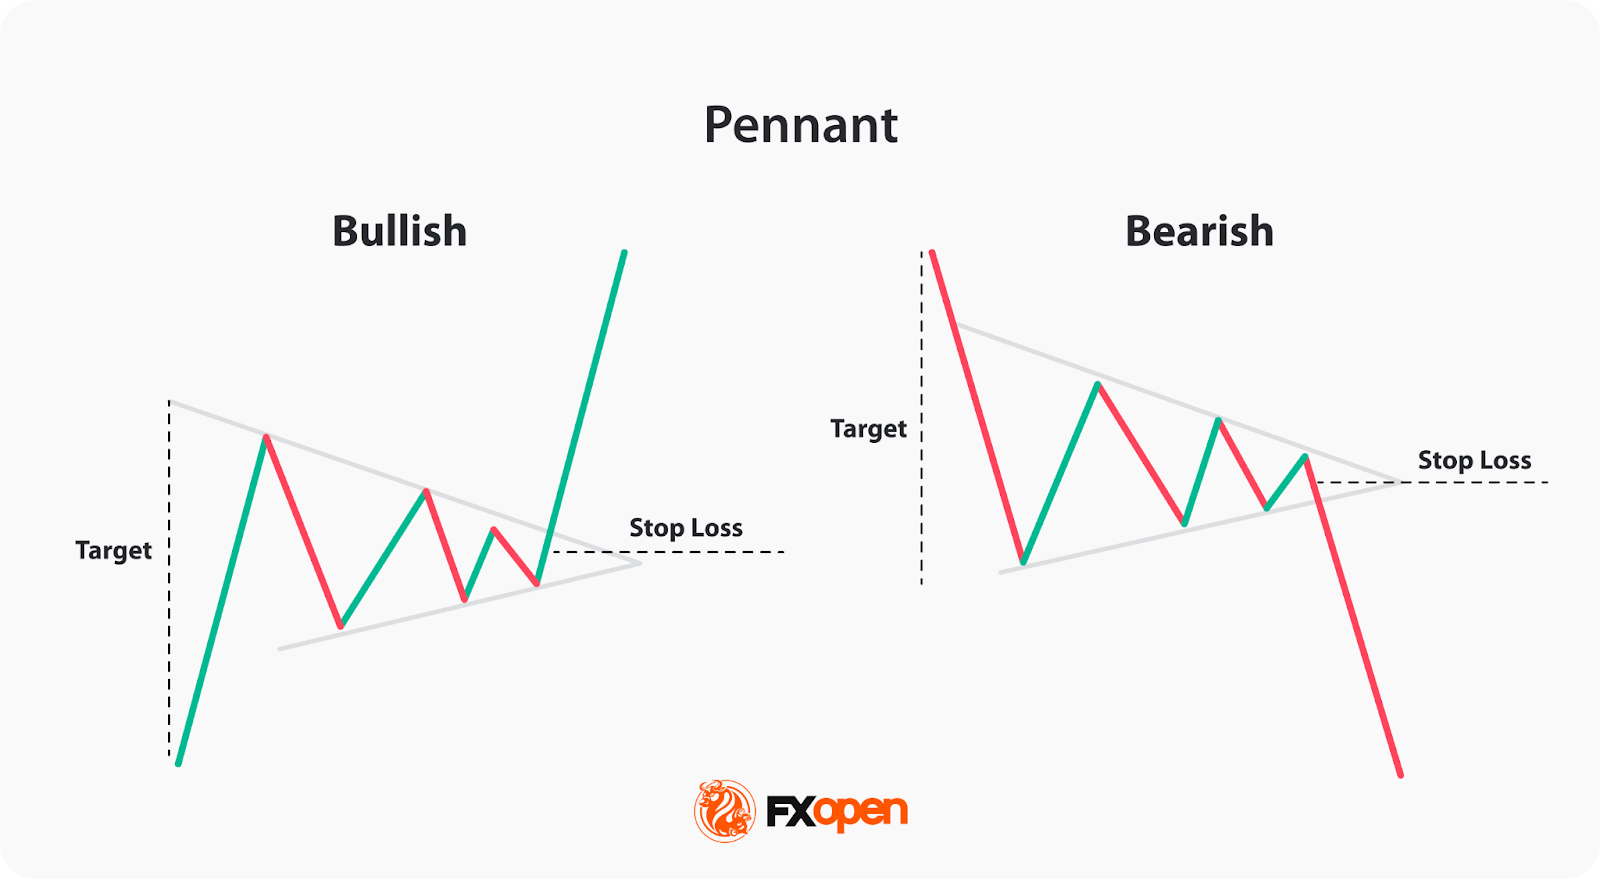
Pennants
Traders often look for bullish and bearish pennants when trying to analyse a currency exchange chart. The pennants typically occur within an existing uptrend or downtrend, indicating a brief consolidation period before a potential trend continuation. Pennants resemble a small symmetrical triangle shape, which is defined by converging trendlines. The upper trendline acts as resistance, and the lower trendline serves as support.
- Entry: A long/short position could be initiated when the price breaks out of the pennant formation – above/below the resistance/support trendline, respectively.
- Take Profit (TP): To estimate the profit-taking point, traders might measure the height of the pennant formation and add or subtract that value from the breakout point.
- Stop Loss (SL): Traders might place their stop-loss orders slightly outside the pennant formation – below/above the support/resistance trendline for a long/short trade.
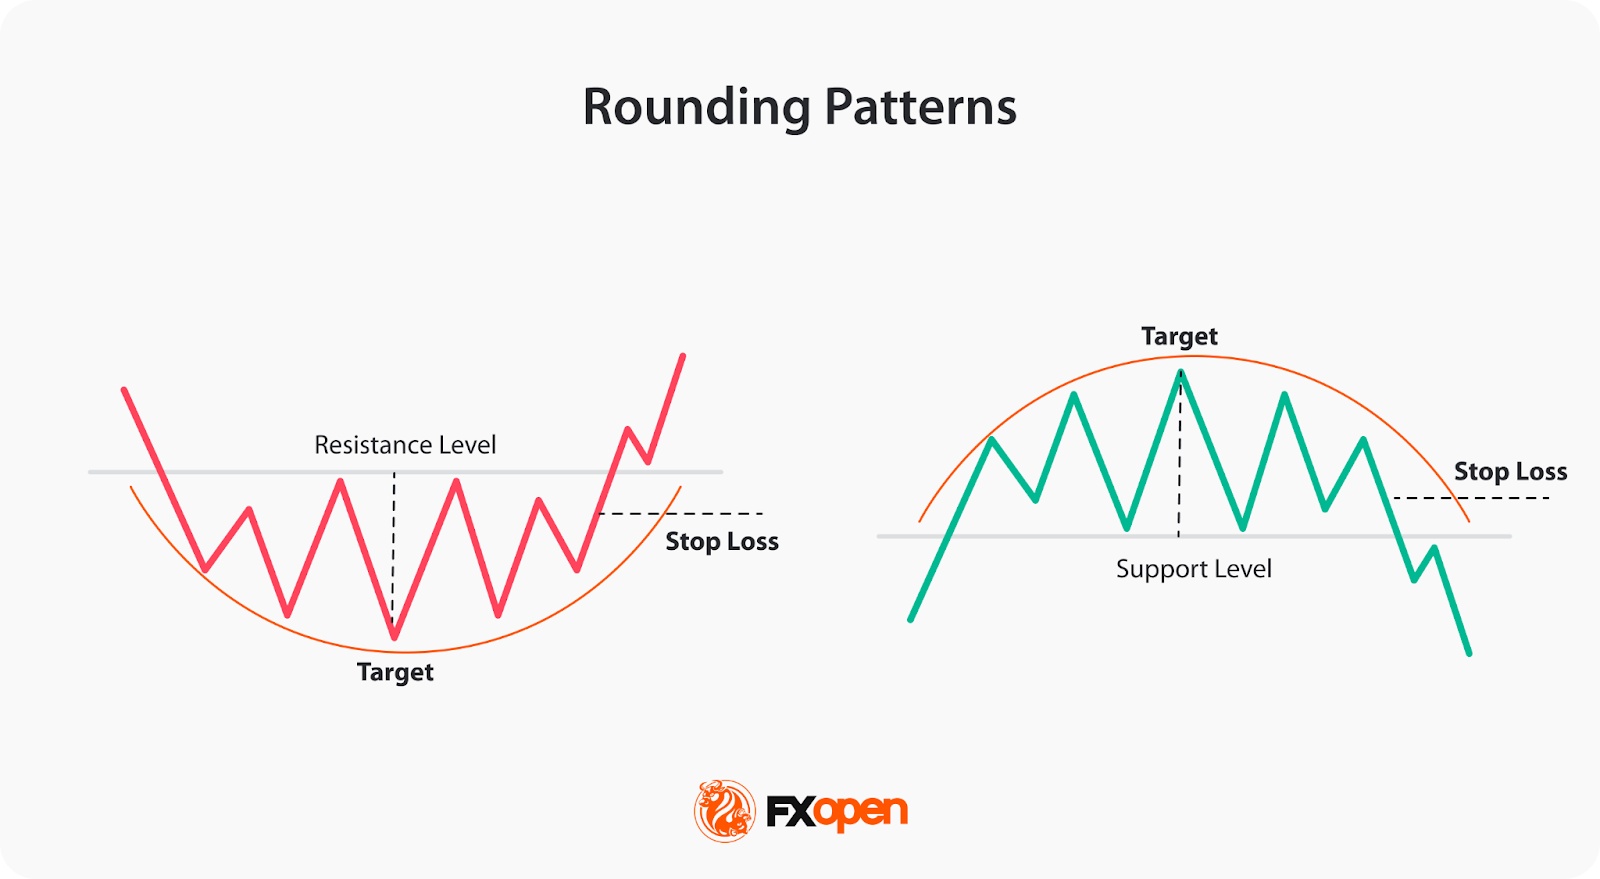
Rounding Top/Bottom
Rounding top and rounding bottom patterns are reversal patterns in forex trading. The rounding top is a bearish reversal pattern appearing in an uptrend, while the rounding bottom is a bullish reversal pattern appearing in a downtrend. Both patterns are characterised by a gradual curve in price action, resembling the shape of a rounded top or bottom, which signifies a shift in market sentiment.
- Entry: For the rounding top, an entry signal could occur when the price breaks below the support level formed at the bottom of the rounding curve. Conversely, for the rounding bottom, traders might consider entering long positions when the price breaks above the resistance level at the top of the rounding curve.
- Take Profit (TP): Traders might measure the height of the rounding formation and apply that measurement from the breakout point in the direction opposite to the prior trend for an estimate of how far the price may reverse.
- Stop Loss (SL): Traders might place their stop-loss orders just beyond the breakout level.
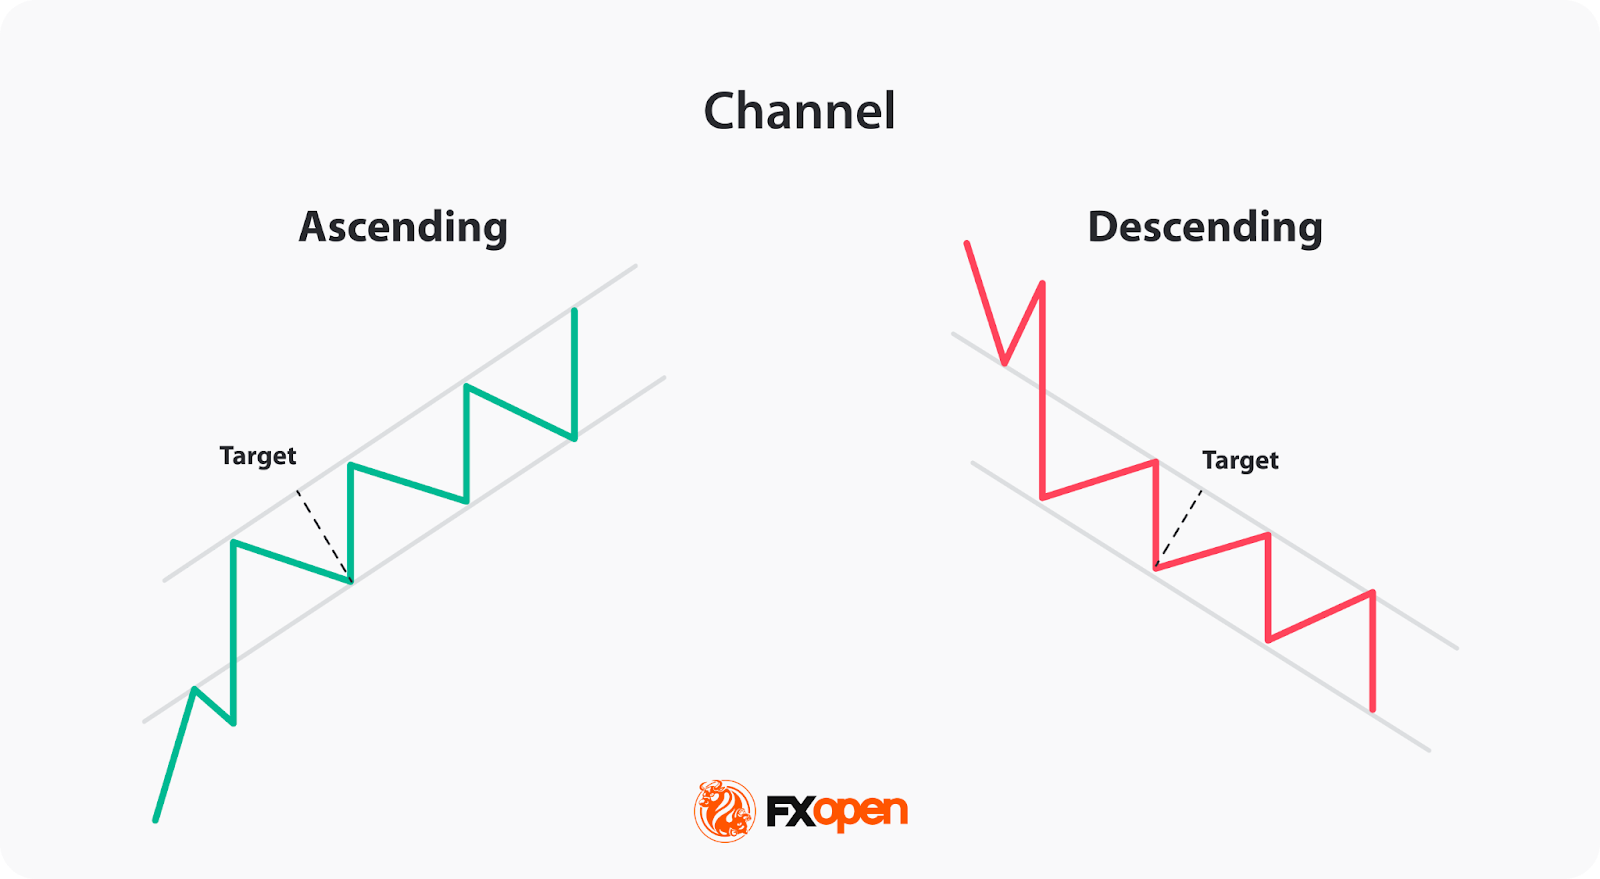
Channels
Ascending and descending channel patterns are another fundamental structure observed when analysing trading graph patterns. Channels may help identify potential trends, whereby ascending channels slope upwards, suggesting bullish tendencies while descending channels slope downwards and are associated with bearish trends.
This pattern features two parallel trendlines, with the lower trendline serving as support and the upper trendline acting as resistance. The price tends to move between these lines, signifying an uptrend/downtrend, forming higher highs and higher lows and lower highs and lower lows, respectively.
- Entry: In an ascending/descending channel, traders may consider going long/short when the price bounces off the support/touches the resistance trendline.
- Take Profit (TP): If a trader opens positions within the channel, they may target resistance in an ascending channel and support in a descending one.
- Stop Loss (SL): In an ascending/descending channel, a stop loss might be positioned below/above the support/resistance trendline.
Closing Thoughts
In the forex market, chart patterns create a picture of market sentiment, offering traders a language to interpret price action and make trading decisions. Remember, though, that while chart patterns provide valuable insights, they are usually used in conjunction with complementary technical analysis tools, including indicators and candlestick patterns, and solid risk management.
You can consider opening an FXOpen account and access over 700 CFD markets, low commissions from $1.50 per lot and tight spreads from 0.0 pips. Good luck!
FAQ
Are There the Most Accurate Patterns in Forex?
No chart pattern guarantees 100% accuracy, as forex is influenced by multiple variables including macroeconomic data, liquidity, and market sentiment. Some patterns are used more often than others. Patterns such as head and shoulders, double tops and bottoms, and ascending or descending triangles are used by traders with any experience level. Still, even these formations are combined with additional confirmation tools—such as indicators, candlestick analysis, and risk management techniques.
Are There the Most Successful Chart Patterns?
There are no universally successful chart patterns. Market conditions, liquidity levels, and macroeconomic factors change constantly, which means a pattern that performs well in one context may fail in another. Patterns’ signals depend on market context, confirmation, and risk management. Chart patterns are viewed as tools for reading potential market sentiment but not as a guarantee of a certain price movement.
This article represents the opinion of the Companies operating under the FXOpen brand only. It is not to be construed as an offer, solicitation, or recommendation with respect to products and services provided by the Companies operating under the FXOpen brand, nor is it to be considered financial advice.
Stay ahead of the market!
Subscribe now to our mailing list and receive the latest market news and insights delivered directly to your inbox.


Latest articles

USD/CAD Rises to a Two-Month High
Today, the USD/CAD currency pair climbed above the 1.3787 level for the first time since late January.
→ Demand for the US dollar is being supported by concerns over escalating tensions in the Middle East. Market participants are favouring

Alphabet (GOOGL) Shares Fall to 2026 Low
As the chart shows, Alphabet (GOOGL) shares have dropped to their lowest level of 2026, with trading closing well below the psychological $300 per share mark.
Why Have Alphabet (GOOGL) Shares Declined?
The bearish move is driven by a combination

FX Market Awaits Macro Data: EUR/USD and GBP/USD Near Range Boundaries
European currencies are trading without a clear direction against the US dollar, remaining in a consolidation phase following the earlier decline driven by USD strength. At the start of the week, both EUR/USD and GBP/USD attempted a recovery,