


Top 4 Strategies for Position Trading
FXOpen

Position trading is a time-tested approach to the financial markets, allowing traders to profit from long-term trends. In this article, we’ll explore the top four strategies for positional trading, discuss the features of successful position traders, and briefly examine three essential indicators that can help with your position trading journey.
What Is Position Trading?
Position trading is a type of trading where a trader holds onto their positions for an extended period, typically ranging from weeks to months or even years. In contrast to day traders, who attempt to profit from intraday price fluctuations, or swing traders, who hold their positions for days or weeks, position traders adopt a more patient approach, allowing their trades to develop over a longer period. This can lead to potentially greater profits, as well as reduced transaction costs and stress associated with constant monitoring of the markets.
The main goal of position trading is to capitalise on long-term trends in a given market, such as stocks, forex, or commodities. Position traders typically rely on a combination of fundamental analysis, technical analysis, and market sentiment to make their trading decisions. They use this analysis to identify and participate in trends on the daily, weekly, and monthly timeframes.
Features of a Position Trader
Successful position traders often exhibit unique characteristics that set them apart from other types of traders. Some of the key features are:
- Patience: Position trading demands patience as traders wait for opportunities to arise and positions to develop over weeks, months, or years. Remaining calm and focused during market uncertainty is essential.
- Discipline: Position traders must maintain discipline in their approach. This includes sticking to their trading plan, managing their risk effectively, and resisting the urge to exit their positions prematurely.
- Long-Term Focus: Successful position traders concentrate on overall market direction, not short-term price movements, enabling them to identify opportunities that short-term traders might overlook.
- Strong Fundamental Analysis Skills: Since fundamental factors often drive long-term trends, exceptional fundamental analysis skills are crucial for gauging where the market may be headed next.
Positional Trading Strategies
Now that we have an overview of position trading let’s examine four effective positional trading strategies.
Support and Resistance Trading
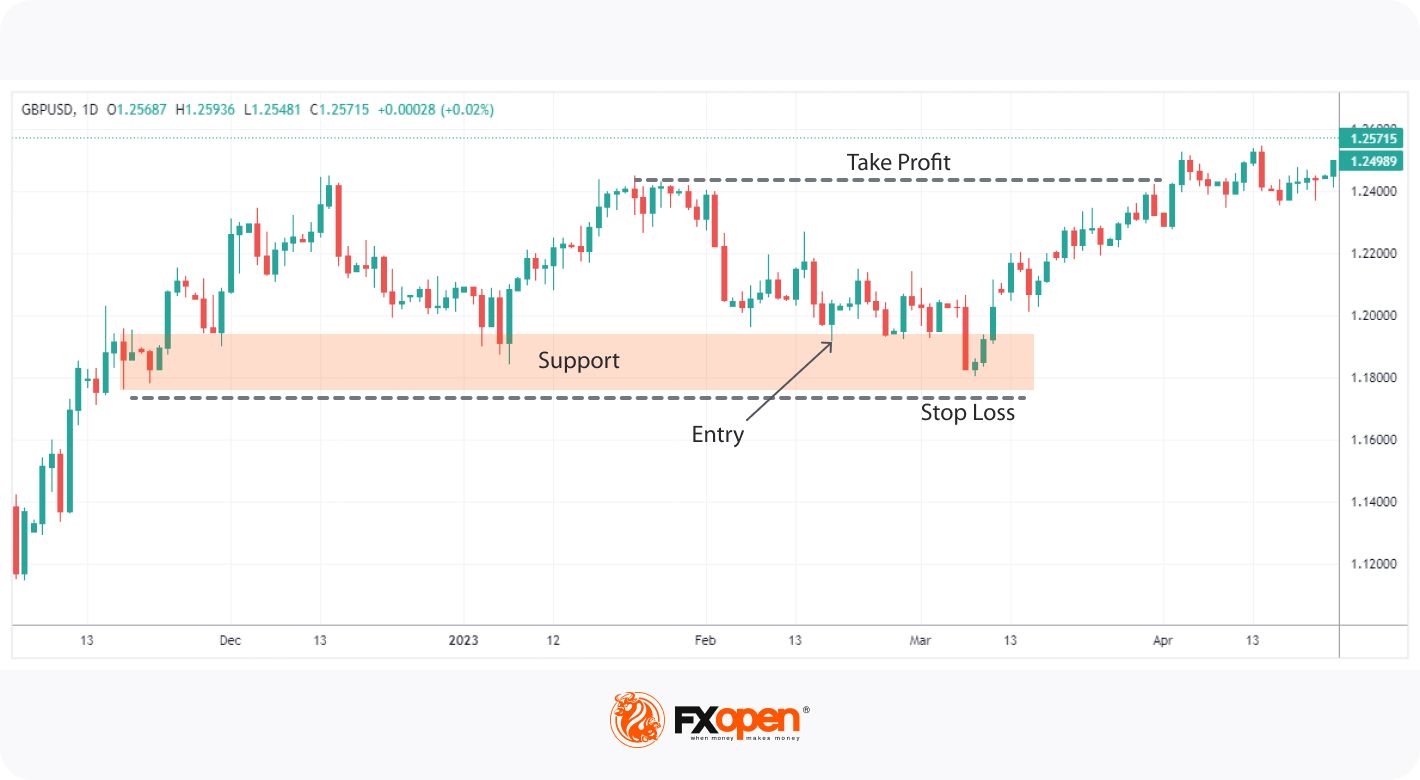
At the heart of many positional trading strategies are support and resistance. Support refers to a price level where buying interest is strong enough to overcome selling pressure, leading to a pause or reversal in a downward movement. Resistance is the opposite: a price level where sellers overtake buyers, prompting a stall or reversal in an upward trend.
Support and resistance can be identified through various methods, including:
- Examining historical turning points in the market
- Identifying broken support/resistance, which may now act as resistance/support, respectively
- Using trendlines
- Using technical indicators, like Fibonacci retracements or moving averages.
Position traders will usually highlight areas of support/resistance on the daily, weekly, or monthly charts in the direction of the broader trend, then enter a position when the price reaches the area. They may take profits at an opposing significant support/resistance level and set their stop losses beyond the area they entered at.
Breakout Trading
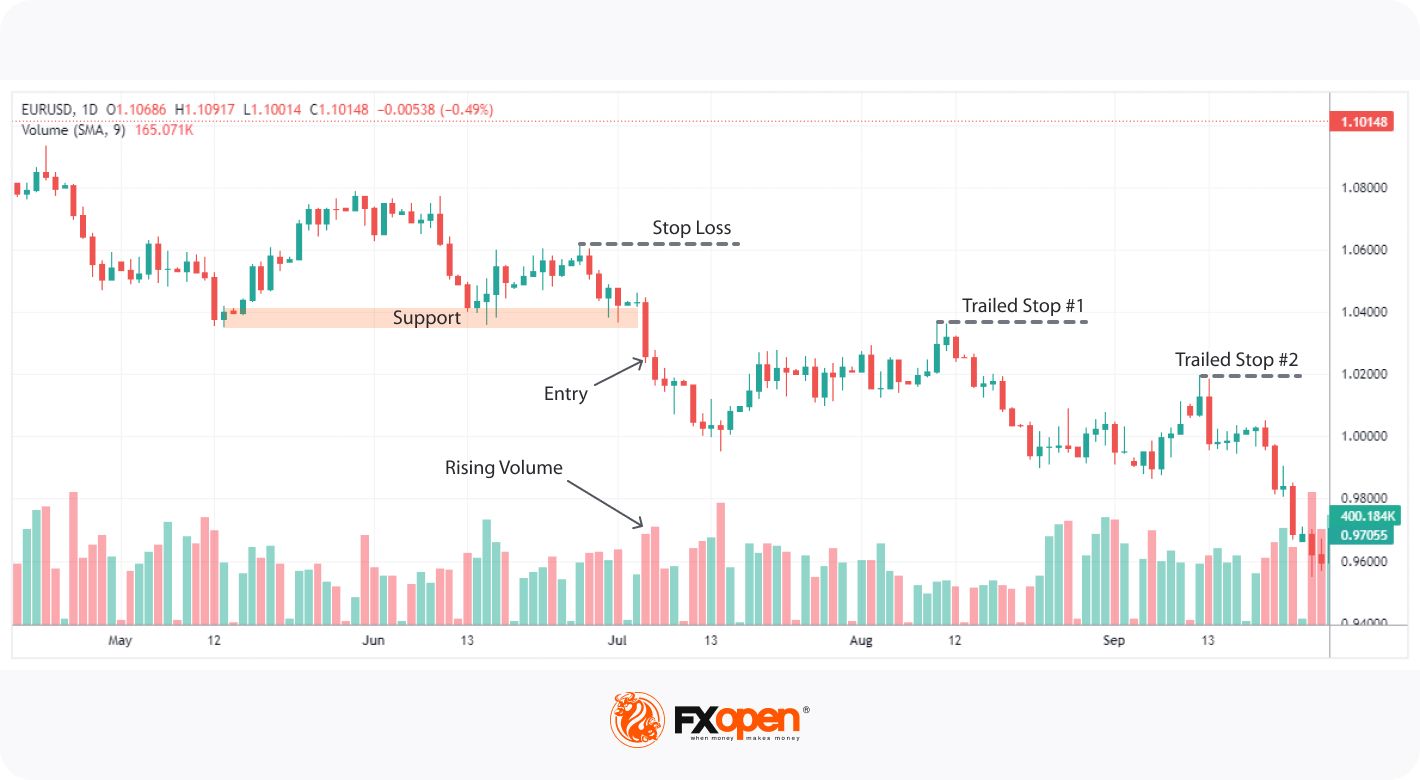
Breakout trading, as the name suggests, involves taking positions once these key areas of support or resistance are broken through. This approach can be particularly effective since it allows traders to potentially catch the start of a substantial move.
Position traders will wait for a higher timeframe support/resistance level to break. To confirm breakouts, position traders often look for an increase in volume, which may indicate a surge in market interest and momentum. It’s also best to wait for the candle to close before entering the position, as this helps to confirm the breakout.
Stop losses are usually set beyond a nearby swing point, while profits can be taken at a significant opposing level. As breakouts are generally part of a larger trend continuation, some traders may prefer to trail their stop losses at swing points to maximise profits.
Pullback Trading
Pullback trading is effectively an extension of breakout trading. However, instead of entering when the level is broken, traders wait for a retracement, allowing them to optimise their entry points and risk/reward ratio.
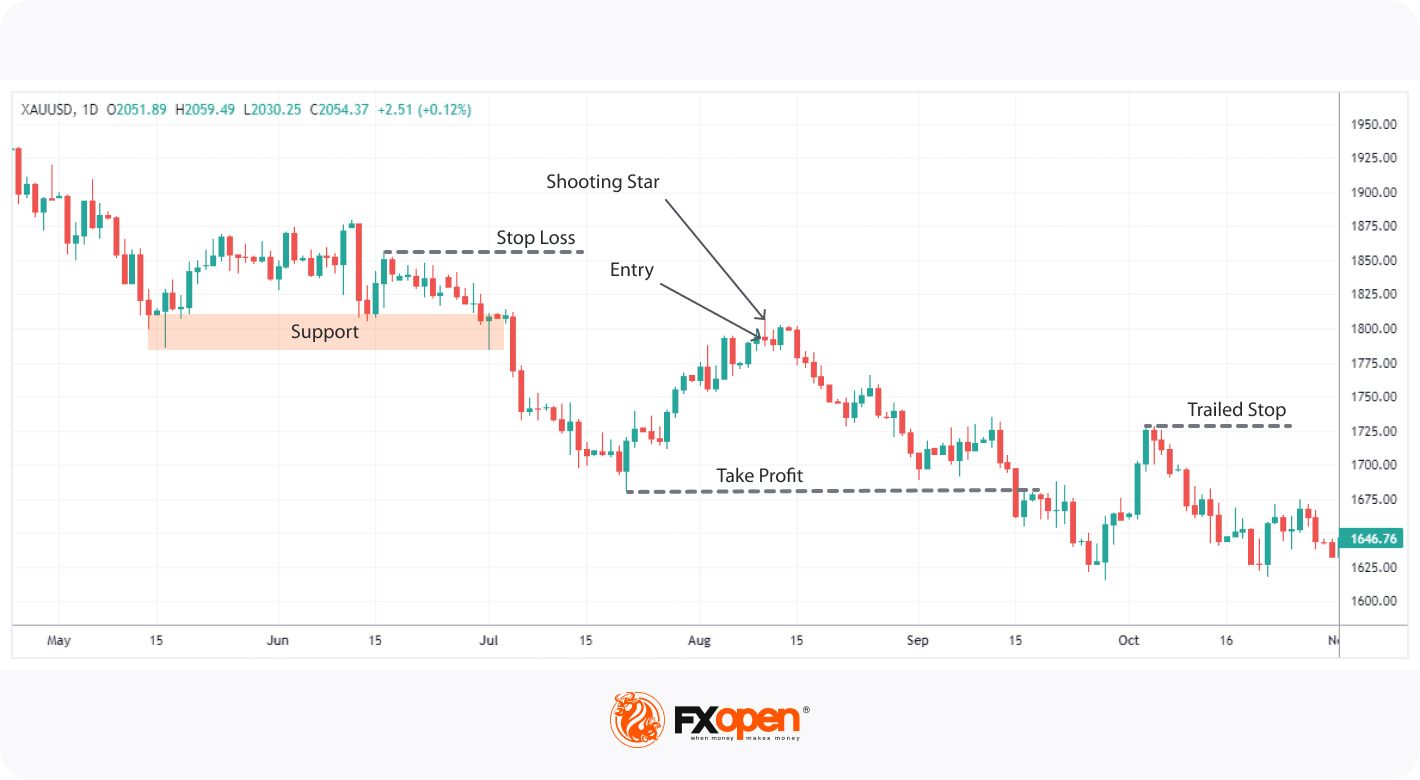
A pullback occurs when the price temporarily moves counter to its broader trend before resuming its original direction. Position traders commonly look for a retracement to a previous area of support in a downtrend (expected to act as resistance) or resistance in an uptrend (expected to act as support). Alternatively, they may use the Fibonacci retracement tool. For confirmation that the area will hold, traders will often look for reversal candlestick patterns like hammers or shooting stars.
For instance, position traders wait for a support/resistance level to be broken. However, they then observe the price action until a retracement occurs, watching for a reversal candlestick pattern. Once the pattern forms, they enter at the close of the candle.
Profits can be taken at the high or low that originated the pullback or at a significant support/resistance level. Conversely, traders may prefer to trail their stop loss as the trend progresses.
Triple Moving Averages
Moving averages (MAs) are technical indicators that smooth out price data to reveal underlying trends. By combining multiple MAs, position traders can better understand where the price may be headed next.
In this position trader’s strategy, we use the exponential moving average (EMA), which is slightly more responsive to recent price action. Simple moving averages (SMAs) are a good alternative. Want to see the difference for yourself? Hop over to FXOpen’s free TickTrader platform to find EMAs, SMAs, and a whole host of versatile trading tools.
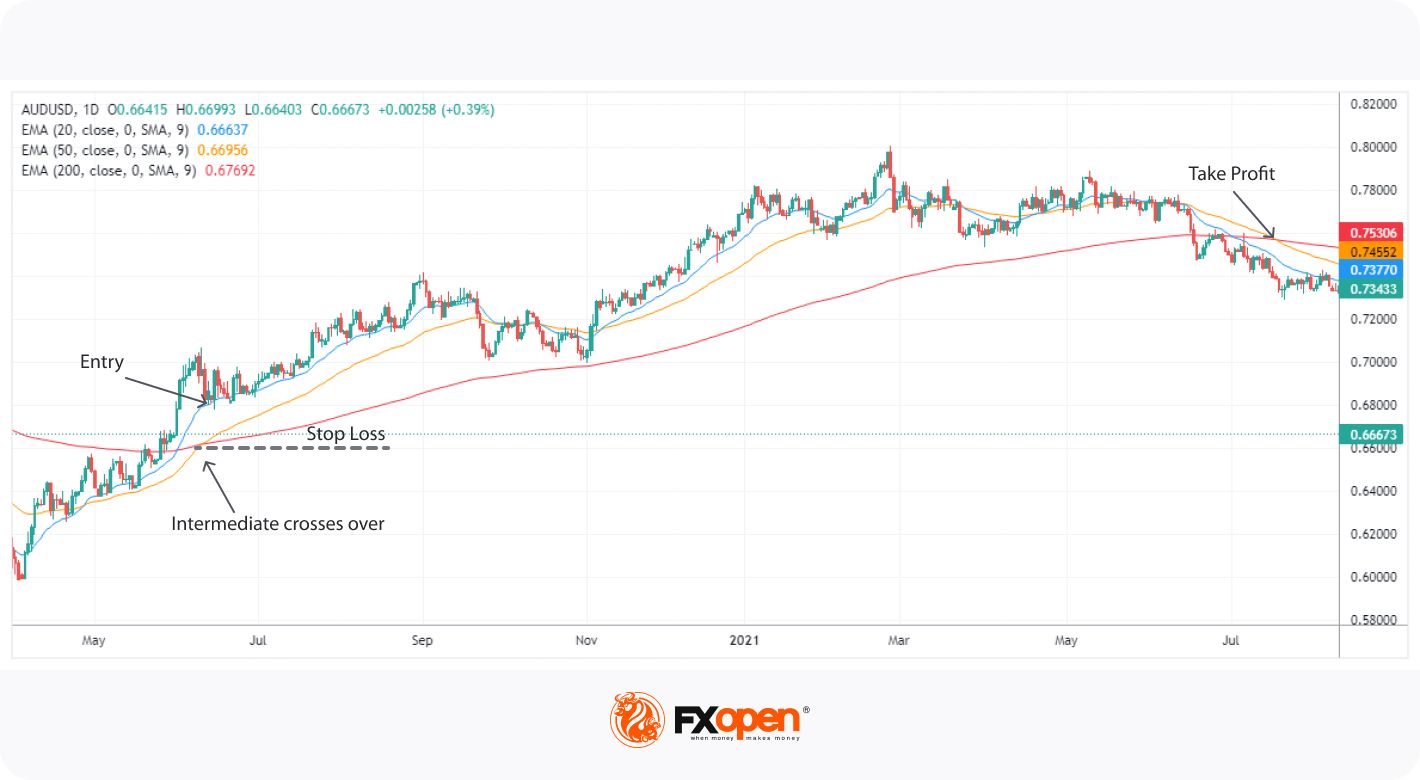
There are three components: a short-term EMA (20 periods), an intermediate-term EMA (50 periods), and a long-term EMA (200 periods). Combining the three allows us to account for both recent price changes and long-term trends. They are coloured blue, orange, and red, respectively, on the chart above.
Trades can be taken when the short-term EMA crosses the long-term, but it’s best to wait for both the short-term and intermediate-term EMAs to break through the long-term in the same direction. In doing so, we have confirmation that trend momentum is picking up.
Traders open a long position when the short and intermediate-term EMAs cross above the long-term one and open a short position when they cross below the long-term one. Stop losses can be placed just beyond the long-term EMA. The theory states that a profit can be taken when MAs cross over again.
Position Trading Indicators
Alongside the strategies listed, position traders use a variety of technical indicators to help identify and improve entries. Some of the most popular indicators employed by positional traders include:
- Relative Strength Index (RSI): RSI is a momentum oscillator that shows overbought and oversold areas, helping traders spot potential reversals.
- Bollinger Bands: Bollinger Bands are a volatility-based indicator that plots standard deviations of price. They can be used to identify impending trend reversals and periods of increased volatility.
- On Balance Volume (OBV): OBV is a volume-based indicator that measures buying and selling pressure, allowing traders to confirm potential breakouts and trend reversals by analysing changes in volume.
Final Thoughts
In summary, position trading is a unique approach that removes much of the stress of intraday styles. If you’re ready to find the best positional trading strategy for you, consider opening an FXOpen account. You’ll be able to put these strategies to the test in over 600 markets, safe in the knowledge that you’re partnering with Traders Union’s Most Innovative Broker of 2022. Good luck!
This article represents the opinion of the Companies operating under the FXOpen brand only. It is not to be construed as an offer, solicitation, or recommendation with respect to products and services provided by the Companies operating under the FXOpen brand, nor is it to be considered financial advice.
Stay ahead of the market!
Subscribe now to our mailing list and receive the latest market news and insights delivered directly to your inbox.


Latest articles

US Dollar Strengthens Amid Equity Market Weakness and Hawkish Fed Rhetoric
The US dollar continues to hold firm near multi-year highs as sentiment across equity markets deteriorates and investors increasingly expect the Federal Reserve to maintain a restrictive monetary policy stance for longer. The US economy remains resilient, while inflation risks

Bitcoin: Corrective Channel Broken as Traders Turn More Active
Bitcoin has come under the influence of several factors simultaneously. The wave of selling at the beginning of June was linked to Strategy's first disclosed Bitcoin sale in several years, a prolonged series of outflows from spot ETFs, and a

DAX 40: consolidation amid technology sell-off
A wave of selling in the technology sector that emerged earlier this week has weighed on European equities. The trigger was investor concern over the profitability of large-scale debt-funded investments by major US tech companies in AI infrastructure. The Nasdaq