Understanding the Inverted Cup and Handle Chart Pattern
FXOpen
Understanding chart patterns is fundamental for market participants. This article delves into the inverted cup and handle formation, a bearish signal indicating a potential downward movement. Explore its identification, trading strategies, psychological underpinnings, common pitfalls, and more to boost your trading knowledge.
What Is the Inverted Cup and Handle Pattern?
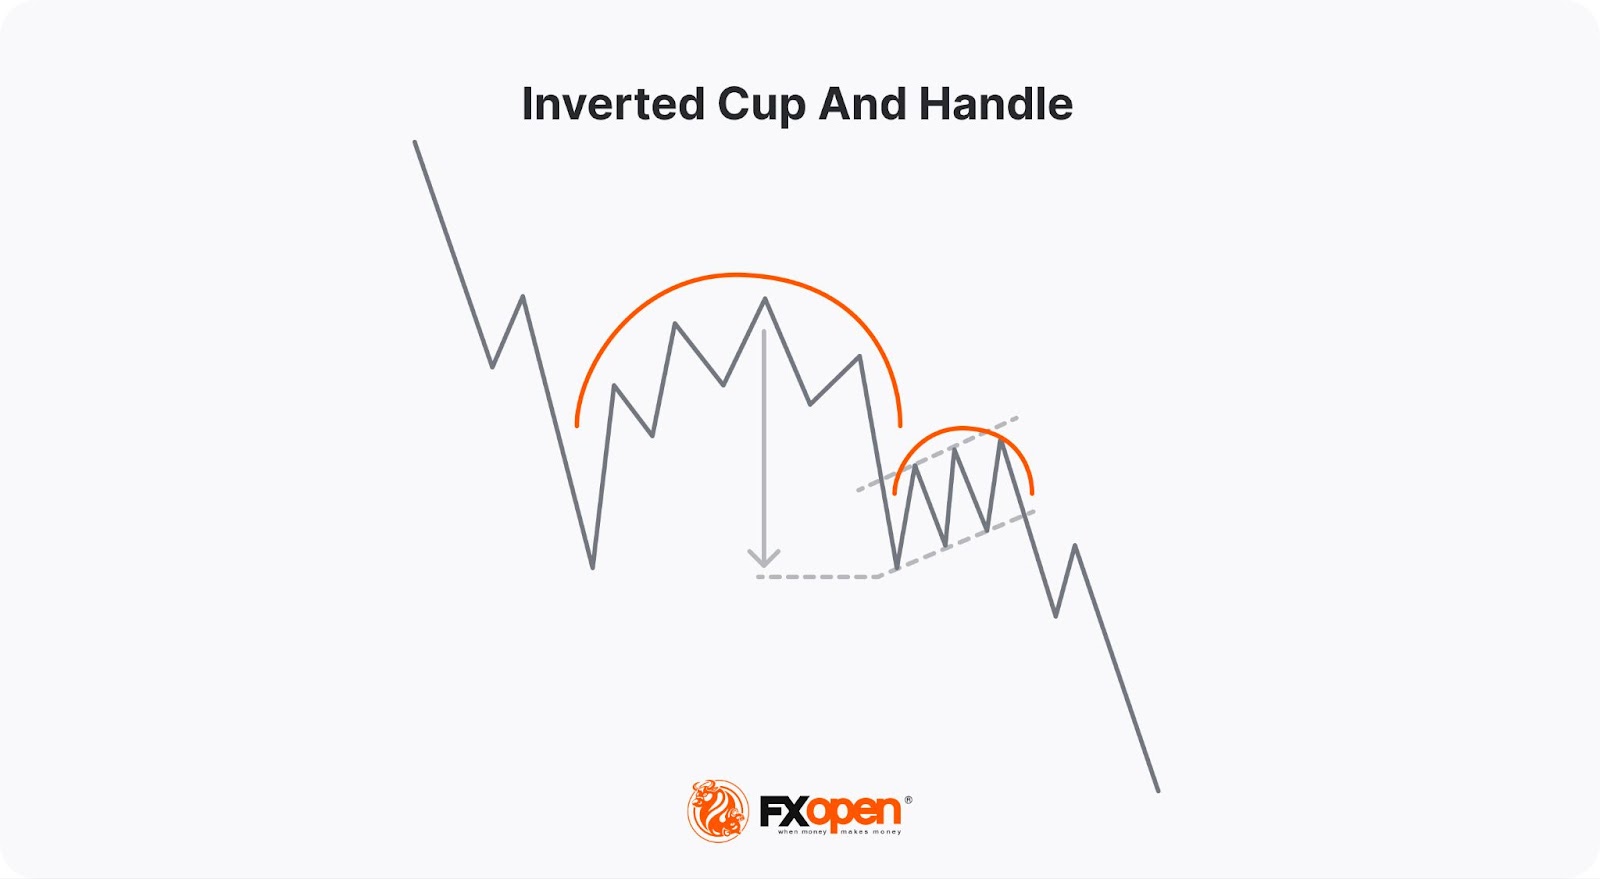
The inverted cup and handle, sometimes called an upside-down cup and handle pattern, is a bearish chart pattern that may appear during up- and downtrends. It is the opposite of the traditional cup and handle pattern, which is bullish. The inverse formation consists of two main parts: the "cup," which is an inverted U-shape, and the "handle," a small upward retracement following the cup.
Identifying the Inverted Cup and Handle Pattern
Identifying the inverse cup and handle pattern involves recognising a specific sequence of market movements that signal a potential bearish move. Here's a step-by-step overview of identifying this formation:
Cup Formation
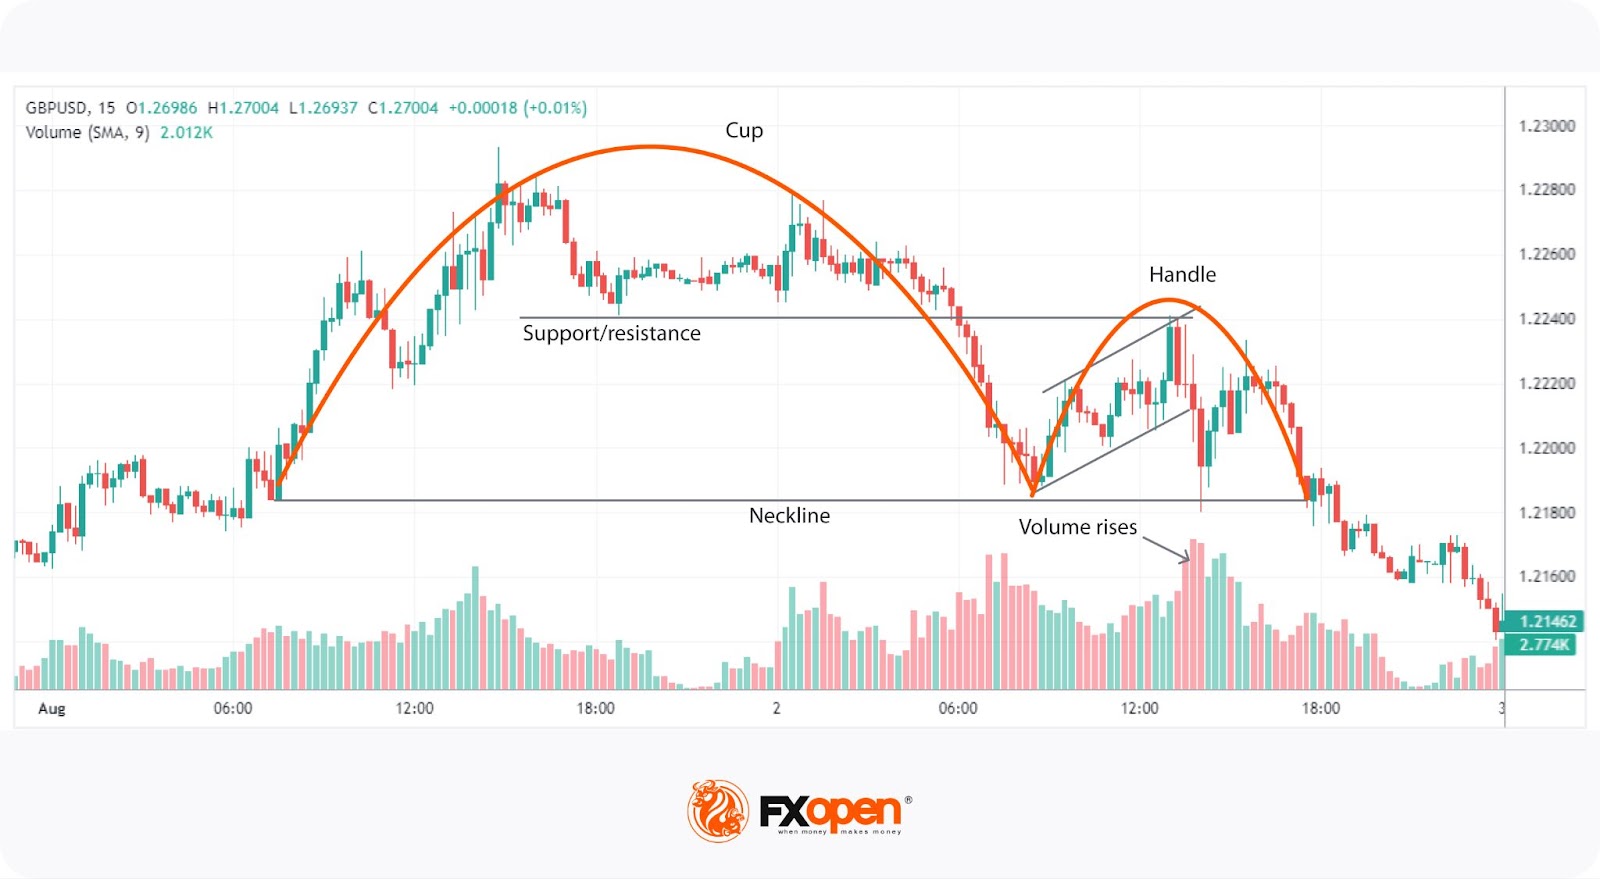
- Shape: The pattern begins with an inverted U-shaped "cup." The price gradually rises, consolidates, and then begins to decline, reflecting a shift from bullish to bearish sentiment.
- Depth: The cup should have a rounded top, not a sharp V-shape, indicating a gradual reversal. The depth of the cup can vary but typically represents a significant portion of the preceding movement.
Handle Formation
- Upward Retracement: After the cup's formation, prices usually experience a minor upward retracement or consolidation, forming the "handle." This movement should be relatively short and not exceed the initial high of the cup.
- Shape and Duration: The handle often appears as a small flag or pennant and should be brief in duration compared to the cup. An optimal handle retraces no more than half of the cup’s depth.
Breakout Confirmation
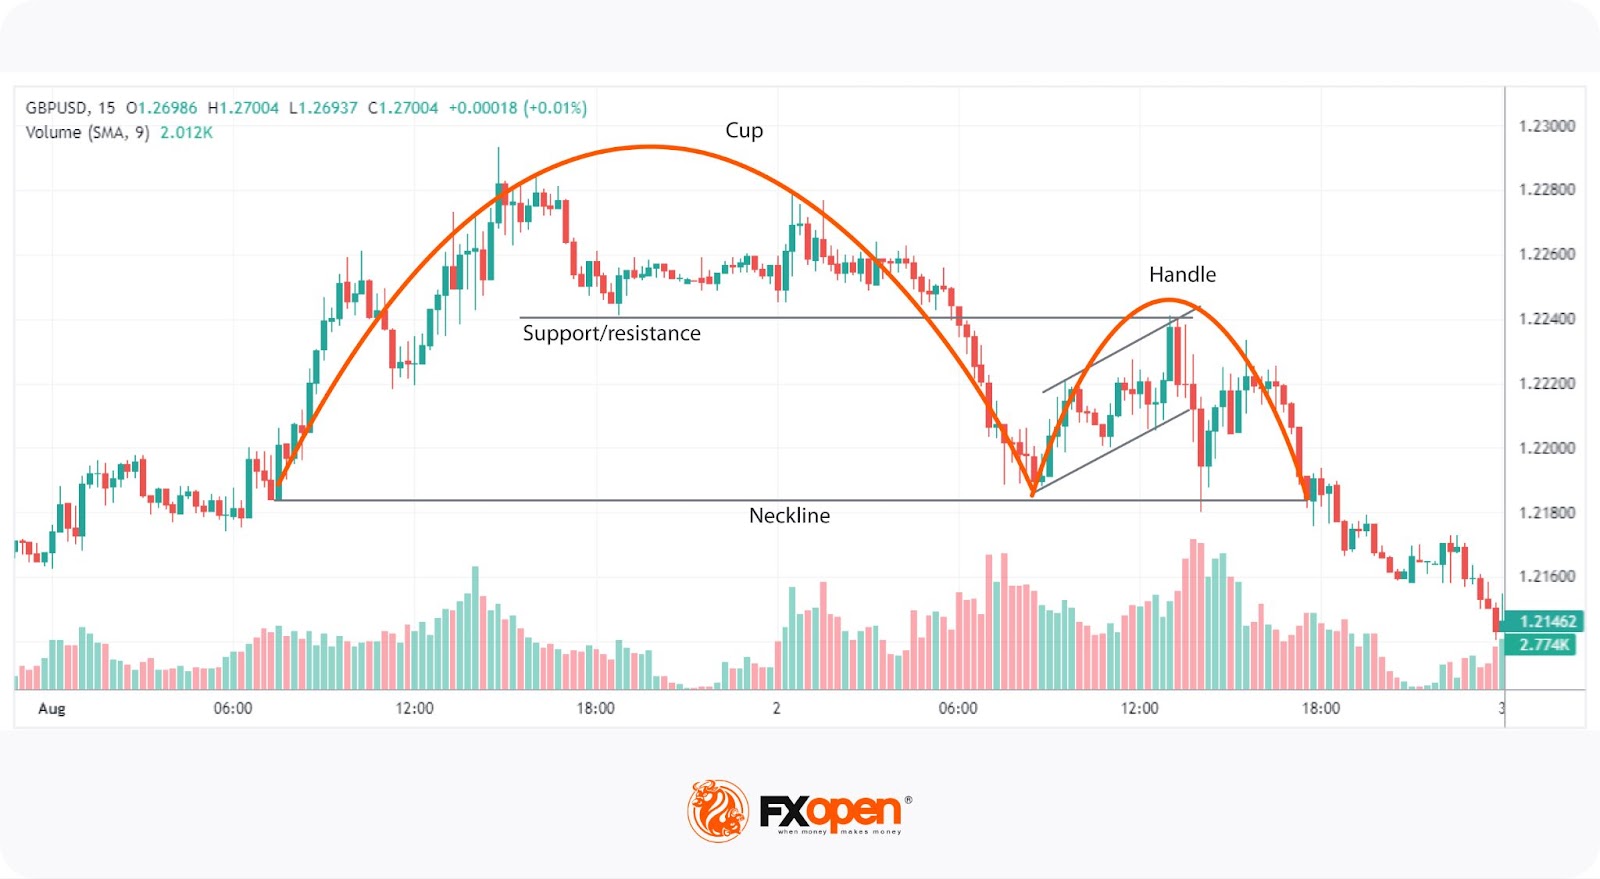
- Neckline Break: The pattern is confirmed when prices break below the neckline, the lowest point of the handle. This breakout often leads to a significant decline in prices, signalling a bearish trend.
- Volume Surge: Volume typically decreases during the formation of the cup and increases as prices decline, especially during the handle formation. A substantial increase in volume during the breakout can validate the pattern and minimise the risk of false signals.
The Psychology of the Inverted Cup and Handle
The psychology behind the inverse cup and handle pattern is rooted in market sentiment and behavioural finance. This bearish pattern reflects a shift from optimism to pessimism among traders.
- Initial Uptrend: The formation starts with an upward movement, where traders are generally bullish, driving prices higher. This phase is marked by growing confidence and increasing demand.
- Formation of the Cup: As prices peak, consolidate, and start to decline, some traders begin to take profits, leading to reduced buying pressure. The rounded decline of the cup signifies a gradual shift in sentiment from bullish to bearish as traders become cautious and selling pressure mounts.
- Handle Formation: The minor upward retracement forming the handle indicates a brief period of consolidation where the market tests the resolve of buyers. It can be considered a dead cat bounce. This phase often traps optimistic traders who expect the uptrend to resume, but the overall sentiment remains fragile and cautious.
- Breakout and Decline: The decisive break below the neckline represents a culmination of bearish sentiment. At this point, selling pressure overwhelms any remaining bullishness, leading to a sharp decline. The volume surge during this breakout confirms the shift in market psychology from hopeful to bearish as traders rush to exit their positions or initiate short sales.
Trading the Inverted Cup and Handle Pattern
Trading the inverted cup and handle pattern involves careful identification and strategic decision-making to maximise potential returns. This pattern presents two primary entry points for traders: during the handle formation or after the neckline break.
FXOpen's advanced TickTrader platform allows users to identify the inverted cup and handle formation in real-time across hundreds of markets.
Entry on the Break of the Handle
- Risk-Reward Advantage: Entering on the breakout of the handle’s lower boundary offers a better risk-to-reward ratio but requires more skill and confidence in pattern recognition.
- Technical Tools: Traders often use a medium-term moving average (like 21 periods) to confirm the downward leg of the handle. A decisive close below the moving average indicates a continuation of the downward handle leg.
- Momentum Indicators: Using momentum indicators like the RSI (Relative Strength Index) or stochastic oscillator helps confirm downward movement. Bearish divergence suggests that the bearish trend is likely to continue.
- Volume Analysis: Increasing volume during the handle's breakout indicates strengthening seller control. High volume often validates the pattern and potentially reduces the risk of false signals. Note that volume data may be less reliable in a decentralised forex market.
- Stop Loss and Profit Target: Traders typically place a stop loss above the handle's high to potentially protect against upward spikes. The reverse cup and handle pattern target is usually set at a distance equal to the cup's height, projected downward from the handle's breakout point, although it can be greater if the retracement is particularly shallow.
Entry After the Neckline Break
- Confirmation Advantage: Waiting for the neckline break offers greater confirmation of the formation but may provide a less favourable risk-to-reward ratio.
- Price Action: A decisive close below the pattern's low, ideally with a strong candlestick and minimal wicks, indicates a reliable breakout. This typically confirms the bearish trend and provides a clear entry signal.
- Volume Confirmation: Higher volume during the neckline break can further validate the pattern and indicate that the breakout is genuine and not a false signal.
- Stop Loss and Profit Target: In this scenario, the stop loss is typically set above the handle's high. The profit target remains the same, projecting the cup's height downward from the breakout point.
Common Mistakes to Avoid
When trading the upside-down cup and handle pattern, avoiding common mistakes is key for maximising potential returns. Some of the more common mistakes traders make include:
- Premature Entry: Entering a trade too early, before the handle completes or the neckline breaks, can lead to false signals and losses. Most traders wait for clear confirmation, such as a decisive close below the neckline with increased volume.
- Ignoring Volume: Volume is a critical component in confirming the pattern. Low volume during the breakout phase may indicate a fakeout. Traders typically look for a substantial increase in volume to validate the pattern.
- Incorrect Pattern Identification: Misidentifying the pattern is a common error. The cup should have a rounded bottom, not a sharp V-shape, and the handle should be relatively short. Accurate identification requires practice and attention to detail.
- Overlooking Market Conditions: External factors, such as news events or broader market trends, can impact the pattern’s reliability. Traders consider these conditions when planning their trades.
Advantages and Disadvantages
As with all chart patterns, the inverted cup and handle pattern comes with its pros and cons. Here are some key advantages and disadvantages of using this pattern:
Advantages
- Clear Signal: The pattern provides a clear signal of a potential bearish movement, helping traders anticipate market declines.
- Risk Management: With defined entry and exit points (handle high for stop loss and cup depth for profit target), it aids in effective risk management.
- Flexibility in Analysis: Several forms of analysis, from support/resistance and momentum indicators to volume and price action, can be used to trade the pattern.
- Versatility: Applicable across various timeframes and markets, including stocks, forex, and commodities, making it a versatile tool for different trading strategies.
Disadvantages
- Complex Identification: Accurately identifying the pattern can be challenging, requiring significant experience and skill.
- Rarity: The pattern doesn’t occur frequently, limiting trading opportunities.
- False Breakouts: Like all chart patterns, it is susceptible to false breakouts, especially if not confirmed with volume and other technical indicators.
- Timing Sensitivity: Entering too early during the handle formation can result in premature positions, while waiting for the neckline break might reduce the risk-to-reward ratio.
The Bottom Line
Mastering the inverted cup and handle pattern can help boost your trading performance. To put this knowledge into practice with tight spreads from 0.0 pips, low commissions, and access to four trading platforms, open an FXOpen account. With over 600+ markets to choose from, FXOpen provides a comprehensive trading environment for all your needs.
FAQ
What Is the Inverse Cup and Handle Pattern in Forex?
The inverse cup and handle pattern in forex is a bearish chart pattern. It features an inverted U-shaped cup followed by a small upward retracement (the handle). This pattern suggests that sellers are gaining control, and prices are likely to decline further once the neckline is broken.
How Can You Trade the Inverse Cup and Handle?
Traders can enter positions either on the break of the handle’s lower boundary or after the neckline break. Entering during the handle might offer a better risk-to-reward ratio, while waiting for the neckline break provides greater confirmation. Key tools to validate the breakout include moving averages, momentum indicators like RSI or stochastic oscillator, and volume analysis.
What Happens After the Reverse Cup and Handle Pattern?
After the reverse cup and handle pattern is completed, the price typically moves downward strongly. This bearish movement is often confirmed by a strong breakout below the neckline with increased volume, signalling a sustained decline in prices.
What Is the Opposite of the Cup and Handle?
The opposite of a cup and handle is the inverse cup and handle pattern. While the cup and handle indicates a bullish movement, the inverse version signals a bearish trend.
Is the Inverted Cup and Handle Bullish or Bearish?
The inverted cup and handle pattern is bearish. It indicates that the price will move downwards, suggesting that traders may open short trades.
This article represents the opinion of the Companies operating under the FXOpen brand only. It is not to be construed as an offer, solicitation, or recommendation with respect to products and services provided by the Companies operating under the FXOpen brand, nor is it to be considered financial advice.
Stay ahead of the market!
Subscribe now to our mailing list and receive the latest market news and insights delivered directly to your inbox.


Latest articles

Market Analysis: GBP/USD Turns Bullish Again While EUR/GBP Drops More
GBP/USD is showing positive signs above 1.3440 and 1.3460. EUR/GBP declined and is now consolidating losses below 0.8680.
Important Takeaways for GBP/USD and EUR/GBP Analysis Today
· The British Pound started a fresh increase

Netflix 2026: Reversal on the Deal, Pullback on Earnings
Fundamental Background
At the end of February, Netflix withdrew from the bid for Warner Bros. Discovery assets after WBD’s board deemed Paramount Skydance’s $31-per-share offer more attractive. Netflix chose not to raise its own bid of $27.75